It’s a Tuesday evening at an online grocery retailer, and the “Place Order” button has started spinning forever — not for everyone, just about one shopper in twenty. Baskets are being abandoned. The on-call engineer opens the only dashboard she has: CPU fine, memory fine, servers “green.” Yet checkout is broken. She SSHes into a box and starts grep-ing a log file, hunting for she-doesn’t-know-what. Forty minutes in, the incident is still open — she has plenty of data but no way to ask it a question.
That gap — between collecting data and being able to interrogate it — is the difference between monitoring and observability. The fastest way to understand the field is a hospital: a patient is watched by vital-sign monitors that beep when heart rate crosses a threshold (your metrics), documented in the doctor’s notes recording what happened and why (your logs), and tracked through their journey between departments on a timeline showing where they waited (a trace). No single view is enough to run a hospital, and none is enough to run a software system. Together they are the three pillars of observability.
By the end you’ll know what each pillar is, what it looks like, what it answers, what it costs, and how the three combine in a real incident to turn a forty-minute fishing expedition into a five-minute fix — plus the vocabulary around them (structured logging, counters and histograms, spans, dashboards, alerts, SLIs and SLOs), the tools behind each pillar (Prometheus, Grafana, Loki, ELK, Jaeger, Tempo, CloudWatch, Azure Monitor, Datadog), and a free hands-on lab.
What problem this solves
Every production system eventually misbehaves in a way nobody predicted. When it does, answering questions quickly is the difference between a blip and a headline outage. Without the pillars, the questions below get answered by guessing and restarting things; with them, each has a specific signal:
| The question at 2 a.m. | Which signal answers it | Without it |
|---|---|---|
| “Is something wrong right now?” | Metrics (error rate, latency, alert) | Wait for customer complaints |
| “How bad, and is it worsening?” | Metrics (trend over time) | Refresh and guess |
| “Where in our ten services is it breaking?” | Traces (the failing hop stands out) | SSH into boxes one by one |
| “Why did this specific request fail?” | Logs (the error record for that request) | grep blindly across servers |
| “Did the 6 p.m. deploy cause this?” | Metrics + logs annotated with version | Roll back everything and pray |
| “Are we meeting what we promised users?” | SLO built on a metric | Argue about anecdotes |
The pain compounds in the cloud: a modern system — load balancer, microservices, managed database, queue — scatters the story of one request across a dozen places, and observability tooling stitches it back together. It bites hardest between “one VM, one log file” and “we have a platform team” — the stage where a junior engineer who understands these basics becomes disproportionately valuable.
Learning objectives
By the end of this article you can:
- Explain monitoring vs observability — known-unknowns vs unknown-unknowns.
- Define logs, metrics, and traces: what each looks like, answers, misses, and costs.
- Write a structured log line and relate an event to a log.
- Pick correctly between the three metric types — counter, gauge, histogram.
- Read a trace as a tree of spans and point to where latency or the error lives.
- Distinguish a dashboard from an alert, and alert on customer pain, not machine trivia.
- Define SLI, SLO, and error budget in one plain sentence each.
- Map tools to pillars — Prometheus/Grafana, Loki/ELK, Jaeger/Tempo, CloudWatch, Azure Monitor, Datadog — and place OpenTelemetry.
Prerequisites & where this fits
You need very little: comfort in a terminal, a rough idea of what a web request is, and Docker for the lab. No prior monitoring experience — this article is the on-ramp.
It’s the foundation of the observability track. The next layers are the query languages and practices: PromQL in Anger for metrics, KQL for Azure Monitor and Log Analytics for logs on Azure, Distributed Tracing End-to-End for traces, and SLOs and Error Budgets in Practice to formalize targets. It pairs with Resiliency Patterns That Actually Work — observability tells you that and why something broke; resiliency patterns decide what happens next.
Core concepts
The hospital analogy, properly
Hold one picture in your head for the rest of this article: a patient admitted to a hospital.
Beside the bed sits a vital-signs monitor — heart rate, blood pressure, oxygen — a few numbers sampled continuously, plotted over time, with alarms on thresholds. Cheap, glanceable, perfect for spotting that something is wrong and how it’s trending. But when the alarm sounds, the monitor cannot say why. Heart rate 140 — pain? A drug reaction? The number doesn’t know.
For why, you open the doctor’s notes: timestamped, detailed entries — “14:32, patient reports chest pain after drug X; dose reduced.” Rich context, exact causes, one entry per event. The weakness is the mirror image: nobody watches a ward by reading notes in real time, and finding a pattern across a thousand patients means reading a thousand files.
And when a patient says “I was here nine hours, mostly in hallways,” no monitor or single department’s notes explains it. You need the patient journey as a timeline: admitted 09:02, triage 09:10, waited 2h40m for X-ray, X-ray 12 minutes, waited again… The bottleneck becomes instantly obvious — and it’s usually between departments, where no single department’s records show it.
| Hospital | Software equivalent | Pillar | Question it answers |
|---|---|---|---|
| Vital-signs monitor (numbers over time, alarms) | Error rate, latency, CPU sampled over time | Metrics | Is something wrong? How much? Trending? |
| Doctor’s notes (timestamped what-and-why entries) | Timestamped event records from your code | Logs | Why did this specific thing happen? |
| Patient journey across departments | One request’s path across services, timed per hop | Traces | Where did the time or the error go? |
The “now I get it” moment: the pillars aren’t competing products. They’re three shapes of the same activity — recording what your system does — each optimized for a different question.
Monitoring vs observability: known-unknowns vs unknown-unknowns
Monitoring means deciding in advance which questions matter and wiring up answers: “alert if CPU exceeds 80%,” “graph requests per second.” These are known-unknowns — you don’t know the current value, but you knew to ask. Indispensable, and not enough.
Observability is a property of your system, not a tool: the degree to which you can answer questions you never thought to ask — unknown-unknowns — from telemetry the system already emits, without shipping new code. “Is checkout slow only for shoppers with 50+ items, only when the fraud-check API is involved?” Nobody pre-builds that dashboard; an observable system answers it anyway.
| Monitoring | Observability | |
|---|---|---|
| Core idea | Watch for predicted conditions | Ask new questions of existing data |
| Question type | Known-unknowns (“is CPU > 80%?”) | Unknown-unknowns (“why slow for 5% of users?”) |
| Artifact | Dashboards, threshold alerts | Rich, queryable, correlated telemetry |
| Shines at | Recurring, well-understood failures | Novel failures — most real incidents |
| Failure mode alone | “Everything green but the site is down” | (Includes monitoring as a subset) |
The grocery engineer had monitoring but no observability: when the system failed in an unpredicted way, she couldn’t interrogate it. You want both.
The three pillars at a glance
The whole article in one table; the rest is detail.
| Logs | Metrics | Traces | |
|---|---|---|---|
| What it is | Timestamped record of a discrete event | A number sampled over time | One request’s journey across services, as a tree of timed spans |
| Looks like | {"ts":"…","level":"error","msg":"pool exhausted","trace_id":"4bf9…"} |
orders_failed_total{region="in"} 14 @ 19:43 |
Waterfall: frontend 40ms → orders 25ms → payment 4,900ms |
| Answers | Why did this specific thing happen? | What / how much / how often; trends, alerting | Where did latency or the error occur? |
| Blind spot | Aggregates and trends (costly to compute) | Individual events — detail averaged away | Not exhaustive (sampled); needs instrumentation |
| Cost driver | GB ingested + retention days | Unique time series (cardinality) | Spans ingested × sampling rate |
| Hospital analogy | Doctor’s notes | Vital-signs monitor | Patient journey timeline |
Logs: the diary of your system
A log is an append-only record of events — one time-stamped entry per thing that happened. Your web server writes a line per request; your app writes one when it starts, when the database is unreachable, when a payment declines. It’s the oldest pillar, as old as /var/log.
Events vs logs
An event is the thing that happened: “order 8812 failed payment at 19:43:07.” A log line is one written record of it. The same event can be recorded three ways: as a log line (full detail), as a metric increment (orders_failed_total ticks 13→14 — detail discarded, count kept), or as an annotation on a trace span. Logs, metrics, and traces are not three data sources — they are three recordings of the same events at different fidelity. Once that clicks, the pillars stop feeling arbitrary.
Unstructured vs structured logging
Most systems emit free text by default:
ERROR 2026-06-09 19:43:07 payment failed for order 8812 (pool exhausted, max 20)
A human can read it; a machine mostly can’t — finding “all pool-exhaustion errors above ₹2,000” means fragile regexes at 2 a.m. Structured logging emits each event as key-value data, usually JSON:
{
  "timestamp": "2026-06-09T19:43:07.412Z",
  "level": "error",
  "service": "payment",
  "message": "connection pool exhausted",
  "order_id": 8812,
  "order_value_inr": 3450,
  "pool_max": 20,
  "trace_id": "4bf92f3577b34da6a3ce929d0e0e4736"
}
Same event, but every field is queryable: filter by service, aggregate by level, join to a trace via trace_id. That last field is the highest-leverage habit in this article — stamp the trace ID on every log line — the thread that turns “this request was slow” (trace) into “here’s exactly why” (log) in one click.
| Unstructured (free text) | Structured (JSON) | |
|---|---|---|
| Written for | Humans reading a file | Machines querying a store |
| “All errors for service=payment” | Regex and hope | One filter expression |
| Adding a field | Breaks existing regexes | Add a key |
| Storage size | Smaller per line | ~2–3× larger; compression recovers most |
| Correlation with traces | Manual | trace_id field → one-click pivot |
| Verdict | Hobby scripts | The production default |
Log levels: the volume knob
Every logging library supports levels — severity tags that double as a volume control: set the threshold to info in production and debug chatter is never written.
| Level | Meaning | Example | In production? |
|---|---|---|---|
TRACE |
Extremely fine-grained flow | “entering validate_cart” |
No — dev only |
DEBUG |
Diagnostic detail | “cart contents: […]” | Off by default; enable during investigations |
INFO |
Normal noteworthy operations | “order 8812 placed” | Yes — the backbone |
WARN |
Odd but self-recovered | “retrying fraud-API call (2/3)” | Yes |
ERROR |
An operation failed | “payment failed: pool exhausted” | Yes — always |
FATAL |
Process cannot continue | “cannot bind port 8080, exiting” | Yes |
Two rules: never default to debug in production (it can 10× the bill and drown the signal), and never log secrets or card numbers at any level. You pay for ingestion (per GB) and retention (per GB-month); logs are the bulkiest pillar, so serious pipelines filter before storing. Each store has a query language: LogQL (Loki), KQL (Azure Monitor), Logs Insights (CloudWatch).
Metrics: the vital signs
A metric is a numeric measurement with a name, a timestamp, and usually labels (dimensions/tags), recorded repeatedly to form a time series. Where a log keeps full detail of one event, a metric deliberately throws detail away and keeps a number — which is why metrics are nearly free to store for years, instant to graph, and the pillar dashboards and alerts are built on.
Here’s a metric at the source — the Prometheus exposition format, served by an instrumented app at /metrics for a collector to scrape:
# TYPE orders_total counter
orders_total{status="success",region="south"} 18234
orders_total{status="failed",region="south"} 41
# TYPE order_latency_seconds histogram
order_latency_seconds_bucket{le="0.5"} 15980
order_latency_seconds_bucket{le="3.0"} 18201
order_latency_seconds_bucket{le="+Inf"} 18275
Each unique name + label combination is one time series (status="failed" is a different series from status="success"). A scraper — Prometheus, CloudWatch agent, Azure Monitor agent — collects values every 15–60 seconds and stores the history.
The three metric types
| Type | What it does | Example | Feeds the question | Classic mistake |
|---|---|---|---|---|
| Counter | Counts occurrences; only climbs (resets on restart) | orders_total, http_requests_total |
“How many per second?” — query as a rate | Graphing the raw climbing line instead of rate() |
| Gauge | A snapshot that goes up and down | memory_bytes_in_use, queue_depth |
“What is it right now? Saturating?” | Using a counter where you needed current state |
| Histogram | Buckets observations to capture the distribution | order_latency_seconds |
“What’s the p95/p99?” | Reporting only the average |
(A fourth type, summary, pre-computes quantiles in-app; histograms are the modern default.)
The histogram row hides the most important lesson in metrics: averages lie. If 19 checkouts take 200 ms and one takes 20 s, the average is ~1.2 s — “fine” — while one customer in twenty had an awful experience. Percentiles fix this: p95 is the value 95% of requests are faster than; your slowest 5% wait longer. Dashboards and SLOs use p95/p99, never means, because pain lives in the tail.
Cardinality: the one way metrics get expensive
Metrics cost scales with the number of unique time series — cardinality — not traffic volume. Every distinct label combination is a stored, indexed series; an unbounded label detonates the bill:
| Label | Distinct values | Series created | Verdict |
|---|---|---|---|
region |
~5 | ×5 | Fine — bounded, useful |
status |
2 | ×2 | Fine |
http_status_code |
~20 | ×20 | Fine |
customer_id |
2,000,000 | ×2,000,000 | Catastrophic — belongs in logs/traces |
request_url (IDs embedded) |
Unbounded | Unbounded | Catastrophic — normalize to route templates |
Rule of thumb: labels answer “which group?” (region, service, status class), never “which one?” (user, order, session) — “which one” belongs in logs and traces. Outgrowing the rule? See Taming Metric Cardinality in Prometheus.
A taste of PromQL, Prometheus’s query language:
# Checkout failures per second, averaged over 5 minutes
rate(orders_total{status="failed"}[5m])

# Success ratio (an SLI!)
sum(rate(orders_total{status="success"}[5m])) / sum(rate(orders_total[5m]))

# p95 checkout latency from the histogram
histogram_quantile(0.95, sum(rate(order_latency_seconds_bucket[5m])) by (le))
Traces: the journey of one request
A distributed trace follows a single request end-to-end across services and records how long each hop took. It becomes essential the moment you have more than one service — which, in the cloud, is every system.
The unit is the span: one timed operation (“POST /checkout in the frontend,” “SQL INSERT in orders”). Spans record their parent, so a trace is a tree of spans sharing one trace ID, drawn as a waterfall:
TRACE 4bf92f3577b34da6a3ce929d0e0e4736  (total: 5,090 ms)   status
├── frontend: POST /checkout                 [   40 ms]      OK
│   └── orders-svc: create_order             [   25 ms]      OK
│       ├── postgres: INSERT orders          [    8 ms]      OK
│       └── payment-svc: authorize           [4,990 ms]      ERROR
│           └── fraud-api (external): score  [4,910 ms]      TIMEOUT
└── frontend: render confirmation            [  never ran ]
Three seconds of reading tells you what no log file or CPU graph could: frontend and orders are innocent; virtually all five seconds sit in payment’s call to the external fraud API, which timed out. That’s the “now I get it” power of traces — latency and errors become geographically obvious.
| Span field | Holds | Example |
|---|---|---|
trace_id |
ID shared by every span in one request | 4bf92f3577b34da6a3ce929d0e0e4736 |
span_id / parent_span_id |
This hop / who called it | 00f067aa0ba902b7 / a3ce…4736 |
| Name | The operation | payment-svc: authorize |
| Start + duration | When, how long | 19:43:02.310, 4,990 ms |
| Status | OK or error | ERROR |
| Attributes | Key-value context | http.status_code=504, order_id=8812 |
| Events | Timestamped notes inside the span | retry attempt 2 @ +2,400ms |
How do services know they belong to the same trace? Context propagation: the caller injects the trace ID into an HTTP header — the W3C traceparent standard, e.g. traceparent: 00-4bf92f3577b34da6a3ce929d0e0e4736-00f067aa0ba902b7-01 — and every hop passes it along. OpenTelemetry handles this automatically in most frameworks, and it’s where the trace_id in your structured logs comes from: same ID on both signals, one-click trace→log pivot.
Two realities: traces require instrumentation — an agent or SDK in each service; auto-instrumentation (no code changes) is the sane start. And traces are usually sampled: head sampling decides at request start (keep 1-in-10; cheap, may drop interesting ones), tail sampling decides after completion (keep all errors and slow requests plus a sliver of the boring; smarter, needs a buffering collector). Start head-sampled generously; move to tail sampling when volume forces you.
Dashboards, alerts, SLIs and SLOs — in plain words
Collecting pillars is half the job; using them is the other half, and beginners routinely confuse the two instruments.
| Dashboard | Alert | |
|---|---|---|
| What it is | A screen of graphs humans look at | A rule that interrupts a human when a condition holds |
| Mode | Pull — you go look | Push — it finds you (page, SMS, ticket) |
| Good for | Trends, investigation, post-deploy checks | “A customer-visible thing is breaking now” |
| Bad when | The only line of defense | Fired for things needing no action |
| Golden rule | Answers a question, doesn’t decorate a wall | Must be actionable — else it’s a dashboard panel |
| Tools | Grafana, CloudWatch dashboards, Azure workbooks | Alertmanager, CloudWatch alarms, Azure Monitor alerts, PagerDuty |
The failure mode to fear is alert fatigue: page on CPU blips, and within months the team ignores all pages — including the real one. The antidote comes from Google’s SRE practice:
- An SLI (Service Level Indicator) is the thing you measure — something a customer feels: “the percentage of checkout requests that succeed in under 3 seconds.”
- An SLO (Service Level Objective) is the target: “99.5% of checkouts succeed in under 3 seconds, over 28 days.”
- The error budget is the leftover: 100% − 99.5% = 0.5% of checkouts are allowed to fail. A decision tool — budget healthy? Ship boldly. Budget burning? Freeze risky deploys and fix reliability.
Instead of “page on any error” (too noisy) or “page if CPU > 80%” (silent while checkout burns), you page when the error budget is burning fast enough to miss the objective. Customer pain at a rate that matters is the only thing worth a 2 a.m. wake-up; everything else is a ticket or a morning dashboard.
To calibrate targets — each extra “nine” is roughly 10× harder:
| SLO target | Allowed downtime per 30-day month | Realistic for |
|---|---|---|
| 99% (“two nines”) | 7 h 12 m | Internal tools, batch jobs |
| 99.5% | 3 h 36 m | Typical small-business web app |
| 99.9% (“three nines”) | 43 m 12 s | Serious production SaaS |
| 99.95% | 21 m 36 s | Product with real on-call |
| 99.99% (“four nines”) | 4 m 19 s | Multi-zone, mature org |
A first alert, in both dialects. Prometheus:
groups:
  - name: checkout-slo
    rules:
      - alert: CheckoutSuccessBelowSLO
        expr: |
          sum(rate(orders_total{status="success"}[5m]))
            / sum(rate(orders_total[5m])) < 0.995
        for: 5m                      # sustained, not a blip
        labels:
          severity: page
        annotations:
          summary: "Checkout success below 99.5% SLO for 5m"
The same idea as a CloudWatch alarm:
aws cloudwatch put-metric-alarm \
  --alarm-name checkout-success-below-slo \
  --namespace "Shop/Checkout" --metric-name CheckoutSuccessRatePct \
  --statistic Average --period 60 --evaluation-periods 5 \
  --threshold 99.5 --comparison-operator LessThanThreshold \
  --alarm-actions arn:aws:sns:ap-south-1:123456789012:oncall-page
Both encode three decisions: measure a customer symptom, require it sustained, route it to a human who can act. SLOs and Error Budgets in Practice continues with burn-rate alerting; Building an On-Call Practice covers life after the page.
The tool landscape, pillar by pillar
Tool names are the most intimidating part of the field; here’s the decoder ring. Learn one name first: OpenTelemetry (OTel) — the CNCF-standard, vendor-neutral way to emit all three signals. Instrument once against the OTel API; choose where data goes by configuration. It keeps you from being locked to any vendor below.
| Pillar | Open-source standard | AWS native | Azure native | GCP native | SaaS platforms |
|---|---|---|---|---|---|
| Metrics | Prometheus (+ Thanos/Mimir at scale) | CloudWatch Metrics | Azure Monitor Metrics | Cloud Monitoring | Datadog, Dynatrace, New Relic, Grafana Cloud |
| Logs | Loki (label-based, cheap) or ELK/OpenSearch (full-text, heavier) | CloudWatch Logs (+ Logs Insights) | Log Analytics (KQL) | Cloud Logging | same platforms |
| Traces | Jaeger, Grafana Tempo, Zipkin | AWS X-Ray | Application Insights | Cloud Trace | same platforms |
| Dashboards | Grafana (queries all of the above) | CloudWatch dashboards | Workbooks | Cloud Monitoring dashboards | built-in |
| Alert routing | Prometheus Alertmanager | Alarms + SNS | Alert rules + action groups | Alerting policies | built-in + PagerDuty/Opsgenie |
| Emit/collect | OTel SDK + Collector | ADOT, CloudWatch agent | Azure Monitor agent, OTel | Ops Agent, OTel | Datadog Agent, Dynatrace OneAgent |
How to choose. Cloud-native tools are already there, integrated, cheap to start — the right default for a single-cloud team, at the price of per-cloud silos and weaker cross-signal correlation. The open-source stack — Prometheus + Grafana + Loki + Tempo — is free in licence cost and employable knowledge, but yours to run. SaaS platforms put every environment in one correlated pane — strongest for multi-cloud (see Datadog as the Single Pane of Glass for Multi-Cloud Operations) — and you pay accordingly at scale. The pragmatic path: OTel from day one, start on whatever you have, and let real pain justify a platform later — the migration is then configuration, not a rewrite. The plumbing is the OpenTelemetry Collector pipeline.
Architecture at a glance
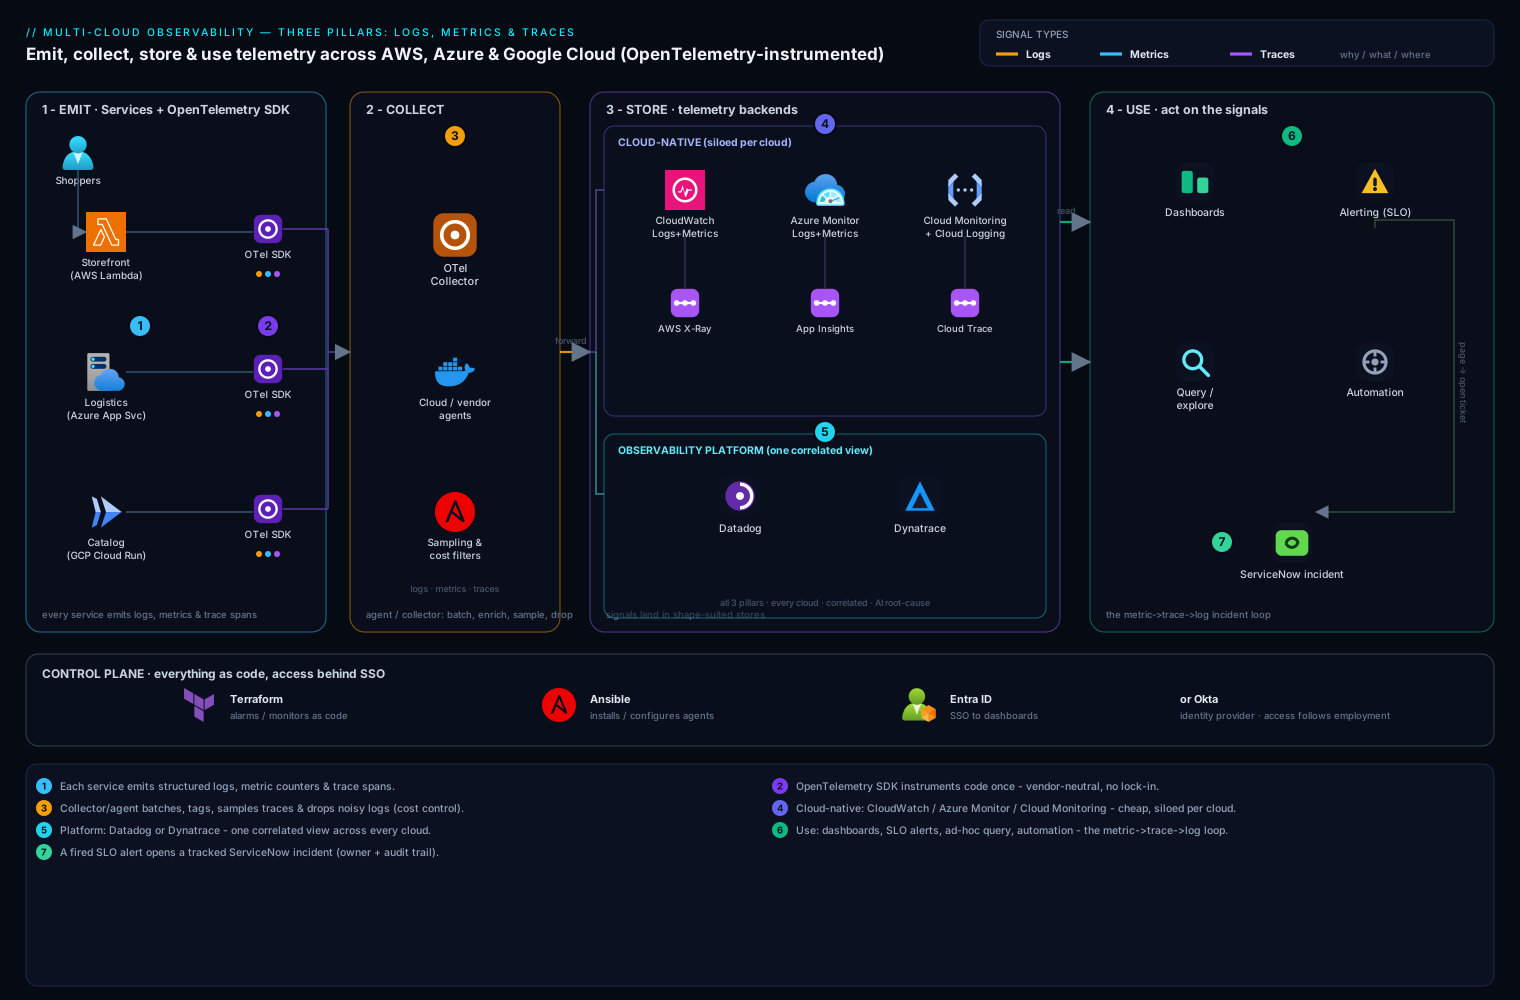
Every observability stack — laptop project or multi-cloud enterprise — is the same four-stage pipeline. Emit: apps produce the three signals (structured logs to stdout, metrics on /metrics, spans via the OTel SDK). Collect: an agent or OTel Collector gathers all three, enriches them with metadata (host, container, pod), filters noise, samples traces, and forwards — the hop where cost is controlled. Store: each signal lands in a backend shaped for it — time-series database, log store, trace store (or one platform holding all three). Use: dashboards, alerts that page on SLO burn, ad-hoc query/exploration (the “ask a new question” layer that is observability), and automation like auto-opening a ticket.
Trace the diagram left to right — emitting services, collection layer, per-pillar stores, dashboard/alert/query surfaces — with the trace-ID thread stitching the signals so an engineer can pivot between them mid-incident.
Real-world scenario
Back to the grocery retailer — the same Tuesday, replayed twice. The company: ~40 engineers, storefront on AWS (ALB → frontend → orders → payment on ECS), ~18,000 peak-evening checkouts averaging ₹1,900 per basket. At 19:31, the third-party fraud-scoring API that payment calls starts responding in 25–30 s instead of 300 ms. Payment’s connection pool (max 20, no timeout) fills with stuck calls; about 1 in 20 checkouts hangs until the shopper gives up.
Without observability (what happened): 19:31 problem begins. 19:52 support notices “stuck at payment” complaints. 20:05 on-call confirms CPU/memory dashboards green, starts SSH-and-grep. 20:48 an engineer who once integrated the fraud API guesses right; a restart plus a pool bump mitigates. 77 minutes, ~1,150 abandoned checkouts ≈ ₹21.8 lakh at-risk baskets, root cause unconfirmed.
With the three pillars (the replay): 19:34 the SLO alert fires — checkout success 94.6% vs 99.5% for 3 consecutive minutes — paging on-call and auto-opening a ticket. 19:36 the dashboard shows failures concentrated in payment-svc, p95 pinned at the 30 s timeout. 19:38 traces filtered to failed checkouts all show 4,900+ ms in payment-svc → fraud-api — the waterfall from earlier. 19:39 one click from the slow span to logs sharing its trace_id: {"level":"error","msg":"connection pool exhausted","pool_max":20}. 19:43 mitigation ships — a 2 s timeout plus fail-open for low-risk orders (the circuit-breaker pattern). 19:46 back above SLO. 15 minutes, ~₹4.1 lakh at risk — an ~81% reduction — root cause proven, not guessed.
| Time | Signal | What it told them | Pillar |
|---|---|---|---|
| 19:34 | SLO alert: success 94.6% < 99.5% | Something customer-facing is wrong | Metrics |
| 19:36 | Dashboard: failures in payment-svc, p95 = 30 s | Which service, timeout-shaped | Metrics |
| 19:38 | Trace: 4.9 s in payment → fraud-api span | Which hop — external dependency | Traces |
| 19:39 | Log via trace_id: pool exhausted, max 20 |
Exact mechanism → obvious fix | Logs |
| 19:43 | Timeout + fail-open deployed; alert resolves 19:46 | Recovery verified on the same SLI | Metrics |
The rhythm — metric to notice, trace to localize, log to explain, metric to verify — and no single pillar could do it alone: the metric never knew about the fraud API, the trace didn’t know the pool size, and the log would never have been found among millions of lines without the trace ID.
Advantages and disadvantages
| Advantages of investing in the pillars | Disadvantages / costs to respect |
|---|---|
| Incidents shrink from hours of guessing to minutes of reading (77 → 15 min above) | Telemetry bills grow silently — ungoverned logs and cardinality can hit 5–10% of the cloud bill |
| Unknown-unknowns become answerable without new code | Instrumentation is real work (auto-instrumentation reduces, not erases it) |
| SLOs turn reliability arguments into arithmetic | Badly tuned alerting breeds fatigue worse than silence |
| Dashboards give the team shared, objective reality | Tool sprawl: three pillars × per-cloud tools = many consoles |
| Trace-ID correlation makes cross-service debugging a pivot, not an expedition | Sampling means traces are evidence, not a complete ledger |
| OTel makes vendor choice reversible | Telemetry leaks PII/secrets if unscrubbed |
The pillars pay for themselves the first bad Tuesday — but budget for the data bill, instrumentation time, and alert tuning. Ongoing engineering, not a one-time install.
Hands-on lab
Run the classic open-source metrics stack — an instrumented app + Prometheus + Grafana — with Docker, cause an incident, and watch it surface. Free, offline, ~20 minutes.
1. Create the project — three files in an empty directory (mkdir obs-lab && cd obs-lab). First app.py, a tiny shop API with a counter and a histogram:
import random, time
from flask import Flask, Response
from prometheus_client import Counter, Histogram, generate_latest

app = Flask(__name__)
ORDERS = Counter("orders_total", "Orders processed", ["status"])
LATENCY = Histogram("order_latency_seconds", "Checkout latency")

@app.route("/order")
def order():
    with LATENCY.time():
        time.sleep(random.uniform(0.05, 0.4))       # normal work
        if random.random() < 0.10:                   # ~10% failures
            ORDERS.labels(status="failed").inc()
            return {"status": "failed"}, 500
        ORDERS.labels(status="success").inc()
        return {"status": "success"}

@app.route("/metrics")
def metrics():
    return Response(generate_latest(), mimetype="text/plain")

app.run(host="0.0.0.0", port=8000)
prometheus.yml — scrape the app every 5 s:
global:
  scrape_interval: 5s
scrape_configs:
  - job_name: "orders-app"
    static_configs:
      - targets: ["app:8000"]
docker-compose.yml — the three containers:
services:
  app:
    image: python:3.12-slim
    volumes: [".:/lab"]
    command: sh -c "pip install -q flask prometheus-client && python /lab/app.py"
    ports: ["8000:8000"]
  prometheus:
    image: prom/prometheus:latest
    volumes: ["./prometheus.yml:/etc/prometheus/prometheus.yml"]
    ports: ["9090:9090"]
  grafana:
    image: grafana/grafana:latest
    ports: ["3000:3000"]
2. Start and generate traffic:
docker compose up -d
# wait ~30s for pip install, then:
curl -s localhost:8000/order
# {"status":"success"}
# steady traffic in a second terminal:
while true; do curl -s localhost:8000/order > /dev/null; sleep 0.2; done
3. See the raw pillar. Open http://localhost:8000/metrics — the exposition format from earlier. Refresh: orders_total{status="failed"} only climbs.
4. Query it. Open http://localhost:9090, confirm Status → Targets shows orders-app UP, then run:
rate(orders_total{status="failed"}[1m])
Expected: ~0.4–0.6 (≈5 req/s, ~10% failing). Switch to Graph and watch the line. The success-ratio SLI from earlier should hover near 0.90.
5. Visualize. Open http://localhost:3000 (login admin/admin). Connections → Data sources → Add → Prometheus, URL http://prometheus:9090, Save & test. Add a dashboard panel with the p95 query:
histogram_quantile(0.95, sum(rate(order_latency_seconds_bucket[5m])) by (le))
Expected: a line around 0.35–0.40 seconds.
6. Cause an incident. In app.py, change the failure rate 0.10 to 0.5 and the sleep ceiling 0.4 to 2.0, then docker compose restart app. Within a minute the p95 line climbs toward ~1.9 s and the failure rate quintuples — a bad deploy breaking checkout on a graph instead of in a support inbox. This is exactly the signal the SLO alert rule earlier would page on.
7. Validate: target UP; orders_total visible at /metrics; both queries returning data; the panel moving when the app changes. You’ve run the pipeline: emit → collect → store → use.
8. Teardown:
docker compose down -v && cd .. && rm -rf obs-lab
Common mistakes & troubleshooting
The beginner playbook:
| # | Symptom | Root cause | Confirm | Fix |
|---|---|---|---|---|
| 1 | “Dashboards green, users screaming” | Monitoring machine internals, not customer symptoms | No panel shows success rate/latency of a user action | Define one SLI per user journey; dashboard + alert on it |
| 2 | Team ignores pages | Alert fatigue from non-actionable alerts | Count last month’s no-action pages (>30% = fatigue) | Demote to ticket anything without a required action; page only on SLO burn |
| 3 | Metrics bill exploded overnight | Cardinality bomb — unbounded label | Series count per metric (Prometheus /tsdb-status top-10) |
Drop/normalize the label; move “which one” detail to logs/traces |
| 4 | Can’t find the log for a failing request | No correlation ID | Log lines lack trace_id |
Stamp trace_id/span_id on every line (OTel does this) |
| 5 | Log search is regex archaeology | Unstructured free-text logging | Lines are prose, not key-value | Switch the logger to JSON; add fields, not sentences |
| 6 | Log bill dwarfs everything | DEBUG in prod, or logging payloads |
Volume by level/service in the log platform | INFO threshold; drop noisy sources at the collector; shorten retention |
| 7 | Traces have gaps / vanish mid-flow | A service isn’t propagating context | Waterfalls truncate at the same hop | Add OTel auto-instrumentation there; pass headers through proxies |
| 8 | “We trace everything” → huge bill | 100% sampling at production volume | Span count ≈ request count | Head-sample 1–10%; tail-sample to keep errors + slow |
| 9 | Average latency fine, users complain | Averages hide the tail | Big gap between avg and p95/p99 | Graph/alert on p95/p99 from histograms |
| 10 | Prometheus target DOWN | Wrong port/path, app bound to localhost | Status → Targets error; curl http://<host>:<port>/metrics |
Expose /metrics on 0.0.0.0; fix the scrape target |
| 11 | Nobody knows if the SLO is met | SLI never actually defined | Ask “what % of checkouts succeeded this month?” — silence | Write one SLI as a ratio query; review monthly |
Best practices
- Alert on symptoms, not causes. Page on “checkout success below SLO”; ticket on “CPU high.”
- Structured logs from day one — JSON with
service,level,timestamp, and alwaystrace_id. - Instrument with OpenTelemetry, not vendor SDKs. Telemetry should outlive tool choices.
- Labels answer “which group,” never “which one.” Identifiers go in logs and span attributes.
- Histograms and percentiles for anything latency-shaped. Averages are marketing; p95/p99 are engineering.
- Every alert needs an owner and an action — if the response is “acknowledge and sleep,” delete it; pages arrive with a dashboard link and runbook.
- Sample traces deliberately — keep all errors and slow requests once volume matters.
- Control cost at the collector, not after storage: drop debug noise, cap cardinality. Ingested GB is the bill.
- Dashboards follow a method — RED for services (Rate, Errors, Duration), USE for resources (Utilization, Saturation, Errors) — see Engineering Grafana Dashboards That Get Used.
- Watch the watchers — alert if telemetry stops flowing; a dead agent looks exactly like a healthy system.
- After every incident ask “what signal would have caught this sooner?” — that’s how observability improves.
Security notes
Telemetry is a shadow copy of your system’s activity, and it leaks like one if untreated:
- Never log secrets or raw PII. Passwords, tokens, card numbers, cookies — scrub in the logging layer or collector before storage; once indexed they’re searchable for the whole retention window. (If credentials leak, rotation — not deletion — is the fix; see Secrets Management Basics.)
- Access-control the telemetry itself. Logs and traces reveal internal architecture, IPs, query shapes — attacker gold. Put Grafana/Kibana/cloud consoles behind SSO (Entra ID, Okta); scope who can query production logs.
- Separate operational logs from audit logs. Compliance trails need tamper-evident, long-retention, tightly-scoped storage — a different pipeline from debug telemetry.
- Mind data residency. SaaS platforms move customer-adjacent data across borders; check region pinning first.
Cost & sizing
Per pillar, with rough pay-as-you-go list anchors (verify current pricing; ₹ at ~₹90/USD):
| Pillar | You pay for | Rough anchors | The trap that 10×es it |
|---|---|---|---|
| Logs | GB ingested + GB-month retained | CloudWatch Logs ~$0.50/GB ingest; Azure Log Analytics ~$2–3/GB; Datadog ~$0.10/GB ingest + ~$1.7–2.5/M indexed events | DEBUG in prod; logging payloads; unlimited retention |
| Metrics | Time series / custom metrics | CloudWatch ~$0.30 per custom metric/month (tiered); managed Prometheus billed per samples/series | Cardinality bombs (ID labels) |
| Traces | Spans/traces ingested | AWS X-Ray ~$5 per million traces recorded; platform APM often per-host (Datadog APM from ~$31/host/mo) + span volume | 100% sampling at scale |
| Free tiers | Learning + tiny prod | CloudWatch: 5 GB logs + 10 custom metrics; X-Ray: 100k traces/mo; Azure: 5 GB/workspace/mo of logs; Grafana Cloud: ~10k series, 50 GB logs, 50 GB traces | Assuming free tier scales |
Three sizing intuitions. Logs dominate most bills: 20 GB/day into Azure Log Analytics at ~$2.30/GB is ~$1,380/month (≈ ₹1.24 lakh) before retention; the same telemetry as metrics costs a rounding error — that asymmetry is why the pillars exist. Retention is a dial: 7–14 days hot for debug logs, 30–90 for security-relevant ones, archive tiers (~$0.02/GB-month) beyond. And a small startup on free tiers plus one small VM of Prometheus/Grafana/Loki fits in ₹5,000–20,000/month — if levels, sampling, and cardinality are governed from day one.
Interview & exam questions
Standard junior cloud/SRE/DevOps questions (relevant to AWS SAA/SysOps, Azure AZ-104/AZ-400, GCP ACE):
- “Monitoring vs observability?” Monitoring answers pre-decided questions (known-unknowns) via dashboards and alerts. Observability is a system property: telemetry rich enough to answer unanticipated questions (unknown-unknowns) without new code.
- “The three pillars, one line each?” Logs: timestamped event records — the why. Metrics: numbers over time — the what/how much, cheap enough to alert on. Traces: one request’s timed journey across services — the where.
- “Counter vs gauge vs histogram?” Counter only climbs — query as a rate. Gauge goes both ways — read directly. Histogram buckets observations — enables percentiles like p95.
- “Why alert on p99 rather than average?” Averages hide tail pain: 1% of requests taking 20 s barely moves a mean but is a terrible experience at volume.
- “What is a span?” One timed, named operation within a trace, carrying trace ID, span ID, parent span ID, duration, status, attributes. A trace is the tree of spans sharing one trace ID.
- “How do services share a trace ID?” Context propagation — headers (W3C
traceparent) injected by the caller and re-injected at each hop. - “SLI vs SLO vs error budget?” SLI: the measured indicator (% of checkouts succeeding < 3 s). SLO: its target (99.5% over 28 days). Error budget: the allowed shortfall (0.5%) — spend it shipping fast, freeze when it’s gone.
- “What is cardinality and why care?” The number of unique label combinations on a metric — each a stored time series. Unbounded labels (user IDs) explode cost; keep labels bounded, put detail in logs/traces.
- “Why sample traces — head vs tail?” Full tracing at scale is costly and redundant. Head sampling decides at request start (simple, may drop interesting traces); tail sampling decides after completion, keeping errors and slow requests.
- “Where does OpenTelemetry fit vs Prometheus or Datadog?” OTel standardizes emitting telemetry (SDKs, collector, protocol); Prometheus/Datadog store and analyze it. Instrument once; swap backends by configuration.
Quick check
- Your dashboard shows average checkout latency of 400 ms, but some users wait 10+ seconds. What explains the mismatch, and what should you graph instead?
- Which pillar answers “which hop in our six-service chain added the 4 seconds?” — and what unit is it made of?
- A teammate adds a
customer_idlabel tohttp_requests_total“for debugging.” What happens, and where should that detail live? - Turn “checkout should basically always work, quickly” into an SLI and an SLO.
- In the hospital analogy, which pillar is the doctor’s notes, and what question is it best at?
Answers
- Averages hide the tail — the slow few barely move the mean. Graph percentiles (p95/p99) from a latency histogram.
- Traces — made of spans: timed, named operations linked by a shared trace ID into a tree.
- Cardinality explodes: one time series per customer (potentially millions), ballooning storage, cost, and query time. Per-customer detail belongs in structured logs or span attributes.
- SLI: the percentage of checkout requests succeeding in under 3 seconds. SLO: 99.5% of them over 28 days (leaving a 0.5% error budget).
- Logs — best at “why did this specific thing happen,” with full per-event detail.
Glossary
- Observability: the property of a system that lets you answer new, unanticipated questions from telemetry it already emits.
- Monitoring: watching predefined indicators against predefined conditions — dashboards and alerts for known-unknowns.
- Log / structured logging: a timestamped record of a discrete event / emitting it as key-value data (JSON).
- Metric / time series: a numeric measurement over time / one metric name + one unique label set.
- Counter / gauge / histogram: ever-increasing count / up-and-down snapshot / bucketed distribution enabling percentiles.
- Cardinality: the number of unique label combinations a metric produces; the main driver of metrics cost.
- Percentile (p95/p99): the value below which 95%/99% of observations fall; how tail latency is expressed.
- Trace / span: one request’s cross-service journey / one timed operation within it, linked by a shared trace ID via context propagation (W3C
traceparent). - Sampling (head/tail): keeping a subset of traces — decided at request start, or after completion preferring errors and slow requests.
- SLI / SLO / error budget: what you measure / the target you commit to / the allowed shortfall you can spend on risk.
- OpenTelemetry (OTel): the CNCF vendor-neutral standard for emitting all three signals.
Next steps
- Formalize your first reliability target with SLOs and Error Budgets in Practice.
- Get fluent in the metrics query language with PromQL in Anger — the lab above is your playground.
- Extend the pipeline you built with Building Production OpenTelemetry Collector Pipelines.
- Go deep on the third pillar with Distributed Tracing End-to-End.
- See what happens after the page fires in Building an On-Call Practice.