In a nutshell
Picture a supermarket at checkout time. When the queue of shoppers grows, you have three completely different ways to cope, and a well-run store uses all three. You can open more tills — put more cashiers on, so more people are served at once. You can give each cashier a bigger desk — more belt space, a faster scanner — so each one handles their own line better. Or, when the shop is jammed wall to wall and there is nowhere to put another till, you can rent more floor space. Kubernetes has exactly these three levers, and they map one-to-one:
- HPA — hire more cashiers. The Horizontal Pod Autoscaler watches how busy each pod is and adds or removes replicas to hold a target load. More traffic → more pods.
- VPA — give each cashier a bigger desk. The Vertical Pod Autoscaler watches what a pod actually used over time and right-sizes its CPU/memory requests, so you stop guessing those numbers. Same pod count, better-fitted pods.
- Cluster Autoscaler / Karpenter — rent more floor space. When the extra pods have nowhere to run, the node autoscaler notices the unschedulable pods and buys more nodes for them to land on.
The part beginners miss: none of it works without a meter. Before you can decide to open another till, someone has to be counting the queue — and in Kubernetes that meter is Metrics Server, a small component that publishes live CPU and memory numbers. EKS does not install it for you. Skip it and your HPA sits at <unknown> forever and never scales a thing, which is why it is step one of this lesson rather than a footnote.
The second thing to hold onto: these three controllers do not talk to each other. They compose through side effects. The HPA adds pods; the scheduler discovers there is no room; the pods go Pending; that is the signal a node autoscaler reacts to. Nobody calls anybody. Understanding that chain is what turns “autoscaling is flaky” into “I know exactly which loop is late.”
Everything here gets built in Terraform, and that is a deliberate choice rather than a Terraform-course reflex. Scaling policy — the HPA’s floor and ceiling, how fast it grows, how reluctantly it shrinks, what the VPA is allowed to recommend — is exactly the kind of setting that gets “fixed” live during an incident and never written down. In HCL it is reviewed in a pull request, pinned to a version, and identical in dev and prod.
Prerequisites: a running EKS cluster with the kubernetes and helm providers already authenticated to it (see Kubernetes & Helm providers on EKS), comfort with Deployments and resources.requests/limits, and — only if you later scale on an AWS signal — the OIDC & IRSA lesson.
After this you can: install Metrics Server correctly on EKS (including the --kubelet-insecure-tls gotcha that blocks almost everyone once); attach an autoscaling/v2 HPA with deliberate, asymmetric behavior policies instead of inherited defaults; run a VPA in Off mode and apply its recommendations without disruption; explain mechanically why HPA and VPA must not share a metric; and compose pod scaling with node scaling so spend tracks demand instead of peak.
Level: Advanced · Time: ~94 min
Your EKS cluster survives the quiet hours fine on two replicas. Then marketing sends the email, a product goes viral, or the 9 a.m. batch fires — and the same two pods pin CPU at 100%, p99 latency triples, and the pods that should have absorbed the surge never appeared because nothing was watching. Adding nodes doesn’t help: Karpenter and the Cluster Autoscaler only add nodes when there are unschedulable pods, and nothing is creating pods. The missing piece is the workload scaling layer — the controllers that watch each Deployment’s live resource use and change how many pods run (and how big each one is), which in turn creates the scheduling pressure that makes node autoscaling do its job.
This lesson builds that layer, end to end, in Terraform. Three controllers, three axes. Metrics Server publishes the resource-metrics API (metrics.k8s.io) that both kubectl top and every CPU/memory HPA depend on — install it and nothing scales, so it comes first. The Horizontal Pod Autoscaler (HPA, autoscaling/v2) changes the number of pods to hold a target utilisation, with behavior policies that decide how fast to add and how slowly to remove them. The Vertical Pod Autoscaler (VPA) changes the size of each pod — its CPU/memory requests — so you stop guessing at resources.requests. You will meet the two traps that sink most teams: resource requests are mandatory for a CPU-percent HPA (skip them and the HPA target reads <unknown> forever), and HPA and VPA fighting over the same metric oscillates a workload into the ground.
Everything is real HCL and YAML you can paste. We install Metrics Server and the VPA controller with helm_release, define a Deployment with proper requests, attach a native kubernetes_horizontal_pod_autoscaler_v2 with a full behavior block, and apply a recommend-only VPA — deliberately using kubectl_manifest for the VPA custom resource so you feel the plan-time CRD problem that breaks kubernetes_manifest. Then we drive a load generator and watch kubectl get hpa climb, new pods schedule, and — because pods go Pending — Karpenter provision a node underneath. That last hop is the whole point: HPA adds pods → the scheduler runs out of room → the node autoscaler adds capacity. For the node half of the story, this lesson pairs directly with the Cluster Autoscaler & Karpenter lesson; for the custom-metric path it builds on the EKS observability lesson; and the provider wiring assumes the Kubernetes/Helm providers lesson.
What you’ll build
The scenario is a single stateless web Deployment that you want to scale on CPU, plus a recommender that tells you whether your requests are right. You already have an EKS cluster (managed node group or Karpenter — this layer sits on top of either). Onto it, Terraform lays down four things: Metrics Server (so a resource-metrics API exists), the workload and its Service, an HPA that holds 50% average CPU by adding pods between 2 and 20, and a VPA in Off mode that watches the same workload and prints right-sized request recommendations without touching anything. You then generate load, watch the horizontal scale-out, and — if the cluster runs out of allocatable CPU — watch the node autoscaler react.
Why Terraform rather than kubectl apply or a Helm umbrella chart? Because this scaling policy is infrastructure, not a one-off: the HPA bounds, the behavior windows, the VPA guardrails and the Metrics Server version are exactly the sort of thing that drifts between environments and gets “fixed” live at 2 a.m. never to be written down. In Terraform they are reviewed in a pull request, pinned by version, and identical in dev and prod. The one subtlety — and it is the source of half the confusion in this topic — is that the HPA owns the Deployment’s replica count, so Terraform must be told not to manage replicas, or every apply will fight the HPA back down to its baseline. We handle that with lifecycle { ignore_changes }, and it is one of the most important lines in the whole lesson.
Here is the whole build at a glance, and who owns each moving part:
| Component | Terraform resource | What it does | Scales | Owned by |
|---|---|---|---|---|
| Metrics Server | helm_release |
Serves metrics.k8s.io (CPU/mem) from kubelet |
nothing — it feeds scalers | you (Terraform) |
| Deployment + Service | kubernetes_deployment, kubernetes_service |
The workload with resources.requests |
its own pods (via HPA) | you; replicas → HPA |
| HPA | kubernetes_horizontal_pod_autoscaler_v2 |
Adds/removes pods to hold target CPU% | pod count (2→20) | you (Terraform) |
| VPA | helm_release (controller) + kubectl_manifest (the CR) |
Recommends / sets per-pod requests | pod size | you (Terraform) |
| Karpenter / CA | separate lesson | Adds/removes nodes for Pending pods | node count | platform team |
A one-line way to keep the three autoscalers straight: HPA changes how many, VPA changes how big, Karpenter changes how much cluster. Get all three wrong and you over-provision three times over; get them composed and the cluster breathes with load and cost tracks demand.
The two axes of pod autoscaling (and the third, nodes)
Autoscaling in Kubernetes is not one feature; it is three controllers operating on three independent axes, and the single most common design mistake is conflating them. The horizontal axis (HPA) answers “how many replicas?” The vertical axis (VPA) answers “how big should each replica’s requests be?” The cluster/node axis (Cluster Autoscaler or Karpenter) answers “do we have enough nodes to place the pods the other two produced?” They do not replace each other — a mature platform runs all three, each on the signal it is good at.
| Dimension | Horizontal Pod Autoscaler | Vertical Pod Autoscaler | Cluster Autoscaler / Karpenter |
|---|---|---|---|
| Scales | Replica count | Per-pod requests (size) | Node count/shape |
| Object | HorizontalPodAutoscaler |
VerticalPodAutoscaler (CRD) |
Karpenter NodePool / ASG |
| Reacts to | Live CPU/mem util or custom/external metrics | Historical usage percentiles | Unschedulable (Pending) pods |
| Good for | Stateless request/queue workloads | Right-sizing, singletons, batch | Fitting pods onto cheap capacity |
| Disruption | None (adds/removes pods) | Evicts pods to resize (Auto mode) | Adds/drains nodes |
| Needs Metrics Server? | Yes (for CPU/mem HPAs) | Yes (recommender reads usage) | No (reads scheduler, not metrics) |
| Ships with EKS? | Built into k8s (needs Metrics Server) | No — install the VPA controller | No — install Karpenter/CA |
| Terraform surface | Native resource or manifest | helm chart + custom resources | helm/module + IRSA |
The composition is a chain, and the diagram below traces it left to right. Metrics Server publishes usage; the HPA reads it and drives the Deployment’s replica count; if the new pods can’t fit on the current nodes they go Pending; Karpenter (or the Cluster Autoscaler) sees Pending pods and provisions nodes; meanwhile the VPA watches the same workload and reports (or applies) better request sizes. Each hop is a separate controller with its own reconcile loop, and the numbered badges call out the six decisions that most often go wrong.
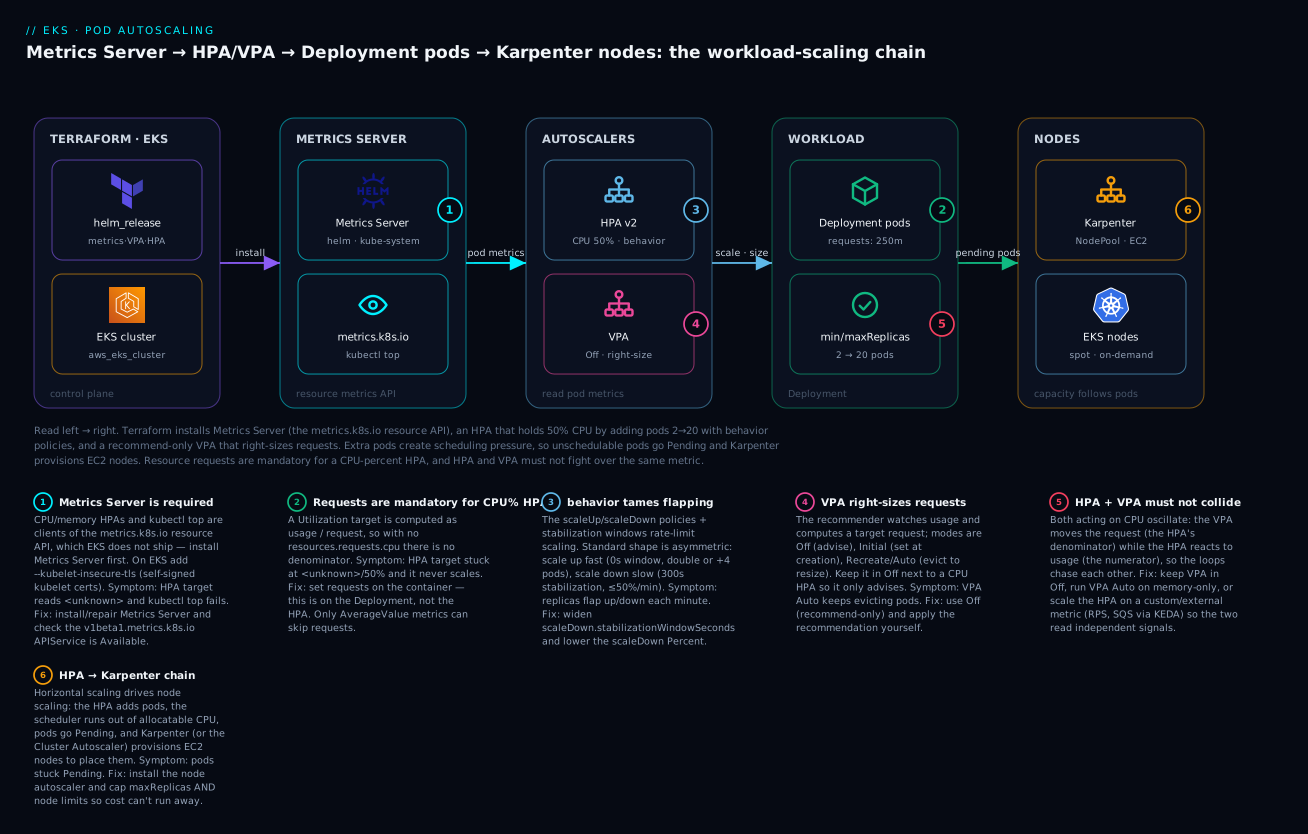
Read it as a pipeline: install → measure → decide → place. The failure modes cluster at the seams — no Metrics Server means the “measure” stage is empty and the HPA reads <unknown>; missing requests means the “decide” stage can’t compute a percentage; and a VPA in Auto mode fighting the HPA turns “decide” into an oscillation. The rest of the lesson is those seams in detail.
Metrics Server: the resource-metrics API everything depends on
Metrics Server is not installed on EKS by default, and without it CPU/memory HPAs and kubectl top simply do not work. It is a cluster-wide component that scrapes the kubelet Summary API on every node (CPU and memory, sampled ~every 15s), keeps only the latest value in memory (it is not a monitoring database — no history, no disk), and serves it through the Kubernetes aggregation layer as the metrics.k8s.io API. The HPA controller and kubectl top are clients of exactly that API. Prometheus is a different thing entirely: it stores history and powers dashboards and custom metrics, but the resource HPA and kubectl top want metrics.k8s.io, which only Metrics Server (or an equivalent) provides.
There are three metrics APIs in Kubernetes, and knowing which one a given HPA uses tells you which component must be healthy:
| API group | Served by | Feeds | Example metric |
|---|---|---|---|
metrics.k8s.io (resource) |
Metrics Server | kubectl top, CPU/mem HPAs, VPA recommender |
pod CPU cores, pod memory bytes |
custom.metrics.k8s.io (custom) |
Prometheus Adapter | HPAs on in-cluster app metrics | http_requests_per_second, queue depth |
external.metrics.k8s.io (external) |
KEDA / cloud adapters | HPAs on out-of-cluster signals | SQS ApproximateNumberOfMessages, Kafka lag |
Install it with helm_release. The chart is first-party (kubernetes-sigs), and on EKS you almost always need --kubelet-insecure-tls because the kubelet’s serving certificate is self-signed and not approved by the cluster CA — without the flag Metrics Server logs x509: certificate signed by unknown authority and never becomes ready. This is the single most common EKS-specific Metrics Server failure.
resource "helm_release" "metrics_server" {
  name       = "metrics-server"
  repository = "https://kubernetes-sigs.github.io/metrics-server/"
  chart      = "metrics-server"
  version    = "3.12.2" # pin it — never track "latest"
  namespace  = "kube-system"

  # EKS kubelet serving certs are self-signed; allow Metrics Server to scrape them.
  set {
    name  = "args[0]"
    value = "--kubelet-insecure-tls"
  }

  # Sensible defaults; the chart already sets a resource-metrics resolution of 15s.
  set {
    name  = "replicas"
    value = "2" # HA: two replicas so a node roll doesn't blind your HPAs
  }
}
Prefer the chart’s set blocks over hand-rolling a Deployment: the chart wires the APIService registration, RBAC and the aggregation-layer plumbing correctly. The Helm arguments worth knowing:
| Helm value | Default | Set it when |
|---|---|---|
args[] (--kubelet-insecure-tls) |
off | Almost always on EKS (self-signed kubelet certs) |
args[] (--metric-resolution) |
15s |
Rarely; lower = more kubelet load |
replicas |
1 |
Production — run 2 for HA so HPAs aren’t blinded on node roll |
resources |
small | Big clusters (thousands of pods) need more memory |
apiService.create |
true |
Leave true — this registers v1beta1.metrics.k8s.io |
defaultArgs |
preset | Keep; it includes --kubelet-preferred-address-types |
Verification is three commands, and you should treat “the APIService reports Available” as the gate before you even look at an HPA:
# 1. The aggregated API is registered and healthy?
kubectl get apiservice v1beta1.metrics.k8s.io
# NAME                    SERVICE                      AVAILABLE   AGE
# v1beta1.metrics.k8s.io  kube-system/metrics-server   True        2m

# 2. Node-level metrics flow?
kubectl top nodes
# NAME                          CPU(cores)  CPU%  MEMORY(bytes)  MEMORY%
# ip-10-0-1-23.ec2.internal     142m        7%    712Mi          19%

# 3. Pod-level metrics flow (namespace of your workload)?
kubectl top pods -n demo
# NAME                   CPU(cores)  MEMORY(bytes)
# web-6c8f...-abcde      248m        41Mi
| Symptom at verify | What it means | Fix |
|---|---|---|
error: Metrics API not available |
APIService not registered / not Available | Check kubectl get apiservice v1beta1.metrics.k8s.io; wait for pod ready |
x509: certificate signed by unknown authority in logs |
Kubelet serving cert not trusted | Add --kubelet-insecure-tls (the EKS default need) |
kubectl top empty for ~1 min after install |
First scrape hasn’t happened | Wait one --metric-resolution cycle (~15s) |
| Metrics work for nodes, not pods | Pod hasn’t been scraped yet / just started | Give it ~30s; new pods have no metrics initially |
Horizontal Pod Autoscaler (autoscaling/v2)
The HPA is a control loop in the controller-manager that, on a fixed interval (15s on upstream Kubernetes; on EKS the controller-manager flags are AWS-managed, so you cannot change the global sync period or tolerance — you tune per-HPA behavior instead), compares a live metric to a target and resizes the Deployment. The core formula is worth memorising because it explains every scaling decision you will ever debug:
desiredReplicas = ceil[ currentReplicas × ( currentMetricValue / desiredMetricValue ) ]
If eight pods average 80% CPU and the target is 50%, ceil(8 × 80/50) = ceil(12.8) = 13 replicas. A 10% tolerance (default) means the controller ignores ratios within 1 ± 0.1, so it doesn’t churn on noise. Always use autoscaling/v2 — v1 only supported CPU and had no behavior block; v2 supports multiple metrics, memory, custom/external metrics, and the scale-velocity policies that keep production sane.
v2 supports four metric types, and choosing the right one is most of the design:
Metric type |
Reads from | target.type |
Needs requests? | Typical use |
|---|---|---|---|---|
| Resource | metrics.k8s.io |
Utilization (%) |
Yes (denominator) | CPU% / memory% on a Deployment |
| Resource | metrics.k8s.io |
AverageValue (absolute) |
No | “hold 300m avg CPU” without a request base |
| Pods | custom metrics API | AverageValue |
No | per-pod app metric (e.g. inflight requests) |
| Object | custom metrics API | Value / AverageValue |
No | a metric on another object (Ingress RPS) |
| External | external metrics API | AverageValue / Value |
No | SQS depth, Kafka lag (often via KEDA) |
Resource requests are mandatory for a CPU-percent HPA ⚠️
This trap catches nearly everyone once. A Resource metric with target.type: Utilization is computed as currentUsage / requestedAmount. If the container has no resources.requests.cpu, there is no denominator, the HPA cannot compute a percentage, and kubectl get hpa shows the target as <unknown>/50% — forever. It never scales. The fix is not on the HPA; it is on the Deployment: set resources.requests.cpu (and .memory if you scale on memory). Utilization HPAs require requests; only the AverageValue variants can live without them.
HPA reads TARGETS as |
Root cause | Fix |
|---|---|---|
<unknown>/50% |
Container has no CPU request | Add resources.requests.cpu to the Deployment |
<unknown>/50% |
Metrics Server unhealthy/absent | Fix Metrics Server (kubectl top pods must work) |
<unknown>/50% (custom) |
Custom/external adapter down | Fix Prometheus Adapter / KEDA metrics API |
250%/50% but no scale-up |
At maxReplicas already |
Raise maxReplicas |
The native HCL resource models v2 faithfully — this is the HPA for our demo, holding 50% average CPU between 2 and 20 replicas, with a behavior block we dissect next:
resource "kubernetes_horizontal_pod_autoscaler_v2" "web" {
  metadata {
    name      = "web"
    namespace = kubernetes_namespace.demo.metadata[0].name
  }

  spec {
    min_replicas = 2
    max_replicas = 20

    scale_target_ref {
      api_version = "apps/v1"
      kind        = "Deployment"
      name        = kubernetes_deployment.web.metadata[0].name
    }

    metric {
      type = "Resource"
      resource {
        name = "cpu"
        target {
          type                = "Utilization"
          average_utilization = 50
        }
      }
    }

    behavior {
      scale_up {
        stabilization_window_seconds = 0    # react immediately to spikes
        select_policy                = "Max"
        policy {
          type           = "Percent"
          value          = 100              # allow doubling...
          period_seconds = 15
        }
        policy {
          type           = "Pods"
          value          = 4                # ...or +4 pods, whichever is larger
          period_seconds = 15
        }
      }
      scale_down {
        stabilization_window_seconds = 300  # wait 5 min of calm before shrinking
        select_policy                = "Max"
        policy {
          type           = "Percent"
          value          = 50               # remove at most 50% of pods/min
          period_seconds = 60
        }
      }
    }
  }
}
The behavior block: scale-up fast, scale-down slow
behavior (a v2 feature) is how you stop an HPA from flapping. It has two sides — scaleUp and scaleDown — each with a stabilization window and a list of rate policies; selectPolicy (Max/Min/Disabled) picks among the policies. The universal production shape is asymmetric: scale up eagerly, scale down reluctantly, because a false scale-down during a lull followed by a real spike is far more expensive than holding a few extra pods.
| Field | Meaning | Sane scale-up | Sane scale-down |
|---|---|---|---|
stabilizationWindowSeconds |
Look-back window; HPA uses the most extreme recommendation in it | 0 (react now) |
300 (wait for sustained calm) |
policy.type |
Pods (absolute) or Percent (relative) |
Percent 100 + Pods 4 |
Percent 50 |
policy.value |
The step size | double, or +4 | remove ≤50% |
policy.periodSeconds |
Window the policy applies over | 15 |
60 |
selectPolicy |
Combine policies: Max/Min/Disabled |
Max (fastest) |
Max, or Disabled to never shrink |
The defaults matter because if you omit behavior you inherit them — and the default 5-minute downscale stabilization is why an HPA “won’t scale down” for people who never configured it:
| Behavior | Default if omitted | Effect |
|---|---|---|
scaleUp.stabilizationWindowSeconds |
0 |
Scales up immediately on the metric |
scaleUp policies |
Percent 100 / 15s and Pods 4 / 15s, Max |
Doubles or +4 pods per 15s |
scaleDown.stabilizationWindowSeconds |
300 |
Won’t shrink until 5 min of lower load |
scaleDown policies |
Percent 100 / 15s |
Can remove all excess in one step |
Flapping (rapid up/down/up) is almost always a stabilization problem: widen scaleDown.stabilizationWindowSeconds, lower the scaleDown Percent, or set scaleDown.selectPolicy = "Disabled" for a workload that should only ever grow within a window (then reset on a schedule). Over-aggressive scale-up thrash is rarer but is tamed by a small scaleUp stabilization window or a Pods-capped step.
Beyond CPU: custom, external and KEDA
CPU and memory are proxies. The metric that actually reflects a web service’s load is requests per second or queue depth, and for those you go past resource metrics. Two paths:
| Path | API served | Best for | Terraform |
|---|---|---|---|
| Prometheus Adapter | custom.metrics.k8s.io |
In-cluster app metrics you already scrape (RPS, p99, inflight) | helm_release for the adapter + an HPA Pods/Object metric |
| KEDA | external.metrics.k8s.io |
Event-driven sources (SQS, Kafka, cron), scale-to-zero | helm_release kedacore/keda + a ScaledObject |
KEDA (Kubernetes Event-Driven Autoscaling) is the advanced path most EKS teams reach for, because it scales on the queue or stream that is the work, and it can scale to zero when idle (a plain HPA has a floor of minReplicas ≥ 1). Under the hood KEDA creates and manages an HPA for the 1→N range and handles 0→1 itself. Its scalers cover the AWS event surface:
| KEDA scaler | Signal | Auth on EKS |
|---|---|---|
aws-sqs-queue |
ApproximateNumberOfMessages |
IRSA or Pod Identity role |
aws-kinesis-stream |
shard/records | IRSA |
kafka |
consumer-group lag | SASL/mTLS |
prometheus |
any PromQL result | in-cluster |
cron |
time window | none (deterministic pre-scale) |
A worker that scales on an SQS backlog, from zero to thirty, driven by KEDA and authenticated with IRSA (so no static AWS keys live in the pod), looks like this — apply it with kubectl_manifest for the same CRD-timing reason we cover shortly:
apiVersion: keda.sh/v1alpha1
kind: ScaledObject
metadata:
  name: worker
  namespace: demo
spec:
  scaleTargetRef:
    name: worker            # the Deployment
  minReplicaCount: 0        # scale to zero when the queue is empty
  maxReplicaCount: 30
  cooldownPeriod: 120
  triggers:
    - type: aws-sqs-queue
      metadata:
        queueURL: https://sqs.ap-south-1.amazonaws.com/123456789012/jobs
        queueLength: "5"    # target ~5 messages per replica
        awsRegion: ap-south-1
      authenticationRef:
        name: keda-aws-irsa # a TriggerAuthentication bound to an IRSA role
For the RPS-on-Prometheus route, wire the EKS observability lesson’s Prometheus, add the Prometheus Adapter via helm_release, and give the HPA a Pods metric named after your recording rule (e.g. http_requests_per_second).
Vertical Pod Autoscaler (VPA)
Where the HPA answers “how many pods?”, the VPA answers “how big should each pod be?” — it observes historical CPU/memory usage and recommends (or sets) the container’s requests. That solves the request-guessing problem that plagues every cluster: requests set too high waste money and starve the scheduler; too low and pods get CPU-throttled or OOM-killed. The VPA is not built into Kubernetes — you install its three controllers (usually the Fairwinds chart) plus its CRDs.
| VPA component | Role | Disruptive? |
|---|---|---|
| Recommender | Watches usage (from Metrics Server / Prometheus), computes target, lowerBound, upperBound, uncappedTarget |
No |
| Updater | Evicts pods whose requests are outside bounds so they get recreated | Yes (evicts) |
| Admission controller | Mutating webhook that rewrites requests on pod creation from the recommendation |
No (but changes new pods) |
The behaviour hinges entirely on updateMode, and the safe default for learning and for HPA-managed workloads is Off (recommend only — nothing is evicted or changed):
updateMode |
Sets requests at creation? | Evicts running pods to resize? | Use when |
|---|---|---|---|
Off |
No | No | Recommend only — read status.recommendation, decide yourself. Safe with HPA. |
Initial |
Yes (at pod creation) | No | Set good requests once; don’t disrupt running pods |
Recreate |
Yes | Yes (evict + recreate) | Right-size long-running pods; tolerate restarts |
Auto |
Yes | Yes (today == Recreate) | Full autopilot; disruptive. In-place resize is the future (K8s 1.33 beta), not yet default |
Install the controller with Helm, then declare a recommend-only VPA for the workload. Note the guardrails — minAllowed/maxAllowed cap what the recommender may suggest so a runaway sample can’t ask for a 32-core pod:
resource "helm_release" "vpa" {
  name       = "vpa"
  repository = "https://charts.fairwinds.com/stable"
  chart      = "vpa"
  version    = "4.5.0"
  namespace  = "vpa"
  create_namespace = true

  set {
    name  = "recommender.enabled"
    value = "true"
  }
  # Keep the updater OFF cluster-wide while learning; per-VPA updateMode still governs.
  set {
    name  = "updater.enabled"
    value = "false"
  }
}
apiVersion: autoscaling.k8s.io/v1
kind: VerticalPodAutoscaler
metadata:
  name: web
  namespace: demo
spec:
  targetRef:
    apiVersion: apps/v1
    kind: Deployment
    name: web
  updatePolicy:
    updateMode: "Off"          # recommend only — safe alongside the CPU HPA
  resourcePolicy:
    containerPolicies:
      - containerName: "*"
        minAllowed: { cpu: 50m,  memory: 64Mi }
        maxAllowed: { cpu: "1",  memory: 512Mi }
        controlledResources: ["cpu", "memory"]
Read the recommendation with kubectl describe vpa web -n demo — the Target is what the VPA would set, Lower/Upper Bound the range it’s confident in. In Off mode you take that number and update the Deployment’s requests yourself (ideally in the same Terraform), getting VPA’s right-sizing without its disruption.
The HPA + VPA conflict — and how to combine them ⚠️
Do not run a VPA in Auto/Recreate mode on the same resource an HPA scales on. The reason is mechanical: the HPA’s Utilization target is usage / request. If the VPA changes the request (the denominator) at the same time the HPA is reacting to usage (the numerator), the two loops chase each other — the VPA raises requests, utilisation drops, the HPA removes pods, per-pod load rises, the VPA raises requests again — and the workload oscillates. The official guidance is blunt: VPA (in an updating mode) and a CPU/memory HPA must not target the same metric.
| Combination | Safe? | Why / how |
|---|---|---|
HPA on CPU + VPA Off (recommend) |
Yes | VPA only advises; nothing fights the HPA |
HPA on CPU + VPA Auto on CPU/mem |
No ⚠️ | VPA moves the HPA’s denominator → oscillation |
HPA on custom/external (RPS, SQS) + VPA Auto on CPU/mem |
Yes | Different signals — HPA scales count on RPS, VPA sizes on CPU/mem |
HPA on CPU + VPA Auto on memory only |
Caution | Allowed, but memory eviction still disrupts the HPA’s pods; prefer recommend-only |
So the two production-safe patterns are: (1) HPA on CPU (or a custom metric) for count, VPA in Off mode for guidance you apply deliberately; or (2) HPA on a business metric like RPS or queue depth (via Prometheus Adapter or KEDA) for count, and VPA in Auto for size — because now the two controllers read genuinely independent signals. Reach for pattern (2) when you’ve outgrown CPU-as-a-proxy and want each axis fully automated.
Managing Kubernetes objects from Terraform
You have three ways to push a Kubernetes object from Terraform, and picking wrong is why VPA and KEDA installs mysteriously fail on the first apply. The decision is really about CRDs and timing:
| Approach | Best for | CRD from the same apply? | Plan quality |
|---|---|---|---|
Native resources (kubernetes_deployment, ..._horizontal_pod_autoscaler_v2) |
Core objects with a first-party resource | N/A (built-in kinds) | Best — fully typed diff |
helm_release |
Controllers & their CRDs (Metrics Server, VPA, KEDA, Prometheus Adapter) | Yes (chart bundles CRDs) | Coarse (release-level) |
kubernetes_manifest (hashicorp) |
Arbitrary CRs when the CRD already exists | No ⚠️ | Typed, but strict |
kubectl_manifest (gavinbunney/kubectl) |
CRs whose CRD is installed in the same run | Yes | Weaker (string diff) |
The plan-time CRD problem ⚠️
kubernetes_manifest performs a server-side lookup of the resource’s GVK during terraform plan. If the CRD does not yet exist — because the Helm release that installs it is also in this plan — the plan fails with no matches for kind "VerticalPodAutoscaler" / cannot create REST mapping. You cannot install a CRD and create a custom resource of that CRD in a single kubernetes_manifest-based apply. Three ways out:
- Two-stage apply —
terraform apply -target=helm_release.vpafirst (installs the CRD), then a normalapplyfor the CR. Correct but breaks single-command automation. kubectl_manifest(gavinbunney/kubectl) — it defers the API call to apply time, so a CRD created earlier in the same apply is visible when the CR is created. This is why our demo uses it for the VPA custom resource.- Bundle in one Helm chart — ship the controller and the CRs together so Helm orders them.
This is the concrete reason the demo mixes providers: native resource for the HPA (a built-in kind, best diff), helm for Metrics Server and the VPA controller, and kubectl_manifest for the VPA custom resource (its CRD is born in the same apply). It’s not inconsistency — it’s each tool on the job it’s correct for.
Hands-on: build it with Terraform
We now assemble the whole layer and run it end to end against a real EKS cluster, then generate load and watch it scale. ⚠️ This runs real pods and may trigger EC2 node provisioning — small but real spend. Destroy when done.
The layout — one root module, provider auth to EKS, four workload files:
| File | Contents |
|---|---|
versions.tf |
required_providers (aws, kubernetes, helm, kubectl) + S3 backend |
providers.tf |
EKS data sources + kubernetes/helm/kubectl provider auth |
variables.tf |
cluster_name, region, namespace, HPA/VPA knobs |
metrics.tf |
Metrics Server + VPA controller (helm_release) |
workload.tf |
namespace, Deployment (with requests), Service |
autoscaling.tf |
HPA (native) + VPA CR (kubectl_manifest) |
outputs.tf |
names to verify against |
versions.tf — pin everything; the S3 backend + DynamoDB lock is the standard pattern from the AWS getting-started lesson:
terraform {
  required_version = ">= 1.6"
  required_providers {
    aws        = { source = "hashicorp/aws",        version = "~> 5.60" }
    kubernetes = { source = "hashicorp/kubernetes", version = "~> 2.31" }
    helm       = { source = "hashicorp/helm",       version = "~> 2.14" }
    kubectl    = { source = "gavinbunney/kubectl",  version = "~> 1.14" }
  }
  backend "s3" {
    bucket         = "kloudvin-tfstate"
    key            = "eks/autoscaling/terraform.tfstate"
    region         = "ap-south-1"
    dynamodb_table = "kloudvin-tf-lock" # or S3-native lockfile on TF 1.10+
    encrypt        = true
  }
}
providers.tf — authenticate the Kubernetes-family providers to the EKS API. Two patterns: the aws_eks_cluster_auth token (simple, but the token expires in ~15 min — fine for local runs, risky for long CI applies) or the exec plugin (calls aws eks get-token at apply time — the CI-safe choice). We show the exec form; the providers lesson covers the trade-offs in depth.
data "aws_eks_cluster" "this"      { name = var.cluster_name }

locals {
  eks_host = data.aws_eks_cluster.this.endpoint
  eks_ca   = base64decode(data.aws_eks_cluster.this.certificate_authority[0].data)
  eks_exec = {
    api_version = "client.authentication.k8s.io/v1beta1"
    command     = "aws"
    args        = ["eks", "get-token", "--cluster-name", var.cluster_name, "--region", var.region]
  }
}

provider "kubernetes" {
  host                   = local.eks_host
  cluster_ca_certificate = local.eks_ca
  exec {
    api_version = local.eks_exec.api_version
    command     = local.eks_exec.command
    args        = local.eks_exec.args
  }
}

provider "helm" {
  kubernetes {
    host                   = local.eks_host
    cluster_ca_certificate = local.eks_ca
    exec {
      api_version = local.eks_exec.api_version
      command     = local.eks_exec.command
      args        = local.eks_exec.args
    }
  }
}

provider "kubectl" {
  host                   = local.eks_host
  cluster_ca_certificate = local.eks_ca
  load_config_file       = false
  exec {
    api_version = local.eks_exec.api_version
    command     = local.eks_exec.command
    args        = local.eks_exec.args
  }
}
variables.tf:
variable "cluster_name" { type = string }
variable "region"       {
  type = string
  default = "ap-south-1"
}
variable "namespace"    {
  type = string
  default = "demo"
}

variable "hpa" {
  type = object({
    min_replicas       = number
    max_replicas       = number
    target_cpu_percent = number
  })
  default = { min_replicas = 2, max_replicas = 20, target_cpu_percent = 50 }
}
metrics.tf — Metrics Server and the VPA controller (the helm_release blocks shown earlier). workload.tf — the workload; note the two load-bearing details: resources.requests.cpu (without it the HPA reads <unknown>) and lifecycle { ignore_changes = [spec[0].replicas] } (without it every apply reverts the HPA’s replica count):
resource "kubernetes_namespace" "demo" {
  metadata { name = var.namespace }
}

resource "kubernetes_deployment" "web" {
  metadata {
    name      = "web"
    namespace = kubernetes_namespace.demo.metadata[0].name
    labels    = { app = "web" }
  }
  spec {
    replicas = var.hpa.min_replicas          # initial only — HPA owns it after
    selector { match_labels = { app = "web" } }
    template {
      metadata { labels = { app = "web" } }
      spec {
        container {
          name  = "web"
          image = "registry.k8s.io/hpa-example" # classic php-apache CPU burner
          port { container_port = 80 }
          resources {
            requests = { cpu = "250m", memory = "128Mi" } # ⚠️ mandatory for CPU% HPA
            limits   = { cpu = "500m", memory = "256Mi" }
          }
        }
      }
    }
  }
  lifecycle {
    ignore_changes = [spec[0].replicas] # ⚠️ let the HPA, not Terraform, set replicas
  }
}

resource "kubernetes_service" "web" {
  metadata{
    name = "web"
    namespace = kubernetes_namespace.demo.metadata[0].name
  }
  spec {
    selector = { app = "web" }
    port{
      port = 80
      target_port = 80
    }
  }
}
autoscaling.tf — the native HPA (shown in full earlier) plus the VPA custom resource via kubectl_manifest, with depends_on the controller so the CRD exists at apply time:
resource "kubectl_manifest" "vpa_web" {
  depends_on = [helm_release.vpa] # CRD is installed by the chart in this same apply
  yaml_body  = yamlencode({
    apiVersion = "autoscaling.k8s.io/v1"
    kind       = "VerticalPodAutoscaler"
    metadata   = { name = "web", namespace = var.namespace }
    spec = {
      targetRef    = { apiVersion = "apps/v1", kind = "Deployment", name = "web" }
      updatePolicy = { updateMode = "Off" } # recommend-only: safe next to the CPU HPA
      resourcePolicy = {
        containerPolicies = [{
          containerName       = "*"
          minAllowed          = { cpu = "50m", memory = "64Mi" }
          maxAllowed          = { cpu = "1",   memory = "512Mi" }
          controlledResources = ["cpu", "memory"]
        }]
      }
    }
  })
}
Run it: init → plan → apply → verify → load test → destroy
| # | Command | What you should see |
|---|---|---|
| 1 | terraform init |
Providers aws/kubernetes/helm/kubectl downloaded; S3 backend initialised |
| 2 | terraform plan -var cluster_name=kloudvin-eks |
~7 to add: 2 helm releases, ns, deployment, service, HPA, VPA CR |
| 3 | terraform apply -var cluster_name=kloudvin-eks |
Helm releases install first; HPA + VPA CR created after |
| 4 | kubectl top pods -n demo |
Metrics flow (proves Metrics Server works) |
| 5 | kubectl get hpa -n demo |
TARGETS shows cpu: 1%/50%, REPLICAS 2 (not <unknown>) |
| 6 | kubectl describe vpa web -n demo |
A Target: CPU/memory recommendation |
| 7 | load generator (below) | HPA TARGETS climbs past 50%, REPLICAS grows |
| 8 | kubectl get pods,nodes -n demo -w |
New pods appear; if they Pending, a node joins |
| 9 | terraform destroy |
All objects removed |
After apply, confirm the HPA is healthy — a real target, not <unknown>:
kubectl get hpa -n demo
# NAME  REFERENCE        TARGETS       MINPODS  MAXPODS  REPLICAS  AGE
# web   Deployment/web   cpu: 1%/50%   2        20       2         40s
Now drive load. The classic hpa-example image burns CPU on every request, so a tight wget loop from a throwaway pod pushes utilisation up fast. Open two more terminals to watch the HPA and the pods/nodes:
# terminal 1 — generate load
kubectl run -n demo load --image=busybox:1.36 --restart=Never -- \
  /bin/sh -c "while true; do wget -q -O- http://web; done"

# terminal 2 — watch the HPA decide
kubectl get hpa web -n demo -w
# web   ...  cpu: 1%/50%    2   20   2
# web   ...  cpu: 210%/50%  2   20   4     <- spike; scale_up (Percent 100 / +4)
# web   ...  cpu: 158%/50%  2   20   8
# web   ...  cpu:  74%/50%  2   20   11
# web   ...  cpu:  49%/50%  2   20   11    <- settled near target

# terminal 3 — watch pods, and nodes follow if the cluster fills
kubectl get pods,nodes -n demo -w
What you are watching is the whole chain fire. The HPA reads the spike and adds pods per the scaleUp policy (double, or +4, whichever is more). As replicas climb, the scheduler may run out of allocatable CPU; those pods sit Pending, and Karpenter (or the Cluster Autoscaler) sees the unschedulable pods and provisions a node — the composition the whole lesson builds toward. Delete the load pod (kubectl delete pod load -n demo) and, after the 5-minute scaleDown stabilization window, the HPA walks replicas back toward 2, and shortly after Karpenter consolidates the now-empty node.
| Observation during load | Which controller | Governed by |
|---|---|---|
TARGETS jumps to 200%+ |
(just the metric) | Metrics Server sampling |
REPLICAS 2 → 4 in one step |
HPA scale-up | behavior.scaleUp (Percent 100/Pods 4) |
New pods Pending |
scheduler | insufficient allocatable CPU |
| A node appears ~1 min later | Karpenter / CA | unschedulable-pod signal |
| After load stops, replicas hold ~5 min | HPA scale-down stabilization | scaleDown.stabilizationWindowSeconds=300 |
| Node drains/consolidates later | Karpenter | consolidation policy |
Variables, outputs & making it reusable
The demo is one root module; the reusable form is a small module you stamp per workload so every team gets the same HPA guardrails. Parameterise the bounds, the target, and the behavior windows; expose the HPA and VPA names as outputs so callers can assert on them.
| Module input | Type | Default | Purpose |
|---|---|---|---|
name / namespace |
string | — | Which Deployment to attach to |
min_replicas / max_replicas |
number | 2 / 20 | HPA bounds |
target_cpu_percent |
number | 50 | Utilization target |
scale_down_stabilization |
number | 300 | Anti-flap window (s) |
vpa_update_mode |
string | "Off" |
Off/Initial/Recreate/Auto |
enable_vpa |
bool | true | Toggle the VPA CR |
module "web_autoscaling" {
  source              = "./modules/pod-autoscaling"
  name                = "web"
  namespace           = "demo"
  min_replicas        = 2
  max_replicas        = 20
  target_cpu_percent  = 50
  vpa_update_mode     = "Off" # recommend-only while an HPA owns CPU
}

output "hpa_name" { value = module.web_autoscaling.hpa_name }
For the controllers (Metrics Server, VPA, KEDA), prefer community modules over hand-rolled helm_release when you want IRSA, sane defaults and lifecycle handled for you — the terraform-aws-modules/eks/aws ecosystem and its eks-blueprints-addons module install Metrics Server, KEDA and friends as first-class add-ons with the IRSA roles wired. Roll your own helm_release (as here) when you need tight control over chart values or are pinning an exact version for a compliance baseline. A for_each over a map of workloads turns the module into a fleet-wide policy — every Deployment in a list gets the same HPA shape, reviewed in one place.
Common mistakes and troubleshooting
| Symptom | Cause | Fix |
|---|---|---|
kubectl get hpa shows TARGETS <unknown>/50% |
No CPU request on the container | Add resources.requests.cpu to the Deployment |
<unknown> and kubectl top also fails |
Metrics Server absent/unhealthy | Install/repair Metrics Server; check apiservice v1beta1.metrics.k8s.io |
Metrics Server pod x509: unknown authority |
Kubelet self-signed serving cert (EKS) | Add --kubelet-insecure-tls to its args |
HPA scaled up but pods stay Pending |
No allocatable node capacity | This is expected — Karpenter/CA adds a node; verify the node autoscaler is installed |
Every terraform apply resets replicas to min |
Terraform manages replicas too |
lifecycle { ignore_changes = [spec[0].replicas] } |
| HPA flaps up/down every minute | Scale-down too aggressive / no stabilization | Widen scaleDown.stabilizationWindowSeconds; lower Percent |
plan fails no matches for kind "VerticalPodAutoscaler" |
kubernetes_manifest needs the CRD at plan time |
Use kubectl_manifest, or two-stage -target apply |
| VPA keeps evicting pods / app restarts | VPA updateMode: Auto/Recreate |
Switch to Off (recommend-only) or accept disruption |
| HPA + VPA oscillate, replicas thrash | Both act on the same metric (CPU) | VPA on memory-only, or Off; or HPA on a custom metric |
Custom-metric HPA reads <unknown> |
Prometheus Adapter / KEDA metrics API down | Check kubectl get apiservice v1beta1.custom.metrics.k8s.io |
KEDA ScaledObject won’t scale from 0 |
Trigger/auth misconfigured (IRSA) | Verify TriggerAuthentication + IRSA role; check KEDA operator logs |
| Token-auth provider fails mid long apply | aws_eks_cluster_auth token expired (~15 min) |
Use the exec (aws eks get-token) provider auth |
The nastiest real gotchas, in prose. The <unknown> target is a two-suspect mystery and you must eliminate both: no CPU request on the container, or Metrics Server not serving. Check kubectl top pods -n <ns> first — if that fails it’s Metrics Server; if top works but the HPA still reads <unknown>, it’s the missing request. The ignore_changes line is not optional. Because the HPA writes spec.replicas and Terraform also thinks it owns that field, without ignore_changes = [spec[0].replicas] every plan shows a spurious diff and every apply yanks the workload back to min_replicas, undoing the HPA between runs — a classic “why did prod suddenly drop to 2 pods during the deploy” incident. HPA+VPA on the same metric is a footgun, not a feature: if you want both fully automated, move the HPA onto a business metric (RPS via Prometheus Adapter, or a queue via KEDA) so the two controllers read independent signals; otherwise keep VPA in Off. VPA Auto mode evicts — it right-sizes by killing and recreating pods, which is disruptive for anything without a PodDisruptionBudget and graceful shutdown; on singletons it causes visible downtime. And the plan-time CRD failure is not a bug in your YAML — kubernetes_manifest genuinely cannot see a CRD that this same run installs, so use kubectl_manifest (defers to apply) or split the apply.
Cost, cleanup & production notes
The scaling controllers are nearly free — Metrics Server and the VPA recommender are small pods (tens of millicores, ~50–100Mi each). The cost is the workload they scale and the nodes underneath. An HPA that runs 2 pods at rest and 20 under load, on m6i capacity, is the difference between one small node idle and several nodes busy; the whole point is that spend tracks demand instead of being provisioned for peak 24/7. The line-item risks: a runaway maxReplicas with no upper node bound (an HPA + Karpenter with no ceiling will happily scale a bad loop into a large EC2 bill), and a VPA in Auto that ratchets requests up and forces bigger nodes.
| Item | At rest | Under load | Notes |
|---|---|---|---|
| Metrics Server (2 replicas) | ~free | ~free | HA is cheap; keep it |
| VPA recommender | ~free | ~free | Updater/admission add a little |
| Workload pods | min_replicas |
up to max_replicas |
The real driver |
| Nodes (Karpenter/CA) | baseline | scale with pods | The real bill — cap it |
Destroy cleanly: terraform destroy removes the HPA, VPA CR, Service, Deployment and both Helm releases. ⚠️ If a load-test pod is still running (kubectl run load ...), delete it first — it isn’t in Terraform state and will keep pods (and nodes) warm. After destroy, confirm kubectl get hpa,vpa,deploy -n demo is empty and that Karpenter has consolidated any nodes the test spun up.
Production hardening: (1) pin every chart version and every provider ~> — an unpinned Metrics Server upgrade can change the metrics pipeline under your HPAs. (2) Always cap maxReplicas and the node autoscaler’s limits so a bug can’t scale into a five-figure bill. (3) Give every HPA a behavior block — never ship the defaults into prod, because the 5-minute default downscale and the doubling scale-up are opinions you should make explicit. (4) Set resources.requests deliberately (use VPA Off recommendations as the input) — they are the denominator of every Utilization HPA and the currency of the scheduler. (5) Run Metrics Server with 2 replicas so a node roll doesn’t blind every HPA at once. (6) Keep the HPA’s replica ownership clean with ignore_changes, and prefer exec-based provider auth so long CI applies don’t die on an expired token.
Going deeper
The lesson so far gets you a working, production-shaped scaling layer. This section is what separates “it scales” from “I know exactly why it did that”: the Terraform ordering trap that bites the moment the cluster and the scalers share an apply, the parts of the HPA algorithm the formula alone doesn’t reveal, and the identity plumbing underneath the node layer.
The provider-auth-after-cluster-exists ordering trap ⚠️
The providers.tf above quietly assumes something load-bearing: the EKS cluster already exists when Terraform configures the kubernetes, helm and kubectl providers. Get that wrong and this whole stack fails on a fresh apply in a way that looks like a networking bug.
A Terraform provider is configured with host, cluster_ca_certificate and an auth token, and provider blocks are resolved early, while Terraform builds the graph — not lazily at the moment some resource needs a connection. If those values come from a data "aws_eks_cluster" pointed at a cluster created in the same apply, they are unknown at plan time. Terraform then either refuses outright with Provider configuration ... depends on values that cannot be determined until apply, or — the quieter, nastier outcome — the provider initialises against an empty endpoint and every helm_release and kubernetes_* resource dies with Kubernetes cluster unreachable or dial tcp: connect: connection refused. Engineers lose hours on security groups and VPC routing for what is really a graph-ordering problem.
Three sound arrangements, in order of preference:
| Pattern | How | When to choose it |
|---|---|---|
| Two states, two applies | Cluster in its own root module and state; this scaling layer in a second module that reads it with data.aws_eks_cluster |
Recommended. The cluster is a slow-moving dependency; scaling policy changes weekly. Small blast radius, no unknown-at-plan values |
| One apply, providers fed from module outputs | Wire host/cluster_ca_certificate from the eks module’s outputs rather than a data source |
Acceptable for small setups that insist on one apply — still fragile on the very first create |
-target the cluster first |
terraform apply -target=module.eks, then a full apply |
An escape hatch, not a design. Fine for a demo, noisy and unreviewable in CI |
This lesson takes the first path by construction — the cluster is a prerequisite and data.aws_eks_cluster merely reads it — which is why the opening said “you already have an EKS cluster.” Note the shape of the trap: it is the same class of bug as the plan-time CRD problem earlier. Both are Terraform needing to know something at plan time that only exists after apply. Recognising that family of failure is worth more than memorising either instance. The Kubernetes & Helm providers lesson and the EKS cluster provisioning lesson work through the split in detail.
What the HPA formula doesn’t show
desiredReplicas = ceil[currentReplicas × (currentMetric / targetMetric)] is the whole story only for one healthy metric across ready pods. Three refinements govern real behaviour, and each explains a “why didn’t it scale?” ticket:
- Not-ready and just-started pods are excluded from the average. The controller drops pods that aren’t
Ready, and for CPU it also ignores pods still inside the initialization window (--cpu-initialization-period, default 5 min) and the initial readiness delay (default 30 s) — because a JVM or a Python app burns CPU at startup and would otherwise look overloaded. On EKS these are AWS-managed controller-manager flags you cannot change, but the effect is visible: a batch of freshly-added pods will not immediately drag the average down, so the HPA doesn’t overshoot on the way up. - Missing metrics are treated pessimistically, in both directions. If some pods have no metric sample yet, the controller assumes they sit at 0% when it is considering scaling up and 100% when it is considering scaling down. Both assumptions are the conservative one for the move under consideration, so a gap in data can never justify an aggressive decision.
- Multiple metrics take the maximum. When an HPA lists several metrics — CPU and memory and a custom RPS — the controller computes
desiredReplicasindependently for each and scales to the largest result. The mental model: any single metric can force a scale-up, but every metric must agree before a scale-down. This is why adding a memory metric to a CPU HPA can only ever make it run more pods, never fewer — a genuinely surprising result if you expected an average.
| Situation | The controller’s rule | Consequence you observe |
|---|---|---|
Pod is NotReady or newly started |
Excluded from the metric average | Fresh pods don’t skew the decision; smoother ramp |
| Some pods report no metric | Assume 0% when scaling up, 100% when scaling down | Data gaps never trigger a reckless move |
| Several metrics on one HPA | Compute each, take the max desired | Busiest signal wins; scale-down needs consensus |
| Ratio inside the ~10% tolerance | No change at all | No churn on ordinary noise |
The node layer, and which controllers need AWS IAM
This lesson stops at the pod layer and hands the node layer to its companion lesson, but hold the shape of the choice, because it determines how quickly the Pending → node hop at the end of your load test actually resolves:
| Cluster Autoscaler | Karpenter | |
|---|---|---|
| Model | Pool-first: nudges an ASG’s desired count | Pod-first: calls EC2 Fleet to fit the pending pods |
| Node shape | Fixed per node group/ASG | Right-sized per workload, any instance type that fits |
| Spot & bin-packing | Coarse, ASG-level | Native spot-first, plus consolidation of waste |
| Latency to a usable node | Slower (ASG scaling activity) | Faster (direct Fleet call) |
| Terraform surface | helm_release + IRSA + ASG discovery tags |
Karpenter submodule (IRSA, node role, instance profile, SQS + EventBridge) + NodePool/EC2NodeClass |
That leads to the identity question that ties the lesson together — which of these controllers need AWS permissions, and which need none at all? The split is clean: controllers that read only in-cluster signals need nothing, while controllers that call AWS APIs need an IRSA role (or the newer EKS Pod Identity) so that no static access keys ever sit in a pod:
| Controller | Needs an AWS IAM role? | Why |
|---|---|---|
| Metrics Server | No | Scrapes the kubelet Summary API, in-cluster only |
| HPA controller | No | Reads metrics.k8s.io through the API server |
| VPA (all three components) | No | Reads the metrics API, mutates pods in-cluster |
| Prometheus Adapter | No | Queries in-cluster Prometheus |
| KEDA (AWS scalers) | Yes — IRSA / Pod Identity | Polls SQS, Kinesis and friends in your account |
| Cluster Autoscaler | Yes — IRSA | Calls Auto Scaling SetDesiredCapacity |
| Karpenter | Yes — IRSA | Calls EC2 Fleet, drains the SQS interruption queue |
So everything this lesson installs — Metrics Server, the HPA, a recommend-only VPA — needs zero AWS IAM, which is why no IRSA appeared in the hands-on build. IRSA enters the moment you scale on an AWS signal or let a node autoscaler buy capacity; the OIDC & IRSA lesson is the mechanism behind both.
In-place pod resize changes the VPA calculus — but not the conflict
VPA Auto/Recreate is disruptive for one historical reason: changing a running pod’s requests meant killing and recreating it. Kubernetes in-place pod vertical scaling (the resize subresource, beta in 1.33) lets the kubelet adjust a container’s CPU and memory without a restart, and as the VPA adopts it the “VPA evicts your pods” objection genuinely softens.
What it does not fix is the HPA+VPA conflict. That oscillation is a control-loop problem — two controllers writing and reading opposite ends of the same ratio — not an eviction problem. Resizing a pod in place still moves the HPA’s Utilization denominator, and the loops still chase each other; they just do it without restarts, which arguably makes it harder to notice. Keep VPA in Off beside a CPU HPA regardless of your Kubernetes version. The reason to combine full automation on both axes is still independent signals (HPA on RPS or queue depth, VPA on CPU/memory), never gentler eviction.
Practice challenges
Six exercises escalating from a first health check to the two Terraform-specific traps. Commands and output shapes below are representative — no live cluster or AWS credentials are assumed. Try each before opening the solution.
1. Prove the meter works before you trust any autoscaler (beginner). You’ve just applied the Metrics Server helm_release. Establish, in the right order, that a CPU HPA could work — before you create one.
<details> <summary>Solution</summary>
kubectl get apiservice v1beta1.metrics.k8s.io    # AVAILABLE must be True
kubectl top nodes                                 # node metrics flowing
kubectl top pods -n demo                          # pod metrics flowing
# Representative:
# NAME                    SERVICE                      AVAILABLE   AGE
# v1beta1.metrics.k8s.io  kube-system/metrics-server   True        2m
If AVAILABLE is False, check the Metrics Server pod logs for x509: certificate signed by unknown authority and add --kubelet-insecure-tls. Why: the HPA is a client of metrics.k8s.io — debugging an HPA before confirming its data source is backwards, and it is the single most common wasted hour in this topic.
</details>
2. Diagnose <unknown>/50% in under a minute (beginner). A colleague’s HPA has read TARGETS: <unknown>/50% for an hour. There are exactly two suspects. Separate them with one command, then fix the more likely one.
<details> <summary>Solution</summary>
kubectl top pods -n demo
# Works  -> Metrics Server is fine, so the container has no CPU *request*
# Fails  -> Metrics Server is the problem, not the Deployment
If top works, the Deployment is missing its denominator — add it:
resources {
  requests = { cpu = "250m", memory = "128Mi" }
  limits   = { cpu = "500m", memory = "256Mi" }
}
Why: Utilization is computed as usage / request. No request means no denominator, so the HPA can’t produce a percentage and never scales — and kubectl top is the one command that tells the two causes apart.
</details>
3. Explain “every deploy drops prod to 2 pods” (intermediate). The HPA holds 11 replicas happily, then a routine terraform apply slams the workload back to 2 and traffic browns out. Name the mechanism and fix it in HCL.
<details> <summary>Solution</summary>
resource "kubernetes_deployment" "web" {
  # ...
  lifecycle {
    ignore_changes = [spec[0].replicas]
  }
}
Why: both Terraform and the HPA believe they own spec.replicas. Terraform’s state says 2, the live cluster says 11, so every plan shows a spurious diff and every apply “corrects” it — undoing the autoscaler. ignore_changes cedes that one field to the controller that should own it, while Terraform keeps owning everything else.
</details>
4. Turn a VPA recommendation into requests, safely (intermediate). Your VPA has been running in Off mode for a week. Extract its recommendation and apply it without ever letting the VPA evict a pod.
<details> <summary>Solution</summary>
kubectl describe vpa web -n demo
# Representative recommendation block:
#   Container Name:  web
#   Target:      cpu: 180m   memory: 96Mi
#   Lower Bound: cpu: 140m   memory: 80Mi
#   Upper Bound: cpu: 240m   memory: 140Mi
Take Target, put it in the Deployment’s requests in Terraform, and apply through the normal review path:
requests = { cpu = "180m", memory = "96Mi" }
Why: this is the whole point of Off mode — you get the VPA’s observed-usage right-sizing as advice, applied deliberately in a reviewed pull request, with none of the eviction that makes Auto unsafe next to a CPU HPA. Target is the number to use; the bounds tell you how confident the recommender is.
</details>
5. Add a memory metric and predict the outcome (advanced). Extend the CPU HPA so memory pressure can also force scale-up. Before applying, state whether this can ever reduce the replica count.
<details> <summary>Solution</summary>
metric {
  type = "Resource"
  resource {
    name = "cpu"
    target {
      type                = "Utilization"
      average_utilization = 50
    }
  }
}

metric {
  type = "Resource"
  resource {
    name = "memory"
    target {
      type                = "Utilization"
      average_utilization = 70
    }
  }
}
It can never reduce the replica count. Why: with multiple metrics the controller computes desiredReplicas for each one independently and takes the maximum. Any single metric can force a scale-up, but a scale-down requires every metric to agree — so adding a metric is a monotonic increase in the pods you may run. (It also needs requests.memory set, for the same denominator reason as CPU.)
</details>
6. Fix the two plan-time unknowns (advanced). A single root module creates the EKS cluster, installs the VPA chart, and declares a kubernetes_manifest VPA custom resource. terraform plan fails twice: no matches for kind "VerticalPodAutoscaler", and Provider configuration ... cannot be determined until apply. Fix both, and say what they have in common.
<details> <summary>Solution</summary>
Swap the custom resource to a provider that defers its API call to apply time:
resource "kubectl_manifest" "vpa_web" {
  depends_on = [helm_release.vpa]
  yaml_body  = yamlencode({ /* ... */ })
}
And split the cluster out of this module so the providers configure against a cluster that already exists:
# state 1: the cluster.  state 2: this scaling layer, reading it via data.aws_eks_cluster
terraform apply   # in the cluster module, first
terraform apply   # then in the scaling module
Why: both errors are the same bug wearing different clothes — Terraform needs a fact at plan time that only exists after apply. kubernetes_manifest resolves the GVK during plan (so a CRD born in this run is invisible), and provider blocks resolve their host/CA during plan (so a cluster born in this run is unknown). kubectl_manifest defers the first; separate states defer the second.
</details>
Common beginner mistakes
These are misconceptions rather than symptoms — the troubleshooting table above tells you what to do, this tells you what to stop believing.
- “We already run Prometheus, so we don’t need Metrics Server.” Different jobs, different APIs. Prometheus is a time-series database for dashboards, alerts and history; Metrics Server holds only the latest sample, in memory, and serves it through the
metrics.k8s.ioaggregated API. A CPU/memory HPA andkubectl topare hard-wired to that API. Prometheus can feed HPAs, but only via the Prometheus Adapter servingcustom.metrics.k8s.io— a separate component solving a separate problem. The right model: Metrics Server is a live gauge, Prometheus is a flight recorder. - “The HPA will add a node when the pods don’t fit.” It will not, ever. The HPA’s entire vocabulary is
spec.replicas. It creates pods, and if no node has room those pods sitPendingindefinitely — that is a correct HPA doing its whole job. Adding nodes belongs to a separately-installed node autoscaler that watches for unschedulable pods. The right model: the HPA creates demand; Karpenter or the Cluster Autoscaler supplies capacity, and nothing connects them but the scheduler’s failure to place a pod. - “Two autoscalers means twice the automation, so I’ll run HPA and VPA on CPU together.” This is the fastest way to destabilise a workload.
Utilizationisusage / request; the HPA reacts to the numerator while the VPA rewrites the denominator, so each one’s correction invalidates the other’s reading and the replica count oscillates. The right model: on any one metric, exactly one controller may hold the pen. Either VPA advises only (Off), or the HPA moves to a genuinely independent signal like RPS or queue depth. - “Set requests generously — it’s safer.” Over-requesting is not conservative, it is expensive and slow. Inflated requests reserve capacity nobody uses, so the scheduler packs fewer pods per node and you pay for more nodes; worse, a bigger denominator means measured utilisation stays low, so the HPA scales up later than it should during a real spike. The right model: requests are a scheduling contract and an HPA denominator, not a safety margin — measure them with a VPA in
Offmode rather than guessing high. - “The HPA scales when the container approaches its limit.” It doesn’t look at
limitsat all. AUtilizationtarget is a percentage of the request;limitsgovern throttling and OOM-kills at the kubelet. Withrequests.cpu = 250mandlimits.cpu = 500m, a pod burning 250m is at 100% as far as the HPA is concerned while only halfway to its limit. The right model: requests drive scaling decisions, limits drive enforcement — and a wide gap between them makes HPA behaviour genuinely hard to reason about. - “Scale-up and scale-down should mirror each other.” Symmetry feels principled and is wrong, because the two errors have wildly different costs. Scaling up late means dropped requests and blown SLOs; scaling down late means a few extra pods for a few minutes. The right model: fast up, slow down — a
scaleUpstabilization window of0with ascaleDownwindow of300isn’t an inconsistency, it is a deliberately asymmetric bet on which mistake you’d rather make.
Glossary
- Metrics Server: the small cluster component that scrapes each kubelet’s Summary API and serves the latest CPU/memory numbers through
metrics.k8s.io. Not installed on EKS by default, keeps no history, and is a hard dependency of every CPU/memory HPA and ofkubectl top. metrics.k8s.io(resource metrics API): the aggregated API carrying pod and node CPU/memory. Served by Metrics Server; consumed bykubectl top, the HPA controller and the VPA recommender.custom.metrics.k8s.io/external.metrics.k8s.io: the two other metrics APIs — custom for in-cluster application metrics (served by the Prometheus Adapter), external for signals outside the cluster such as queue depth (served by KEDA or a cloud adapter).- Aggregation layer /
APIService: the Kubernetes mechanism that lets an add-on serve an extra API group through the main API server.kubectl get apiservice v1beta1.metrics.k8s.ioreportingAVAILABLE Trueis the gate to trusting any HPA. - HPA (Horizontal Pod Autoscaler): the controller that changes a workload’s replica count to hold a metric near a target. Always use
autoscaling/v2—v1was CPU-only with nobehavior. - VPA (Vertical Pod Autoscaler): the add-on that changes a pod’s CPU/memory requests based on observed usage. Three components: recommender (advises), updater (evicts to resize), admission controller (rewrites requests on creation).
updateMode: the VPA’s safety switch —Off(recommend only),Initial(set at pod creation),Recreate/Auto(evict and recreate to apply).Offis the only mode that is safe alongside a CPU HPA.- Requests vs limits:
requestsare what the scheduler reserves and what the HPA divides by;limitsare the ceiling the kubelet enforces through CPU throttling and OOM-kills. Scaling maths uses requests, never limits. Utilizationtarget: an HPA target expressed as a percentage of the container’s request. Requires a request to exist — without one the HPA reads<unknown>forever.AverageValuetarget: an HPA target expressed as an absolute per-pod number (e.g.300mCPU, 5 queue messages). Needs no request, which makes it the escape hatch when requests aren’t set.behaviorblock: theautoscaling/v2field that rate-limits scaling, with independentscaleUpandscaleDownsides. Omit it and you silently inherit the defaults, including a 300-second downscale stabilization.- Stabilization window: the look-back period over which the HPA considers past recommendations before acting, so it reacts to sustained conditions rather than noise. The standard cure for flapping.
selectPolicy: how the HPA combines multiple rate policies on one side —Max(fastest),Min(slowest), orDisabledto forbid movement in that direction entirely.- Tolerance: the roughly 10% dead band around the target inside which the HPA does nothing, preventing constant churn on ordinary metric noise.
- Cluster Autoscaler: the pool-first node autoscaler that adjusts an Auto Scaling Group’s desired count in response to unschedulable pods. Needs an IRSA role.
- Karpenter: the pod-first node autoscaler that reads pending pods’ actual requests and launches right-sized EC2 instances straight from Fleet, bin-packing and later consolidating them. Needs an IRSA role.
Pendingpod: a pod the scheduler cannot place on any node. It is the only signal a node autoscaler acts on, and therefore the hinge between pod scaling and node scaling.- KEDA: event-driven autoscaling that serves
external.metrics.k8s.ioand adds scale-to-zero, which a plain HPA (floor ofminReplicas ≥ 1) cannot do. It manages an HPA for the 1→N range and handles 0→1 itself. - IRSA (IAM Roles for Service Accounts): the EKS mechanism that maps a Kubernetes ServiceAccount to an AWS IAM role via OIDC, so pods call AWS APIs with no static keys. Needed by KEDA’s AWS scalers, the Cluster Autoscaler and Karpenter — but by none of Metrics Server, the HPA or the VPA.
kubectl_manifestvskubernetes_manifest: two ways to apply arbitrary Kubernetes objects from Terraform.kubernetes_manifest(HashiCorp) resolves the kind at plan time and so cannot see a CRD installed in the same run;kubectl_manifest(gavinbunney) defers to apply time and can.- Plan-time unknown: the general failure family behind both the CRD problem and the provider-auth trap — Terraform needing a fact while planning that only comes into existence during apply. The fix is always to defer the lookup or split the apply.
ignore_changes: thelifecyclemeta-argument that tells Terraform to stop managing a specific attribute. Mandatory onspec[0].replicasfor any HPA-scaled Deployment, or Terraform and the autoscaler fight over it.
Cheat-sheet
Resources & providers
| Thing | Resource / value |
|---|---|
| Metrics Server | helm_release · repo kubernetes-sigs.github.io/metrics-server |
| HPA (v2) | kubernetes_horizontal_pod_autoscaler_v2 |
| VPA controller | helm_release · Fairwinds vpa chart |
| VPA / KEDA CR | kubectl_manifest (CRD born same apply) |
| Deployment / Service | kubernetes_deployment / kubernetes_service |
| Must-have on Deployment | resources.requests.cpu + lifecycle { ignore_changes = [spec[0].replicas] } |
| EKS auth | data.aws_eks_cluster + exec (aws eks get-token) |
HPA spec quick-ref
| Field | Value |
|---|---|
minReplicas / maxReplicas |
floor / ceiling (2 / 20) |
metrics[].type |
Resource / Pods / Object / External |
target.type |
Utilization (needs requests) / AverageValue / Value |
behavior.scaleUp |
stabilization 0, Percent 100 + Pods 4, Max |
behavior.scaleDown |
stabilization 300, Percent 50 |
Verify & load-test commands
kubectl get apiservice v1beta1.metrics.k8s.io   # Metrics Server AVAILABLE=True
kubectl top nodes ; kubectl top pods -n demo    # metrics flowing?
kubectl get hpa -n demo                          # TARGETS not <unknown>
kubectl describe hpa web -n demo                 # events + current metrics
kubectl describe vpa web -n demo                 # Target recommendation
kubectl run -n demo load --image=busybox:1.36 --restart=Never -- \
  /bin/sh -c "while true; do wget -q -O- http://web; done"   # generate load
kubectl get hpa web -n demo -w                   # watch it scale
kubectl delete pod load -n demo                  # stop load
Interview and exam questions
-
Why does an HPA show
<unknown>for its CPU target, and what are the two possible causes? TheUtilizationtarget isusage / request; it reads<unknown>if there is no CPU request on the container (no denominator) or if Metrics Server isn’t servingmetrics.k8s.io. Diagnose withkubectl top pods— if that fails it’s Metrics Server, else it’s the missing request. -
Is Metrics Server installed on EKS by default? What does it provide? No. It serves the resource-metrics API (
metrics.k8s.io) — CPU/memory — thatkubectl topand CPU/memory HPAs consume. It keeps only the latest sample in memory; it is not a time-series store. -
State the HPA scaling formula.
desiredReplicas = ceil[currentReplicas × (currentMetricValue / desiredMetricValue)], subject to a ~10% tolerance and themin/maxReplicasbounds andbehaviorrate limits. -
What does the
behaviorblock do, and what’s the standard shape? It rate-limits and stabilizes scaling. Standard shape is asymmetric:scaleUpfast (0s window, double or +4 pods),scaleDownslow (300s stabilization, ≤50%/min) — cheap to hold spare pods, expensive to shed too early. -
HPA vs VPA vs Cluster Autoscaler/Karpenter — one line each. HPA changes replica count on live utilisation; VPA changes per-pod requests on historical usage; Karpenter/CA changes node count in response to unschedulable (Pending) pods.
-
Why can’t you run VPA
Autoand a CPU HPA on the same workload? The VPA changes the request (the HPA’s Utilization denominator) while the HPA reacts to usage (the numerator); the loops chase each other and oscillate. Combine safely by keeping VPA inOff, or by scaling the HPA on a custom/external metric so the signals are independent. -
Explain the plan-time CRD problem with
kubernetes_manifest.kubernetes_manifestresolves the resource’s GVK duringplan; if the CRD is installed by ahelm_releasein the same run, the CRD doesn’t exist at plan time and the plan fails. Usekubectl_manifest(defers to apply), a two-stage-targetapply, or bundle CRD+CR in one chart. -
Why must Terraform ignore the Deployment’s
replicas? Because the HPA ownsspec.replicas. Withoutlifecycle { ignore_changes = [spec[0].replicas] }, every apply reverts the workload tomin_replicas, fighting the HPA. (Terraform Associate-style: which meta-argument prevents a resource attribute from causing drift? →lifecycle.ignore_changes.) -
When would you choose KEDA over a plain CPU HPA? When the true load signal is an event source (SQS depth, Kafka lag) rather than CPU, or when you need scale-to-zero (a plain HPA floors at
minReplicas ≥ 1). KEDA servesexternal.metrics.k8s.ioand manages an HPA for 1→N while handling 0→1 itself. -
How does workload scaling compose with node scaling? HPA adds pods → some pods can’t be scheduled → they go
Pending→ Karpenter/CA sees unschedulable pods and provisions nodes → pods schedule. Node scaling is driven by the pods the HPA (or VPA) creates. -
What are VPA’s three components and the four update modes? Recommender (advises), Updater (evicts to resize), Admission controller (rewrites requests on creation). Modes:
Off(recommend only),Initial(set at creation),Recreate/Auto(evict + recreate to apply). -
Terraform Associate-style: which provider and resource model a Kubernetes HPA idiomatically?
hashicorp/kubernetesprovider, resourcekubernetes_horizontal_pod_autoscaler_v2(usev2, not the deprecatedv1, to get memory/custom metrics andbehavior).
Key takeaways
- Install Metrics Server first — CPU/memory HPAs and
kubectl topare clients ofmetrics.k8s.io, which EKS does not ship; on EKS you almost always need--kubelet-insecure-tls. - Resource requests are mandatory for a
UtilizationHPA — no request means no denominator means a permanent<unknown>target and zero scaling. - Let the HPA own replicas —
lifecycle { ignore_changes = [spec[0].replicas] }on the Deployment, or everyapplyfights the autoscaler back to the floor. - Always set
behavior— scale up fast, scale down slow (a widescaleDownstabilization window is the cure for flapping); the defaults are opinions, so make them yours. - VPA sizes, HPA counts, Karpenter capacitates — three axes, three controllers; keep VPA in
Offnext to a CPU HPA, or move the HPA to a custom metric before letting VPA runAuto. - Pick the right Terraform tool per object — native resources for built-in kinds,
helm_releasefor controllers and their CRDs,kubectl_manifestfor custom resources whose CRD is born in the same apply (the plan-time CRD trap). - The chain is the product — HPA adds pods, the scheduler runs out of room, Karpenter adds nodes; wire the Karpenter lesson to close the loop and cap
maxReplicasand node limits so cost can’t run away.