In a nutshell
Think of observability as the instrument panel and the black-box flight recorder bolted onto your cluster. The panel is the live read-out — airspeed, altitude, fuel — the numbers that tell you what is happening right now: CPU per pod, request rate, p99 latency. The recorder is what you replay after something goes wrong: the log lines and traces that tell you why it happened and where in the call graph it started. Metrics say what, logs say why, traces say where — three instruments answering three different questions, and you want all three wired up before the incident, not soldered together during it.
On EKS you get two ways to build that panel, and this lesson builds both. The AWS-native way is one add-on — amazon-cloudwatch-observability — that drops an agent and a log-shipper onto every node and lights up Container Insights with almost nothing to run. The open-source way is one Helm release — kube-prometheus-stack — that installs the whole Prometheus-and-Grafana ecosystem you then operate yourself. In the middle sit Amazon Managed Prometheus (AMP) and Amazon Managed Grafana (AMG), which keep Prometheus’s ergonomics and hand the storage back to AWS. The point that makes it a Terraform lesson: every one of those pieces — the agent’s IAM role, the Helm release, the volume its database lives on, the alert rules, the topic they page — is a resource you version, review, and stamp identically into dev and prod from one module.
Level: Advanced · Time: ~54 min
Prerequisites. Core Terraform (HCL, providers, resources, variables, state, modules); the aws, kubernetes and helm providers and how the EKS auth exec block hands each a fresh token; a running EKS cluster with the EBS CSI driver and a gp3 StorageClass (from the EKS EBS CSI & storage classes lesson); and a working feel for Kubernetes objects (Deployment, Service, DaemonSet, PVC, namespace). IRSA and EKS Pod Identity from the earlier EKS lessons help, but both are re-explained here.
After this lesson you can: install Container Insights as an aws_eks_addon with a correctly-scoped IRSA (or Pod Identity) role and capped log retention; install kube-prometheus-stack with a single helm_release, EBS-backed persistence, and a secret-safe Grafana password; make a ServiceMonitor actually get scraped through two-level selection; remote_write to AMP over SigV4 with an IRSA role; author USE/RED recording and alerting rules and fan them out to one SNS topic; and wrap the whole plane in a reusable module you stamp across a fleet.
A cluster you cannot see into is a cluster you are operating on faith. The moment real workloads land on EKS, the questions stop being “did it apply?” and become “which pod is pinning a node, why did the p99 double at 14:02, and where did those 500s come from” — and none of those have an answer unless the metrics, logs and traces were wired up before the incident, not during it. Observability is infrastructure exactly like the VPC and the node group are infrastructure, which means it belongs in Terraform next to them: the add-on, the IAM role that lets an agent write to CloudWatch, the Helm release that installs Prometheus, the PVC its TSDB lives on, the alert rules and the SNS topic they page — all of it versioned, reviewed, and stamped identically into dev and prod from the same code.
This lesson builds that plane end to end, both ways, because EKS gives you a real choice. On the AWS-native side you install the CloudWatch Observability EKS add-on — one aws_eks_addon that drops the CloudWatch agent and Fluent Bit onto every node and lights up Container Insights with almost no moving parts, at the cost of CloudWatch’s per-GB log bill. On the CNCF side you install kube-prometheus-stack with a single helm_release — the Prometheus Operator, Prometheus, Alertmanager, Grafana, node-exporter and kube-state-metrics in one shot — and get the full open-source metrics ecosystem, at the cost of running (and storing, and scaling) it yourself. Most real platforms run both: Container Insights for the AWS-integrated view and CloudWatch alarms, kube-prometheus-stack for rich dashboards and PromQL. You will build each, then see the managed middle path — Amazon Managed Prometheus and Amazon Managed Grafana — that keeps Prometheus’s ergonomics while handing the HA storage to AWS.
This is the provider-specific, Kubernetes-flavoured layer of the KloudVin Terraform course. It assumes you already know core Terraform — HCL, providers, resources, variables, state and modules — and that you have an EKS cluster to point at (built in the earlier EKS lessons). It applies Terraform to EKS observability relentlessly, with copy-pasteable .tf files and a terraform init → plan → apply → verify → destroy you actually run.
What you’ll build
The scenario is the one every platform team hits the week after the cluster goes live: a handful of services are running on EKS, and the on-call rotation needs to see them — CPU and memory per pod and per node, container logs searchable in one place, the golden signals (latency, traffic, errors, saturation) on a dashboard, and a page when any of it degrades, through the same channel in every environment, with no one clicking around a console. That means an agent on every node collecting metrics and logs, a metrics database scraping the apps, dashboards the team actually opens, alert rules that fire on user impact, and a single notification path — an SNS topic — that fans a firing alert out to email, Slack or a pager.
Every piece of that is a Terraform resource. The AWS-native collector is aws_eks_addon (amazon-cloudwatch-observability) with an IAM role built from aws_iam_role + aws_iam_openid_connect_provider (IRSA) or aws_eks_pod_identity_association; the retained logs are aws_cloudwatch_log_group; the CNCF stack is one helm_release of kube-prometheus-stack; its storage is a gp3 StorageClass on the EBS CSI driver; the sample app’s scrape target is a kubernetes_manifest ServiceMonitor; the managed stores are aws_prometheus_workspace (AMP) and aws_grafana_workspace (AMG); and the alert fan-out is aws_sns_topic wired to a CloudWatch alarm or an Alertmanager receiver. Wiring this by hand — eksctl here, helm install there, an IAM role clicked in the console — gives you a snowflake nobody can reproduce; wiring it in Terraform gives you the dependency graph, a plan that shows the exact diff, and a module you apply to the next cluster by changing one variable.
Why Terraform rather than helm install and the console? Because the observability plane is precisely the kind of cross-referencing, multi-service configuration that rewards code: the add-on’s IAM role references the cluster’s OIDC issuer, the Helm values reference the AMP remote_write endpoint, the ServiceMonitor’s labels must match the Prometheus the Helm release created, and the alarm references the SNS topic ARN. Terraform orders all of that and shows it to you before it happens. And when the cluster is rebuilt — as clusters are, for upgrades and blue-green swaps — the entire observability plane comes back identically instead of being re-clicked from memory.
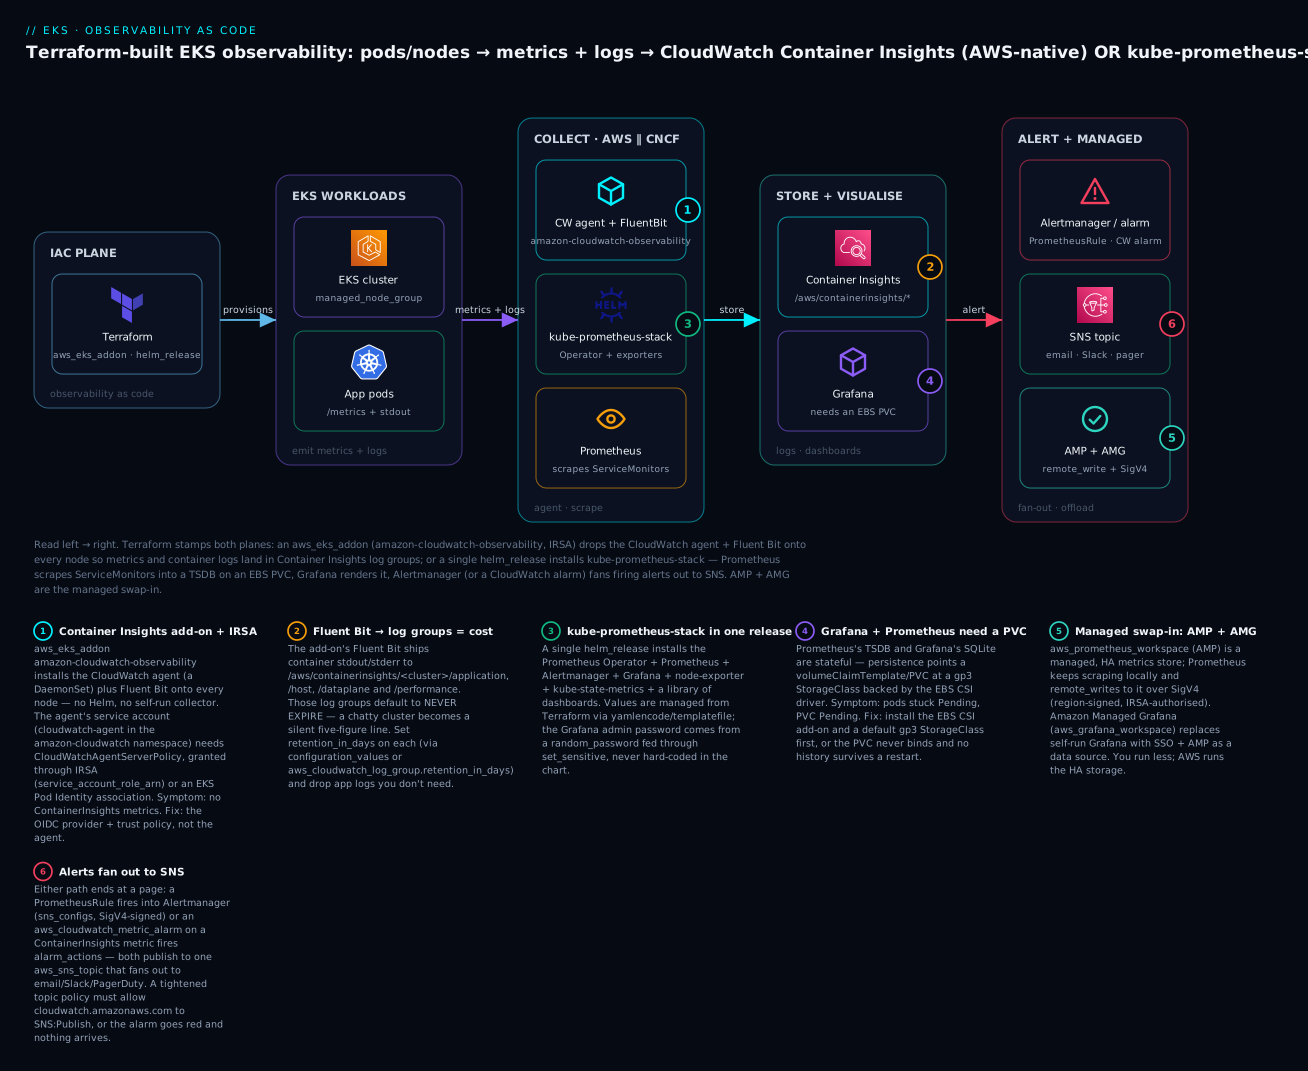
Reading that diagram left to right is reading the two paths you are about to build. Terraform provisions both planes onto the same EKS cluster whose pods and nodes emit metrics and logs. On the AWS-native path, the CloudWatch agent + Fluent Bit (installed by the add-on) push metrics and container logs into Container Insights log groups and the ContainerInsights metric namespace. On the CNCF path, kube-prometheus-stack installs Prometheus, which scrapes ServiceMonitor targets into a TSDB on an EBS PVC and feeds Grafana dashboards. Both paths end at alerting: a PrometheusRule through Alertmanager, or a CloudWatch alarm, publishes to an SNS topic that fans out to humans — while AMP + AMG stand ready as the managed swap-in that keeps Prometheus’s ergonomics without you running the storage.
Here is the full inventory a single run creates in the hands-on, and roughly what each part costs if you leave it running (ap-south-1 / Mumbai, on-demand, indicative July 2026):
| Resource (Terraform) | AWS / K8s object | Role in the build | Rough cost if left up |
|---|---|---|---|
aws_eks_addon (amazon-cloudwatch-observability) |
CloudWatch agent + Fluent Bit DaemonSet | AWS-native collector | metrics + logs billed by volume |
aws_iam_role + aws_iam_openid_connect_provider |
IRSA role for the agent | Lets the agent write to CloudWatch | free |
aws_cloudwatch_log_group ×4 |
Container Insights log groups | App/host/dataplane/performance logs | ⚠️ ingestion + storage |
helm_release (kube-prometheus-stack) |
Operator, Prometheus, Grafana, Alertmanager | CNCF stack | compute + EBS |
kubernetes_storage_class (gp3) |
StorageClass | Backs the PVCs (EBS CSI) | per-GB EBS |
| PVCs (Prometheus TSDB + Grafana) | gp3 EBS volumes (50Gi + 10Gi) |
Metric/dashboard persistence | ~₹500/mo (60 GB gp3) |
random_password + aws_secretsmanager_secret |
Grafana admin password | Secret, not hard-coded | ~₹35/mo per secret |
kubernetes_manifest (ServiceMonitor) |
Prometheus scrape target | Scrape the sample app | free |
aws_prometheus_workspace (optional) |
AMP workspace | Managed metrics store | per-sample ingest |
aws_grafana_workspace (optional) |
AMG workspace | Managed Grafana | ~$9/editor/mo |
aws_sns_topic + subscription |
Alert fan-out | Page on degradation | free at demo volume |
The EKS cluster itself (control plane $0.10/hr ≈ ₹6,000/mo, plus node EC2) is the standing cost and is assumed to already exist; what this lesson adds is the collector, the Helm stack and its EBS volumes, and the CloudWatch log bill — the two lines that actually move the needle. It is still a build it, verify it, destroy it lesson, and every costly or destructive step below is marked ⚠️.
Where this fits: the PVCs the Helm stack needs are backed by the gp3 StorageClass and the EBS CSI driver stood up in the EKS EBS CSI & storage classes lesson; exposing Grafana on a real hostname with TLS uses the ALB Ingress controller, ExternalDNS and ACM from the EKS Ingress with ALB, SSL & ExternalDNS lesson; and the CloudWatch alarms → SNS pattern the AWS-native path leans on is covered in depth (composite alarms, metric filters, treat_missing_data) in the CloudWatch alarms, dashboards & SNS lesson.
The three pillars on EKS, and the AWS-native vs CNCF choice
Observability is conventionally three pillars — metrics (numeric time-series: CPU, request rate, latency), logs (discrete events: an error line, an access log), and traces (the path of one request across services) — and EKS gives you a distinct set of tools for each, split down an AWS-native vs open-source line. Getting the mental model straight first saves you from bolting on the wrong tool later.
| Pillar | What it answers | AWS-native on EKS | CNCF on EKS |
|---|---|---|---|
| Metrics | “How much / how fast / how many?” | Container Insights (ContainerInsights namespace) |
Prometheus (scrape /metrics) |
| Logs | “What exactly happened?” | Fluent Bit → CloudWatch Logs | Fluent Bit/Fluentd → Loki/OpenSearch |
| Traces | “Where in the call graph?” | ADOT → X-Ray | ADOT/Tempo/Jaeger (OTLP) |
| Cluster health | “Is the control plane / kubelet OK?” | Container Insights + EKS control-plane logs | kube-state-metrics + node-exporter |
| Ad-hoc “what’s hot now?” | kubectl top |
metrics-server (Resource Metrics API) | metrics-server (same) |
Two clarifications that trip people up. First, kubectl top is not your monitoring system — it reads the lightweight Resource Metrics API served by metrics-server, which keeps only a few minutes of in-memory data to drive the HPA and top; it has no history and no alerting. It is a useful smoke test (and you install it as an add-on too), not a replacement for Container Insights or Prometheus. Second, the collector and the store are separate concerns: on the AWS path the CloudWatch agent + Fluent Bit collect and CloudWatch stores; on the CNCF path Prometheus both scrapes and stores (until you remote_write elsewhere). Confusing collector with store is why people ask “do I still need Prometheus if I have Fluent Bit?” — Fluent Bit is a log shipper, Prometheus is a metrics database; they are not alternatives.
Now the decision that shapes the whole build — Container Insights vs a self-run Prometheus stack:
| Dimension | CloudWatch Container Insights | kube-prometheus-stack (self-run) |
|---|---|---|
| Install | one aws_eks_addon |
one helm_release (bigger surface) |
| Who runs it | AWS (agent runs on your nodes) | you (Prometheus, Grafana, Alertmanager pods) |
| Query language | CloudWatch Metrics Insights / Logs Insights | PromQL (richer, portable) |
| Dashboards | CloudWatch dashboards | Grafana (huge community library) |
| Storage cost model | per-GB ingest + per-metric + retention | EBS volume for the TSDB (flat-ish) |
| Cardinality | expensive (custom metrics priced each) | cheap (labels are free-ish) |
| AWS integration | native (alarms, EventBridge, X-Ray) | via exporters / CloudWatch datasource |
| Portability | AWS-only | runs on any Kubernetes |
| Ops burden | near-zero | real (upgrades, storage, scaling) |
| Best for | AWS-centric teams, fast bring-up | metric-heavy teams, multi-cloud, PromQL |
There is no universally right answer, and the honest production pattern is both, scoped: Container Insights for cheap, no-ops cluster and node visibility plus CloudWatch alarms wired to the same SNS topic as everything else AWS; kube-prometheus-stack for application metrics, PromQL, rich Grafana dashboards and Alertmanager routing. The rest of this lesson builds each in turn so you can pick — or run both, which is what the hands-on does.
What actually emits the signals matters too, because a metric that no one produces cannot be scraped:
| Signal source | Emits | AWS path picks it up via | CNCF path picks it up via |
|---|---|---|---|
| Node kubelet/cAdvisor | node + container CPU/mem | CloudWatch agent | node-exporter is separate; cAdvisor via kubelet scrape |
| Kubernetes API objects | pod/deployment/PVC state | Container Insights (enhanced) | kube-state-metrics |
| The node OS | disk, network, load | CloudWatch agent | node-exporter (DaemonSet) |
| Your app | custom /metrics (RED signals) |
needs Prometheus-format → CW EMF | Prometheus scrape (native) |
| Container stdout/stderr | log lines | Fluent Bit → CloudWatch Logs | your log stack (Loki/OpenSearch) |
| EKS control plane | API/audit/authenticator logs | enabled_cluster_log_types → CloudWatch |
same (then scrape/parse) |
CloudWatch Container Insights: the observability EKS add-on
The AWS-native path is refreshingly small: one add-on. The CloudWatch Observability EKS add-on (amazon-cloudwatch-observability) installs the CloudWatch agent (as a DaemonSet, managed by a small operator) and Fluent Bit (also a DaemonSet) onto every node. The agent collects performance metrics and publishes them to the ContainerInsights CloudWatch namespace; Fluent Bit ships container logs to CloudWatch Logs. You get per-pod and per-node CPU/memory/network/disk, the Container Insights console maps, and (in enhanced mode) Kubernetes object state — without running a single collector pod yourself.
resource "aws_eks_addon" "cloudwatch_observability" {
  cluster_name  = data.aws_eks_cluster.this.name
  addon_name    = "amazon-cloudwatch-observability"
  addon_version = "v4.4.0-eksbuild.1"   # pin; list with `aws eks describe-addon-versions`

  # IRSA: the agent's service account assumes this role
  service_account_role_arn = aws_iam_role.cw_agent.arn

  resolve_conflicts_on_create = "OVERWRITE"
  resolve_conflicts_on_update = "PRESERVE"

  configuration_values = jsonencode({
    containerLogs = { enabled = true }
    agent = {
      config = {
        logs = {
          metrics_collected = {
            kubernetes = { enhanced_container_insights = true }
          }
        }
      }
    }
  })

  tags = local.tags
}
The add-on’s arguments are the same shape as any EKS add-on, with the observability specifics in configuration_values:
aws_eks_addon argument |
Purpose | Note |
|---|---|---|
cluster_name |
Which cluster to install into | from the cluster resource/data source |
addon_name |
amazon-cloudwatch-observability |
exact string |
addon_version |
Pin the add-on version | list with aws eks describe-addon-versions --addon-name ... |
service_account_role_arn |
IRSA role the agent SA assumes | or use pod_identity_association |
pod_identity_association |
{ role_arn, service_account } block |
the newer alternative to IRSA |
resolve_conflicts_on_create |
OVERWRITE / NONE |
how to handle pre-existing objects |
resolve_conflicts_on_update |
PRESERVE / OVERWRITE / NONE |
PRESERVE keeps your field edits on upgrade |
configuration_values |
JSON of chart values | enable/disable container logs, enhanced insights, retention |
preserve |
Keep add-on objects on destroy |
usually false for a lab |
The one non-trivial dependency is permissions, because the agent needs to write to CloudWatch and it runs as a pod, which means a pod-scoped credential — either IRSA (IAM Roles for Service Accounts, the OIDC-federation classic) or EKS Pod Identity (the newer association-based model). Both attach the AWS-managed CloudWatchAgentServerPolicy to a role and bind it to the add-on’s service account (cloudwatch-agent in the amazon-cloudwatch namespace).
| IRSA | EKS Pod Identity | |
|---|---|---|
| Trust principal | Federated = cluster OIDC provider |
Service = pods.eks.amazonaws.com |
| Cluster prerequisite | aws_iam_openid_connect_provider for the cluster |
eks-pod-identity-agent add-on |
| Binds SA→role via | trust-policy :sub condition on the SA |
aws_eks_pod_identity_association |
| Reusable across clusters | no (issuer is per-cluster) | yes (no issuer in the trust) |
| Terraform resources | role + OIDC provider + policy attach | role + association + policy attach |
| Wire into the add-on | service_account_role_arn |
pod_identity_association {} |
Here is the IRSA wiring — the OIDC provider (one per cluster) and a role whose trust policy only lets the agent’s service account assume it:
# 1) Register the cluster's OIDC issuer as an IAM identity provider (once per cluster)
data "tls_certificate" "oidc" {
  url = data.aws_eks_cluster.this.identity[0].oidc[0].issuer
}

resource "aws_iam_openid_connect_provider" "oidc" {
  url             = data.aws_eks_cluster.this.identity[0].oidc[0].issuer
  client_id_list  = ["sts.amazonaws.com"]
  thumbprint_list = [data.tls_certificate.oidc.certificates[0].sha1_fingerprint]
}

# 2) Trust policy: only cloudwatch-agent in amazon-cloudwatch may assume this role
data "aws_iam_policy_document" "cw_agent_assume" {
  statement {
    effect  = "Allow"
    actions = ["sts:AssumeRoleWithWebIdentity"]
    principals {
      type        = "Federated"
      identifiers = [aws_iam_openid_connect_provider.oidc.arn]
    }
    condition {
      test     = "StringEquals"
      variable = "${replace(aws_iam_openid_connect_provider.oidc.url, "https://", "")}:sub"
      values   = ["system:serviceaccount:amazon-cloudwatch:cloudwatch-agent"]
    }
    condition {
      test     = "StringEquals"
      variable = "${replace(aws_iam_openid_connect_provider.oidc.url, "https://", "")}:aud"
      values   = ["sts.amazonaws.com"]
    }
  }
}

resource "aws_iam_role" "cw_agent" {
  name               = "${var.cluster_name}-cw-agent"
  assume_role_policy = data.aws_iam_policy_document.cw_agent_assume.json
}

resource "aws_iam_role_policy_attachment" "cw_agent" {
  role       = aws_iam_role.cw_agent.name
  policy_arn = "arn:aws:iam::aws:policy/CloudWatchAgentServerPolicy"
}
The trust policy is where every “the agent runs but no metrics appear” bug lives, so read it carefully. The two condition blocks are load-bearing: the :sub condition pins the exact service account (amazon-cloudwatch:cloudwatch-agent) so no other pod can borrow the role, and the :aud condition (sts.amazonaws.com) is required by the EKS OIDC flow — omit it and STS refuses the token exchange. If you would rather not manage an OIDC provider per cluster, the Pod Identity alternative drops it entirely:
resource "aws_eks_pod_identity_association" "cw_agent" {
  cluster_name    = data.aws_eks_cluster.this.name
  namespace       = "amazon-cloudwatch"
  service_account = "cloudwatch-agent"
  role_arn        = aws_iam_role.cw_agent.arn   # trust: pods.eks.amazonaws.com
}
with the role’s trust policy targeting the pods.eks.amazonaws.com service principal (sts:AssumeRole + sts:TagSession) and the eks-pod-identity-agent add-on installed on the cluster.
Where the signals land. The add-on creates and writes to a fixed set of log groups and one metric namespace. This is the map you keep next to you when something is missing:
| Destination | Content | Kind |
|---|---|---|
/aws/containerinsights/<cluster>/performance |
agent perf metrics (embedded metric format) | Logs → metrics |
/aws/containerinsights/<cluster>/application |
container stdout/stderr (Fluent Bit) | Logs |
/aws/containerinsights/<cluster>/host |
node system logs (/var/log/*) |
Logs |
/aws/containerinsights/<cluster>/dataplane |
kubelet, kube-proxy, CNI logs | Logs |
ContainerInsights (metric namespace) |
pod_cpu_utilization, node_filesystem_utilization, … |
Metrics |
And these are the metrics you actually alarm on — a small, high-value subset of the ContainerInsights namespace:
| Metric | Dimension(s) | Alarm on |
|---|---|---|
node_cpu_utilization |
ClusterName, NodeName |
node saturation ≥ 80% |
node_filesystem_utilization |
ClusterName, NodeName |
disk ≥ 85% (nodes go NotReady) |
pod_cpu_utilization |
ClusterName, Namespace, PodName |
runaway pod |
pod_memory_utilization |
ClusterName, Namespace |
OOM risk ≥ 90% |
pod_number_of_container_restarts |
ClusterName, Namespace |
crash-looping ≥ 1 |
cluster_failed_node_count |
ClusterName |
≥ 1 node failed |
namespace_number_of_running_pods |
ClusterName, Namespace |
capacity/scheduling |
The ⚠️ retention cost. Fluent Bit is a firehose — a chatty cluster can push tens of GB a day of container logs — and the log groups the add-on creates default to never expire, which is the single most common surprise line on an EKS CloudWatch bill. The add-on manages the log-group creation, so the clean fix is either a retention_in_days in the add-on configuration_values, or you pre-create the groups with retention set (and let the add-on adopt them):
retention_in_days |
Fits | Why |
|---|---|---|
7 / 14 |
dev/staging container logs | you rarely read week-old debug logs |
30 / 90 |
prod application logs | incident review window |
1 / 3 |
high-volume performance logs | metrics are already extracted from them |
0 / unset |
forever — almost never wanted | silent, unbounded storage bill |
CloudWatch Logs bills on ingestion (~$0.50/GB, ~half for the Infrequent Access class), storage (~$0.03/GB-month), and Logs Insights analysis (scan-billed). Container Insights metrics are custom metrics (priced each). On a busy cluster the two levers that matter are turning off container-log collection you do not need (containerLogs.enabled = false, or scope it) and setting retention — both one-line decisions in Terraform, invisible in the console until the bill.
The CNCF stack: kube-prometheus-stack via helm_release
The open-source path installs the whole Prometheus ecosystem in one Helm chart. kube-prometheus-stack (from the prometheus-community repo) bundles the Prometheus Operator (which turns ServiceMonitor/PodMonitor/PrometheusRule custom resources into Prometheus config), Prometheus itself, Alertmanager, Grafana (pre-wired with a large library of cluster dashboards), node-exporter (a DaemonSet for machine metrics) and kube-state-metrics (cluster object state) — the complete stack, in one helm_release.
resource "helm_release" "kps" {
  name             = "kps"
  repository       = "https://prometheus-community.github.io/helm-charts"
  chart            = "kube-prometheus-stack"
  version          = "65.5.1"                # ⚠️ pin the chart version
  namespace        = "monitoring"
  create_namespace = true
  timeout          = 600                     # CRDs + many objects; give it room

  values = [templatefile("${path.module}/values/kps.yaml.tftpl", {
    storage_class   = var.storage_class      # gp3 from the EBS CSI lesson
    prom_pvc_size   = "50Gi"
    grafana_pvc     = "10Gi"
    amp_remote_write = var.amp_remote_write_url  # "" = disabled
    aws_region      = var.region
  })]

  # Secret value never goes through the values file / state as plaintext-in-template
  set_sensitive {
    name  = "grafana.adminPassword"
    value = random_password.grafana.result
  }
}
The chart’s own arguments on helm_release are the release plumbing; the content lives in values:
helm_release argument |
Purpose | Note |
|---|---|---|
name |
Release name | becomes the object prefix (kps-...) and the release label |
repository / chart |
Where the chart comes from | prometheus-community / kube-prometheus-stack |
version |
Chart version pin | always pin — un-pinned = surprise upgrade on every apply |
namespace / create_namespace |
Target namespace | monitoring by convention |
values |
List of YAML value docs | templatefile/yamlencode — the main config surface |
set / set_sensitive |
Individual overrides | set_sensitive for secrets (kept out of plan output) |
timeout |
Seconds to wait for readiness | raise it — the stack is large |
atomic |
Roll back the release on failure | good for CI; leaves nothing half-installed |
wait / wait_for_jobs |
Block until resources are Ready | default true; needed before dependents |
Managing Helm values from Terraform is its own small discipline, because a real values file is dozens of nested keys and you want it templated, reviewable and secret-safe. Three techniques, and when each wins:
| Technique | Looks like | Use when |
|---|---|---|
set { name value } |
one scalar per block | a handful of overrides; simple scalars |
values = [yamlencode({...})] |
HCL map → YAML | values computed from Terraform (endpoints, ARNs) |
values = [templatefile("f.yaml.tftpl", {...})] |
external YAML + ${vars} |
large values files kept lint-able as real YAML |
set_sensitive { } |
scalar, redacted in plan | secrets (Grafana password, tokens) |
Keep the big, static structure in a templatefile YAML you can lint and diff; inject the few Terraform-computed values (the StorageClass name, the AMP endpoint) as template variables; and route any secret through set_sensitive so it never appears in plan output or the values file. The template (values/kps.yaml.tftpl) carries the values that make the stack production-shaped — persistence, scrape scope, and remote-write:
# values/kps.yaml.tftpl  (rendered by templatefile)
grafana:
  persistence:
    enabled: true
    storageClassName: ${storage_class}
    size: ${grafana_pvc}
  service:
    type: ClusterIP            # exposed via Ingress, not a LoadBalancer per pod
prometheus:
  prometheusSpec:
    retention: 15d
    # Honour ServiceMonitors/PodMonitors in ALL namespaces, not only labelled ones
    serviceMonitorSelectorNilUsesHelmValues: false
    podMonitorSelectorNilUsesHelmValues: false
    ruleSelectorNilUsesHelmValues: false
    storageSpec:
      volumeClaimTemplate:
        spec:
          storageClassName: ${storage_class}
          accessModes: ["ReadWriteOnce"]
          resources:
            requests:
              storage: ${prom_pvc_size}
%{ if amp_remote_write != "" ~}
    remoteWrite:
      - url: ${amp_remote_write}
        sigv4:
          region: ${aws_region}
%{ endif ~}
alertmanager:
  alertmanagerSpec:
    storage:
      volumeClaimTemplate:
        spec:
          storageClassName: ${storage_class}
          accessModes: ["ReadWriteOnce"]
          resources:
            requests:
              storage: 5Gi
The values worth knowing by name, because these are the ones you tune on every real install:
| Values key | Controls | Default gotcha |
|---|---|---|
prometheus.prometheusSpec.retention |
how long Prometheus keeps data | default 10d; size the PVC to match |
...storageSpec.volumeClaimTemplate |
the TSDB PVC (EBS) | omit and Prometheus is emptyDir — data lost on restart |
...serviceMonitorSelectorNilUsesHelmValues |
scope of ServiceMonitors honoured | true (default) = only the chart’s own; set false to scrape yours |
...ruleSelectorNilUsesHelmValues |
scope of PrometheusRules honoured | same trap as above |
...remoteWrite |
ship samples to AMP/Thanos | sigv4.region for AMP; needs IRSA on the Prometheus SA |
grafana.adminPassword |
Grafana login | set via set_sensitive, never in the file |
grafana.persistence |
Grafana PVC | without it, dashboards/settings reset on pod restart |
grafana.ingress |
expose Grafana | wire to ALB + ExternalDNS (below) |
alertmanager.config |
routing/receivers | where the SNS receiver goes |
nodeExporter.enabled / kubeStateMetrics.enabled |
the two exporters | leave on; they are the cluster metrics |
Persistence is not optional, and it ties straight to the EBS CSI driver. Prometheus’s TSDB and Grafana’s state are stateful; the volumeClaimTemplate/persistence blocks above create PersistentVolumeClaims that a StorageClass must satisfy. On EKS that StorageClass is gp3 backed by the EBS CSI driver — and if the driver is not installed, or there is no default gp3 StorageClass, the PVCs sit Pending forever and the Prometheus and Grafana pods never start.
| Requirement | Resource | Failure if missing |
|---|---|---|
| EBS CSI driver | aws_eks_addon aws-ebs-csi-driver (+ IRSA) |
PVC Pending — no provisioner |
A gp3 StorageClass |
kubernetes_storage_class (or the driver’s default) |
PVC Pending — no class matches |
WaitForFirstConsumer binding |
StorageClass volumeBindingMode |
volume created in the wrong AZ from the pod |
| Right access mode | ReadWriteOnce (EBS is single-node) |
multi-attach errors if RWX requested |
The gp3 StorageClass and the EBS CSI add-on are exactly what the EKS EBS CSI & storage classes lesson builds — this lesson assumes they exist and simply names the class in the values.
Scraping and ServiceMonitors. You do not hand-edit prometheus.yml; you create a ServiceMonitor and the Operator generates the scrape config. The one rule that catches everyone is two-level selection: the Prometheus resource has a serviceMonitorSelector (which we set to honour all monitors via the ...NilUsesHelmValues: false values), and each ServiceMonitor selects the Services it scrapes. A ServiceMonitor whose labels no Prometheus selects is silently ignored. Here is one for a sample app, authored as a Terraform-managed manifest:
resource "kubernetes_manifest" "sample_servicemonitor" {
  manifest = {
    apiVersion = "monitoring.coreos.com/v1"
    kind       = "ServiceMonitor"
    metadata = {
      name      = "sample-app"
      namespace = "monitoring"
      labels    = { release = "kps" }   # match the Prometheus serviceMonitorSelector
    }
    spec = {
      selector      = { matchLabels = { app = "sample-app" } }
      namespaceSelector = { matchNames = ["demo"] }
      endpoints = [{
        port     = "metrics"   # the Service port NAME, never a number
        path     = "/metrics"
        interval = "15s"
      }]
    }
  }
  depends_on = [helm_release.kps]   # CRDs must exist before this manifest
}
| ServiceMonitor field | Meaning | Common mistake |
|---|---|---|
metadata.labels.release |
must match Prometheus serviceMonitorSelector |
wrong/absent → silently not scraped |
spec.selector.matchLabels |
which Services to scrape | must match the Service’s labels, not the pod’s |
spec.namespaceSelector |
which namespaces to look in | app in another namespace than the monitor |
spec.endpoints[].port |
the Service port name | using a number instead of the name |
spec.endpoints[].path |
metrics path | app serves /metrics on a different path |
spec.endpoints[].interval |
scrape interval | too tight = load; too loose = blind spots |
Exposing Grafana is the last mile, and on EKS the idiomatic path is an Ingress handled by the AWS Load Balancer Controller, with ExternalDNS creating the Route 53 record and ACM terminating TLS on the ALB — exactly the machinery from the EKS Ingress with ALB, SSL & ExternalDNS lesson. You turn it on in the Grafana values:
| Exposure option | How | When |
|---|---|---|
port-forward |
kubectl port-forward svc/kps-grafana 3000:80 |
dev/verify only — no auth exposure |
Service type LoadBalancer |
one NLB/ALB per service | quick, but a public LB per app is wasteful |
Ingress (ALB) + ExternalDNS + ACM |
grafana.ingress values → one shared ALB, DNS, TLS |
production — hostname + HTTPS |
| Amazon Managed Grafana | aws_grafana_workspace (no Ingress at all) |
offload Grafana entirely (below) |
Managed metrics: Amazon Managed Prometheus and Grafana
Running Prometheus and Grafana yourself means owning their storage, HA and scaling — real work at real scale. The managed middle path keeps Prometheus’s ergonomics (PromQL, the exposition format, ServiceMonitors) while handing the hard parts to AWS. Amazon Managed Service for Prometheus (AMP) is a managed, horizontally-scaling Prometheus-compatible store; your in-cluster Prometheus keeps scraping but remote_writes the samples to it. Amazon Managed Grafana (AMG) is managed Grafana with SSO, using AMP (or CloudWatch, or X-Ray) as a data source.
# AMP: a managed metrics workspace
resource "aws_prometheus_workspace" "this" {
  alias = "${var.cluster_name}-metrics"
  tags  = local.tags
}

# AMG: a managed Grafana workspace (IAM Identity Center auth)
resource "aws_grafana_workspace" "this" {
  name                     = "${var.cluster_name}-grafana"
  account_access_type      = "CURRENT_ACCOUNT"
  authentication_providers = ["AWS_SSO"]
  permission_type          = "SERVICE_MANAGED"
  data_sources             = ["PROMETHEUS", "CLOUDWATCH", "XRAY"]
  role_arn                 = aws_iam_role.grafana.arn
}

output "amp_remote_write_url" {
  value = "${aws_prometheus_workspace.this.prometheus_endpoint}api/v1/remote_write"
}
The amp_remote_write_url output is what you feed into the Helm values’ remoteWrite.url (shown earlier) — the in-cluster Prometheus then signs each write request with SigV4 (region-scoped, using the Prometheus service account’s IRSA role, which needs aps:RemoteWrite). The three AMP resources and what they hold:
| AMP resource | Holds | Note |
|---|---|---|
aws_prometheus_workspace |
the tenant + ingest/query endpoints | prometheus_endpoint output → append api/v1/remote_write |
aws_prometheus_rule_group_namespace |
recording + alerting rules (YAML) | same PromQL rules you’d run locally |
aws_prometheus_alert_manager_definition |
Alertmanager routing (YAML) | SNS/webhook receivers, managed |
aws_prometheus_scraper (optional) |
AWS-managed collector for EKS | scrapes your cluster so you run no Prometheus |
The full self-vs-managed decision, the table you actually make the call from:
| Dimension | Self-run (kube-prometheus-stack) | Managed (AMP + AMG) |
|---|---|---|
| Who runs Prometheus | you (pods, PVCs, upgrades) | AWS (you keep only a scraper, or remote_write) |
| Who runs Grafana | you | AWS (AMG) with SSO |
| HA / scaling | your problem (sharding, Thanos) | built-in, horizontal |
| Cost model | EC2 + EBS (flat-ish) | per-sample ingested + per-query + AMG per-editor |
| Query language | PromQL | PromQL (identical) |
| Long-term storage | you add Thanos/Cortex | native, AWS-managed retention |
| Auth | you wire OIDC/Grafana | IAM Identity Center (SSO) out of the box |
| Lock-in | none (portable) | AWS-specific endpoints/IAM |
| Best for | full control, cost-flat at scale | small teams, no-ops, spiky cardinality you’d rather not host |
The pragmatic middle that many teams land on: run kube-prometheus-stack for scraping and Grafana dashboards, but remote_write to AMP for durable, HA long-term storage — you keep the rich local experience and offload the storage you least want to operate. AMG then reads AMP for the dashboards leadership looks at, with SSO you didn’t have to build.
Traces, and alerting to SNS
Traces are the third pillar, and on EKS the collector is ADOT — the AWS Distro for OpenTelemetry — available as its own EKS add-on (adot) or run as an OpenTelemetry Collector you deploy. Apps emit OTLP spans; the collector batches and exports them to X-Ray (AWS-native) or to Tempo/Jaeger (CNCF), and can also export OTLP metrics to AMP — one collector, all three pillars. It is a lesson of its own; the shape to remember:
| Traces piece | Resource / object | Exports to |
|---|---|---|
| ADOT add-on | aws_eks_addon adot (needs cert-manager) |
— |
| OTel Collector | helm_release / kubernetes_manifest |
X-Ray, AMP, Tempo |
| App instrumentation | OTLP SDK / auto-instrumentation | the collector |
| Sampling | collector config (tail_sampling) |
controls trace cost |
Alerting is where both paths converge on the same SNS topic, and the SNS + alarm mechanics (composite alarms, treat_missing_data, topic policy) are covered in depth in the CloudWatch alarms & SNS lesson. The two ways an EKS alert reaches a human:
| Path | Rule lives in | Fires via | Terraform |
|---|---|---|---|
| AWS-native | aws_cloudwatch_metric_alarm on a ContainerInsights metric |
alarm_actions → SNS |
alarm + topic + policy |
| CNCF | PrometheusRule (PromQL) → Alertmanager |
Alertmanager sns_configs (SigV4) |
kubernetes_manifest rule + values |
A CloudWatch alarm on the AWS path is the exact same resource you already know, just pointed at a Container Insights metric:
resource "aws_cloudwatch_metric_alarm" "node_disk" {
  alarm_name          = "${var.cluster_name}-node-disk-high"
  namespace           = "ContainerInsights"
  metric_name         = "node_filesystem_utilization"
  statistic           = "Maximum"
  period              = 60
  evaluation_periods  = 5
  datapoints_to_alarm = 3
  threshold           = 85
  comparison_operator = "GreaterThanOrEqualToThreshold"
  treat_missing_data  = "breaching"          # a silent node metric IS the failure
  dimensions          = { ClusterName = var.cluster_name }
  alarm_actions       = [aws_sns_topic.alerts.arn]
  ok_actions          = [aws_sns_topic.alerts.arn]
}
On the CNCF side, a PrometheusRule expresses the same intent in PromQL and Alertmanager routes it — to Slack, PagerDuty, or SNS via sns_configs (which signs with SigV4 using the Alertmanager pod’s IRSA role and sns:Publish). The kube-prometheus-stack chart ships a broad default rule set (node pressure, pod crash-loops, PVC filling, API latency) out of the box, so you get meaningful alerts on install and add your app-specific PrometheusRules on top.
Hands-on: build it with Terraform
Now the centrepiece — a complete, self-contained configuration you run end to end against a pre-existing EKS cluster. It builds both paths so you can compare them: the AWS-native Container Insights add-on (with its IRSA role), and the CNCF kube-prometheus-stack (with EBS-backed persistence, a Grafana password from random_password, a ServiceMonitor scraping a sample app, and a Grafana dashboard). You will apply, verify with kubectl top and by opening Grafana, then destroy. ⚠️ This creates EBS volumes and CloudWatch log ingestion — do the whole loop in one sitting.
Prerequisites. An EKS cluster you can reach (aws eks update-kubeconfig --name <cluster> works and kubectl get nodes returns nodes), the EBS CSI driver add-on installed with a gp3 StorageClass (from the EBS CSI lesson), and metrics-server (for kubectl top). We read the cluster as data sources, so this config never risks the cluster itself.
Step 0 — layout.
eks-observability/
├── versions.tf
├── variables.tf
├── providers.tf
├── cloudwatch-addon.tf     # AWS-native path
├── kube-prometheus.tf      # CNCF path
├── sample-app.tf           # a scrape target + ServiceMonitor
├── alerts.tf               # SNS + a CloudWatch alarm
├── outputs.tf
├── values/kps.yaml.tftpl
└── terraform.tfvars
Step 1 — versions.tf (pins; the helm/kubernetes versions match the rest of the course).
terraform {
  required_version = ">= 1.6"
  required_providers {
    aws        = { source = "hashicorp/aws",        version = "~> 5.60" }
    helm       = { source = "hashicorp/helm",       version = "~> 2.17" }
    kubernetes = { source = "hashicorp/kubernetes", version = "~> 2.35" }
    tls        = { source = "hashicorp/tls",        version = "~> 4.0" }
    random     = { source = "hashicorp/random",     version = "~> 3.6" }
  }
  backend "s3" {
    bucket         = "kloudvin-tfstate-apsouth1"
    key            = "labs/eks-observability/terraform.tfstate"
    region         = "ap-south-1"
    dynamodb_table = "kloudvin-tf-locks"
    encrypt        = true
  }
}
Step 2 — variables.tf.
variable "region"        {
  type = string
  default = "ap-south-1"
}
variable "cluster_name"  { type = string }                         # your EKS cluster
variable "storage_class" {                                         # from the EBS CSI lesson
  type    = string
  default = "gp3"
}
variable "alarm_email"   { type = string }                         # SNS confirmation target
variable "amp_remote_write_url" {                                  # "" disables remote_write
  type    = string
  default = ""
}
Step 3 — providers.tf (the EKS auth chain — the exec block gets a fresh token via aws eks get-token).
provider "aws" {
  region = var.region
  default_tags { tags = local.tags }
}

locals {
  tags = { Project = "eks-obs", ManagedBy = "Terraform", Lesson = "eks-observability" }
}

data "aws_eks_cluster" "this"      { name = var.cluster_name }
data "aws_eks_cluster_auth" "this" { name = var.cluster_name }

provider "kubernetes" {
  host                   = data.aws_eks_cluster.this.endpoint
  cluster_ca_certificate = base64decode(data.aws_eks_cluster.this.certificate_authority[0].data)
  exec {
    api_version = "client.authentication.k8s.io/v1beta1"
    command     = "aws"
    args        = ["eks", "get-token", "--cluster-name", data.aws_eks_cluster.this.name]
  }
}

provider "helm" {
  kubernetes {
    host                   = data.aws_eks_cluster.this.endpoint
    cluster_ca_certificate = base64decode(data.aws_eks_cluster.this.certificate_authority[0].data)
    exec {
      api_version = "client.authentication.k8s.io/v1beta1"
      command     = "aws"
      args        = ["eks", "get-token", "--cluster-name", data.aws_eks_cluster.this.name]
    }
  }
}
⚠️ helm provider version note: the nested
kubernetes { ... }block shown is thehelm2.x syntax the rest of this course uses. Thehelm3.x provider (2025) flattens this — if you pin~> 3.0, move the connection settings to the provider’s top level and switchset/set_sensitiveblocks to the newset = [{...}]form. Both run identically on OpenTofu.
Step 4 — cloudwatch-addon.tf (the AWS-native path: OIDC provider + IRSA role + the add-on).
data "tls_certificate" "oidc" {
  url = data.aws_eks_cluster.this.identity[0].oidc[0].issuer
}

resource "aws_iam_openid_connect_provider" "oidc" {
  url             = data.aws_eks_cluster.this.identity[0].oidc[0].issuer
  client_id_list  = ["sts.amazonaws.com"]
  thumbprint_list = [data.tls_certificate.oidc.certificates[0].sha1_fingerprint]
}

data "aws_iam_policy_document" "cw_agent_assume" {
  statement {
    effect  = "Allow"
    actions = ["sts:AssumeRoleWithWebIdentity"]
    principals {
      type        = "Federated"
      identifiers = [aws_iam_openid_connect_provider.oidc.arn]
    }
    condition {
      test     = "StringEquals"
      variable = "${replace(aws_iam_openid_connect_provider.oidc.url, "https://", "")}:sub"
      values   = ["system:serviceaccount:amazon-cloudwatch:cloudwatch-agent"]
    }
    condition {
      test     = "StringEquals"
      variable = "${replace(aws_iam_openid_connect_provider.oidc.url, "https://", "")}:aud"
      values   = ["sts.amazonaws.com"]
    }
  }
}

resource "aws_iam_role" "cw_agent" {
  name               = "${var.cluster_name}-cw-agent"
  assume_role_policy = data.aws_iam_policy_document.cw_agent_assume.json
}

resource "aws_iam_role_policy_attachment" "cw_agent" {
  role       = aws_iam_role.cw_agent.name
  policy_arn = "arn:aws:iam::aws:policy/CloudWatchAgentServerPolicy"
}

resource "aws_eks_addon" "cloudwatch_observability" {
  cluster_name                = var.cluster_name
  addon_name                  = "amazon-cloudwatch-observability"
  service_account_role_arn    = aws_iam_role.cw_agent.arn
  resolve_conflicts_on_create = "OVERWRITE"
  resolve_conflicts_on_update = "PRESERVE"

  configuration_values = jsonencode({
    containerLogs = { enabled = true }
    agent = { config = { logs = { metrics_collected = {
      kubernetes = { enhanced_container_insights = true }
    } } } }
  })

  depends_on = [aws_iam_role_policy_attachment.cw_agent]
}

# Cap the log bill: set retention on the groups the add-on writes to
resource "aws_cloudwatch_log_group" "ci" {
  for_each          = toset(["application", "host", "dataplane", "performance"])
  name              = "/aws/containerinsights/${var.cluster_name}/${each.key}"
  retention_in_days = 14
}
Step 5 — kube-prometheus.tf (the CNCF path: a Grafana password secret + the Helm release).
resource "random_password" "grafana" {
  length  = 20
  special = true
}

resource "aws_secretsmanager_secret" "grafana" {
  name = "${var.cluster_name}/grafana-admin"
}

resource "aws_secretsmanager_secret_version" "grafana" {
  secret_id     = aws_secretsmanager_secret.grafana.id
  secret_string = random_password.grafana.result
}

resource "helm_release" "kps" {
  name             = "kps"
  repository       = "https://prometheus-community.github.io/helm-charts"
  chart            = "kube-prometheus-stack"
  version          = "65.5.1"
  namespace        = "monitoring"
  create_namespace = true
  timeout          = 600
  atomic           = true

  values = [templatefile("${path.module}/values/kps.yaml.tftpl", {
    storage_class    = var.storage_class
    prom_pvc_size    = "50Gi"
    grafana_pvc      = "10Gi"
    amp_remote_write = var.amp_remote_write_url
    aws_region       = var.region
  })]

  set_sensitive {
    name  = "grafana.adminPassword"
    value = random_password.grafana.result
  }
}
with values/kps.yaml.tftpl exactly as shown in the CNCF section above.
Step 6 — sample-app.tf (a Deployment + Service that exposes /metrics, plus a ServiceMonitor scraping it and a Grafana dashboard). The app is prom/prometheus’s own demo target — any image exposing /metrics works; here we use a tiny instrumented sample.
resource "kubernetes_namespace" "demo" {
  metadata { name = "demo" }
}

resource "kubernetes_deployment" "sample" {
  metadata{
    name = "sample-app"
    namespace = kubernetes_namespace.demo.metadata[0].name
  }
  spec {
    replicas = 2
    selector { match_labels = { app = "sample-app" } }
    template {
      metadata { labels = { app = "sample-app" } }
      spec {
        container {
          name  = "app"
          image = "ghcr.io/stefanprodan/podinfo:6.7.1"   # exposes /metrics on 9797
          port{
            name = "metrics"
            container_port = 9797
          }
        }
      }
    }
  }
}

resource "kubernetes_service" "sample" {
  metadata {
    name      = "sample-app"
    namespace = kubernetes_namespace.demo.metadata[0].name
    labels    = { app = "sample-app" }
  }
  spec {
    selector = { app = "sample-app" }
    port{
      name = "metrics"
      port = 9797
      target_port = "metrics"
    }
  }
}

resource "kubernetes_manifest" "sample_servicemonitor" {
  manifest = {
    apiVersion = "monitoring.coreos.com/v1"
    kind       = "ServiceMonitor"
    metadata   = { name = "sample-app", namespace = "monitoring", labels = { release = "kps" } }
    spec = {
      selector          = { matchLabels = { app = "sample-app" } }
      namespaceSelector = { matchNames = ["demo"] }
      endpoints         = [{ port = "metrics", path = "/metrics", interval = "15s" }]
    }
  }
  depends_on = [helm_release.kps]
}

# A minimal Grafana dashboard, provisioned via the sidecar ConfigMap convention
resource "kubernetes_config_map" "dashboard" {
  metadata {
    name      = "sample-app-dashboard"
    namespace = "monitoring"
    labels    = { grafana_dashboard = "1" }   # the Grafana sidecar imports these
  }
  data = {
    "sample-app.json" = file("${path.module}/dashboards/sample-app.json")
  }
  depends_on = [helm_release.kps]
}
Step 7 — alerts.tf (one SNS topic + email subscription + a Container Insights alarm).
resource "aws_sns_topic" "alerts" { name = "${var.cluster_name}-obs-alerts" }

resource "aws_sns_topic_subscription" "email" {
  topic_arn = aws_sns_topic.alerts.arn
  protocol  = "email"
  endpoint  = var.alarm_email          # confirmed OUT OF BAND (Terraform can't)
}

resource "aws_cloudwatch_metric_alarm" "pod_restarts" {
  alarm_name          = "${var.cluster_name}-pod-restarts"
  namespace           = "ContainerInsights"
  metric_name         = "pod_number_of_container_restarts"
  statistic           = "Sum"
  period              = 300
  evaluation_periods  = 1
  threshold           = 5
  comparison_operator = "GreaterThanOrEqualToThreshold"
  treat_missing_data  = "notBreaching"
  dimensions          = { ClusterName = var.cluster_name, Namespace = "demo" }
  alarm_actions       = [aws_sns_topic.alerts.arn]
  depends_on          = [aws_eks_addon.cloudwatch_observability]
}
Step 8 — outputs.tf.
output "grafana_admin_secret" { value = aws_secretsmanager_secret.grafana.name }
output "cw_agent_role_arn"    { value = aws_iam_role.cw_agent.arn }
output "sns_topic_arn"        { value = aws_sns_topic.alerts.arn }
output "container_insights_url" {
  value = "https://${var.region}.console.aws.amazon.com/cloudwatch/home?region=${var.region}#container-insights:infrastructure"
}
Step 9 — init and plan. Put your values in terraform.tfvars (cluster_name, alarm_email), then:
terraform init
terraform plan -out tf.plan
Representative tail:
Plan: 21 to add, 0 to change, 0 to destroy.

Changes to Outputs:
  + cw_agent_role_arn      = (known after apply)
  + grafana_admin_secret   = "<cluster>/grafana-admin"
  + sns_topic_arn          = (known after apply)
Step 10 — apply. ⚠️ Creates the IRSA role, the add-on (agent + Fluent Bit on every node), the Helm stack with EBS PVCs, the sample app, and the SNS topic.
terraform apply tf.plan
# helm_release.kps: Still creating... [3m00s elapsed]
# helm_release.kps: Creation complete after 3m40s
Step 11 — confirm the SNS email subscription (the step Terraform can’t do). Click Confirm subscription in the “AWS Notification” email, then verify:
aws sns list-subscriptions-by-topic --topic-arn "$(terraform output -raw sns_topic_arn)" \
  --query 'Subscriptions[].SubscriptionArn' --output text   # a real ARN = confirmed
Step 12 — verify the AWS-native path. The agent and Fluent Bit should be Running on every node, and Container Insights metrics should appear:
kubectl get pods -n amazon-cloudwatch          # cloudwatch-agent-* and fluent-bit-* per node
kubectl top nodes                              # metrics-server: proves the cluster reports usage
aws logs describe-log-groups \
  --log-group-name-prefix "/aws/containerinsights/$(terraform output -raw grafana_admin_secret | cut -d/ -f1)"
# open the Container Insights console URL and watch the map populate (~2-3 min)
Step 13 — verify the CNCF path. Every kube-prometheus-stack pod Running, the PVCs Bound, and the ServiceMonitor scraped:
kubectl get pods -n monitoring                 # prometheus-kps-*, kps-grafana-*, alertmanager-*, node-exporter-*
kubectl get pvc  -n monitoring                 # all Bound (not Pending) — proves the EBS CSI/gp3 path
kubectl -n monitoring port-forward svc/kps-kube-prometheus-stack-prometheus 9090:9090 &
# In the Prometheus UI → Status → Targets, look for serviceMonitor/monitoring/sample-app/0 with both pods UP
Step 14 — open Grafana and log in.
kubectl -n monitoring port-forward svc/kps-grafana 3000:80 &
aws secretsmanager get-secret-value --secret-id "$(terraform output -raw grafana_admin_secret)" \
  --query SecretString --output text            # the admin password (user: admin)
# open http://localhost:3000 → the bundled "Kubernetes / Compute Resources" dashboards
# and your imported "sample-app" dashboard should be present
You now have both planes live: Container Insights in the AWS console (node/pod maps, CloudWatch alarms), and Grafana with PromQL dashboards, from the same terraform apply.
Step 15 — destroy (do not skip). ⚠️
terraform destroy
Confirm kubectl get ns monitoring is gone, kubectl get pvc -A | grep monitoring returns nothing (the EBS volumes are deleted with their PVCs), the add-on is removed (aws eks list-addons --cluster-name <c>), and the log groups are gone. The EKS cluster itself is untouched — we only ever read it.
Variables, outputs and making it reusable
Copy-pasting this stack into the next cluster is the click-ops we set out to kill, in HCL. The fix is a small module that takes a cluster name and a few toggles and stamps the whole observability plane — so a new cluster gets identical monitoring by adding one block:
module "eks_observability" {
  source       = "./modules/eks-observability"
  cluster_name = module.eks.cluster_name

  enable_container_insights = true
  enable_kube_prometheus    = true
  storage_class             = "gp3"
  log_retention_days        = 30
  grafana_ingress_host      = "grafana.dev.kloudvin.com"   # ALB + ExternalDNS
  amp_remote_write_url      = ""                            # "" = self-hosted only
  alarm_email               = "sre@kloudvin.com"
}
| Module input | Type | Purpose |
|---|---|---|
cluster_name |
string | Cluster to instrument (drives the data sources) |
enable_container_insights |
bool | Toggle the AWS-native add-on + IRSA |
enable_kube_prometheus |
bool | Toggle the CNCF Helm stack |
storage_class |
string | StorageClass for the PVCs (EBS CSI gp3) |
log_retention_days |
number | Retention on the Container Insights log groups |
grafana_ingress_host |
string | Hostname for the Grafana ALB Ingress (“” = port-forward only) |
amp_remote_write_url |
string | AMP endpoint (“” disables remote_write) |
alarm_email |
string | SNS subscription target |
Gate each half behind a count = var.enable_* ? 1 : 0 (or the module’s own bool) so a team can run Container Insights only, Prometheus only, or both — the same module, three shapes. Stamp it across a fleet with for_each over your clusters.
Roll your own vs the registry. The community modules are worth knowing: terraform-aws-modules/eks/aws provisions the cluster and its add-ons (including a clean IRSA sub-module, iam-role-for-service-accounts-eks, that builds exactly the OIDC-trust role shown above), and the aws-observability/observability-accelerator modules wrap AMP/AMG/ADOT with sensible defaults. Use them once your needs stabilise; roll your own (as here) when you want an opinionated house standard — every cluster gets exactly these log groups, this retention, this Grafana, wired to this SNS topic — which is often more valuable to a platform team than raw flexibility. The two compose: your house module can call the registry IRSA sub-module internally.
Common mistakes and troubleshooting
Observability fails silently — the metric that should have paged simply isn’t there — so these are worth memorising. Symptom → cause → fix:
| Symptom | Cause | Fix |
|---|---|---|
Agent pods Running, but no ContainerInsights metrics |
IRSA/Pod Identity not wired — SA can’t assume the role | Check :sub = system:serviceaccount:amazon-cloudwatch:cloudwatch-agent and the :aud condition; attach CloudWatchAgentServerPolicy |
aws_eks_addon apply: “role … cannot be assumed” |
Trust policy wrong or OIDC provider missing | Create aws_iam_openid_connect_provider; fix the Federated principal + conditions |
Grafana/Prometheus pods stuck Pending |
PVC Pending — no EBS CSI driver or no gp3 StorageClass |
Install aws-ebs-csi-driver add-on (+ IRSA) and a gp3 StorageClass; then the PVC binds |
| ServiceMonitor created but no target in Prometheus | Labels don’t match the Prometheus serviceMonitorSelector |
Add labels: { release: kps }; or set serviceMonitorSelectorNilUsesHelmValues: false |
| ServiceMonitor present, target has 0 endpoints | port set to a number, not the Service port name |
Use the named port; ensure the Service actually exposes /metrics |
remote_write to AMP: 403 / SignatureDoesNotMatch |
Missing SigV4 / IRSA on the Prometheus SA, or wrong region | Add sigv4.region; grant the Prometheus SA an IRSA role with aps:RemoteWrite |
| CloudWatch bill spiking after enabling Container Insights | Log groups default to never-expire; Fluent Bit is a firehose | Set retention_in_days; disable containerLogs you don’t need |
| Prometheus data lost on every pod restart | No storageSpec — Prometheus ran on emptyDir |
Add the volumeClaimTemplate (EBS PVC) to prometheusSpec |
helm_release times out / half-installed |
Big chart + CRDs exceed default timeout | Raise timeout; set atomic = true so a failure rolls back cleanly |
kubernetes_manifest (ServiceMonitor) fails at plan |
CRDs don’t exist yet at plan time | depends_on the helm_release; apply the stack in a prior run/target |
| Alarm fires but no email arrives | SNS email subscription still PendingConfirmation |
Click the confirmation link (Terraform can’t); check list-subscriptions-by-topic |
Container Insights alarm stuck INSUFFICIENT_DATA |
Wrong dimension, or the metric is genuinely silent | Match ClusterName/Namespace; set treat_missing_data per intent |
kubectl top errors “Metrics API not available” |
metrics-server not installed | Install metrics-server (it’s separate from both paths) |
| Provider auth: “You must be logged in to the server” | exec token stale / wrong context |
Ensure aws eks get-token works and the IAM identity has cluster access (access entry) |
The three that eat the most hours, in prose. The IRSA trust policy is the sneakiest AWS-native failure: the agent pods are green, kubectl logs shows the agent starting, and yet no metrics appear — because the service account cannot assume the role, so every CloudWatch API call is silently denied. The tell is AccessDenied in the agent logs; the fix is always the trust policy’s two conditions (:sub pinning amazon-cloudwatch:cloudwatch-agent, :aud = sts.amazonaws.com) and the managed policy attachment — not the agent config. The Pending PVC is the CNCF equivalent: the Helm release “succeeds,” but the Prometheus and Grafana pods sit Pending because their PVCs have no provisioner — this is entirely an EBS-CSI/StorageClass prerequisite, not a Prometheus problem, and it is why the storage lesson comes first. And the un-scoped ServiceMonitor is the classic “my app isn’t in Prometheus”: the monitor exists, but its labels don’t match the Prometheus instance’s serviceMonitorSelector, so it is ignored — set serviceMonitorSelectorNilUsesHelmValues: false (honour all) and label the monitor release: kps, then check Status → Targets in the Prometheus UI.
Cost, cleanup and production notes
What it costs left running. The standing cost is the cluster (control plane ~₹6,000/mo + node EC2), which predates this lesson. What this adds: the EBS volumes for the TSDB and Grafana (~60 GB gp3 ≈ ₹500/mo), the CloudWatch log ingestion + storage from Fluent Bit (volume-dependent — the real variable, and the one that surprises people), the Container Insights custom metrics (priced each — enhanced insights raises the count), a couple of Secrets Manager secrets (~₹35/mo each), and, if enabled, AMP (per-sample ingested) and AMG (~$9/editor/mo). The two cost levers that matter are log retention/scope and metric cardinality.
| Item | Rough price (indicative) | Control |
|---|---|---|
| Prometheus/Grafana EBS (gp3) | ~$0.09/GB-month | size retention to the PVC, not oversize |
| CloudWatch Logs ingestion | ~$0.50/GB (½ for IA class) | disable unneeded containerLogs; sample |
| CloudWatch Logs storage | ~$0.03/GB-month | retention_in_days on every group |
| Container Insights custom metrics | ~$0.30/metric-month | scope enhanced insights; watch cardinality |
| AMP ingestion | per-sample tiered | drop high-cardinality series before remote_write |
| Amazon Managed Grafana | ~$9/active editor-month | viewers cheaper; SSO-gate editors |
| Secrets Manager | ~$0.40/secret-month | one secret, not one per value |
Clean up with terraform destroy; the EBS volumes go with their PVCs (StorageClass reclaimPolicy: Delete), the add-on and its DaemonSets are removed, and the log groups are destroyed (no skip_destroy). Production hardening notes:
- Split the state, or at least the applies. The cluster, its add-ons, and the Helm workloads have different blast radii and change cadences. A common shape is cluster + core add-ons (EBS CSI, CloudWatch observability) in one config, and the Helm/app-layer observability (kube-prometheus-stack, ServiceMonitors, dashboards) in a second config that reads the cluster as a data source — so a Grafana upgrade never risks the cluster.
- Pin everything, upgrade deliberately. Pin the
addon_version, the Helmchartversion, and the provider versions; upgrade in a PR with aplandiff, not implicitly. An un-pinned chart re-templates on every apply. - Least privilege on the agent and on
remote_write. The agent role getsCloudWatchAgentServerPolicyand nothing more; the Prometheusremote_writerole gets onlyaps:RemoteWriteto the specific workspace. Scope the SNS topic policy with aSourceArncondition. - Set retention on day one. The single biggest EKS observability cost mistake is Fluent Bit shipping to never-expire log groups. Bake
retention_in_daysinto the module so a new cluster can’t leak. - Route by severity and guard drift. Two SNS topics — warnings (email/Slack) and pages (composites/critical only) — keep the pager meaningful; a scheduled
terraform planin CI surfaces the threshold someone widened in the console at 2 a.m.
Going deeper
The lesson so far gave you the two planes and the managed middle. This section is the layer underneath — the parts you reach for once the demo works and a real platform team starts asking harder questions: what “enhanced” actually buys you, how the collectors are really wired, how to sign a remote-write, how to turn a monitoring method into rules, how to stop cardinality quietly eating the bill, and why the whole thing sometimes needs two applys.
Three layers, sharpened: basic vs enhanced Container Insights vs Application Signals
“CloudWatch Container Insights” is not one thing. The add-on ships in layers, and knowing which layer you turned on explains both what you see and what you pay:
| Layer | Turned on by | Gives you | Costs |
|---|---|---|---|
| Basic Container Insights | agent metrics (default) | node / pod / cluster CPU, memory, network, disk | custom metrics, per metric |
| Enhanced Container Insights | enhanced_container_insights = true |
+ Kubernetes control-plane and object state, per-container granularity, richer maps | more custom metrics (higher cardinality) |
| Application Signals (APM) | add-on Application-Signals config + workload auto-instrumentation | service map, per-service request/latency/error metrics and SLOs, trace correlation | per signal + trace ingest |
Enhanced is the flag you already set in the hands-on; it is what makes the console show live Kubernetes object state, not just node metrics. Application Signals is the newer, higher layer — AWS’s APM — that auto-instruments supported runtimes (through the same CloudWatch Observability operator) to emit RED-style service metrics and SLOs without you writing a Prometheus exporter. It is the AWS-native answer to “I want golden signals per service, not just per pod.” Enable it through the add-on’s configuration_values plus pod annotations for auto-instrumentation, and treat it as opt-in — each signal and trace is billed.
The collectors, precisely — and where ADOT fits
Under the AWS-native add-on there are really two DaemonSets and an operator, and people conflate them:
| Component | Kind | Job | Lands in |
|---|---|---|---|
| CloudWatch agent | DaemonSet (managed by the observability operator) | scrape kubelet / cAdvisor, publish perf metrics as EMF | CloudWatch metrics + .../performance logs |
| Fluent Bit | DaemonSet | tail container / host / dataplane logs | CloudWatch Logs groups |
| Observability operator | Deployment | reconcile the agent config CR; drive Application Signals auto-instrumentation | the two above |
The metrics path is subtle: the agent does not call PutMetricData for every series — it writes embedded metric format (EMF) log lines to the .../performance group, and CloudWatch extracts the metrics from them. That is why Container Insights metrics and their backing logs live together, and why deleting that log group also blinds the metrics.
ADOT — the AWS Distro for OpenTelemetry — is the unifying collector when you outgrow “agent + Fluent Bit.” One OTel Collector can receive OTLP from your apps, scrape Prometheus targets, and fan out: metrics to AMP, traces to X-Ray or Tempo, logs onward — one pipeline you configure instead of two DaemonSets. It ships as its own aws_eks_addon (adot, which needs cert-manager) or as a helm_release. Reach for it when you want one collector and open standards; stay on the CloudWatch add-on when you want zero-config AWS-native.
Signing the pipe: IRSA for the Prometheus service account
The Managed-metrics section said the in-cluster Prometheus remote_writes to AMP “using the Prometheus service account’s IRSA role.” Here is the wiring that sentence referenced — the role, the aps:RemoteWrite policy scoped to the workspace, and the service-account annotation that binds them:
data "aws_iam_policy_document" "prom_assume" {
  statement {
    actions = ["sts:AssumeRoleWithWebIdentity"]
    principals {
      type        = "Federated"
      identifiers = [aws_iam_openid_connect_provider.oidc.arn]
    }
    condition {
      test     = "StringEquals"
      variable = "${replace(aws_iam_openid_connect_provider.oidc.url, "https://", "")}:sub"
      # the SA the kube-prometheus-stack chart creates for Prometheus:
      values   = ["system:serviceaccount:monitoring:kps-kube-prometheus-stack-prometheus"]
    }
  }
}

resource "aws_iam_role" "prom_rw" {
  name               = "${var.cluster_name}-prom-rw"
  assume_role_policy = data.aws_iam_policy_document.prom_assume.json
}

resource "aws_iam_role_policy" "prom_rw" {
  role = aws_iam_role.prom_rw.id
  policy = jsonencode({
    Version = "2012-10-17"
    Statement = [{
      Effect   = "Allow"
      Action   = ["aps:RemoteWrite"]
      Resource = aws_prometheus_workspace.this.arn   # scope to THIS workspace, never "*"
    }]
  })
}
Then annotate the chart’s Prometheus service account so the pod picks up the role, and the remoteWrite.sigv4 block (shown earlier) signs every request:
prometheus:
  serviceAccount:
    annotations:
      eks.amazonaws.com/role-arn: ${prom_role_arn}   # aws_iam_role.prom_rw.arn
Scoping Resource to the specific workspace ARN, not *, keeps a compromised Prometheus from writing across every tenant — a cross-workspace blast radius you never need.
From method to rules: USE, RED, and recording vs alerting
Dashboards full of graphs are not a strategy; USE and RED are. USE profiles resources: for every resource, watch Utilization, Saturation, Errors — the right lens for nodes, disks, network. RED profiles services: Rate, Errors, Duration — the right lens for request-driven apps. Container Insights and node-exporter feed USE; your app’s /metrics and Application Signals feed RED.
You encode both as Prometheus rules, and there are two kinds. A recording rule pre-computes an expensive expression on a schedule and stores it as a new series (cheap to graph and alert on); an alerting rule fires when an expression stays true for a for window. Author them as a PrometheusRule the Operator picks up:
groups:
  - name: red.rules
    rules:
      - record: job:http_request_rate:sum        # RED "Rate", pre-computed once
        expr: sum by (job) (rate(http_requests_total[5m]))
      - alert: HighErrorRate                      # RED "Errors"
        expr: |
          sum by (job) (rate(http_requests_total{code=~"5.."}[5m]))
            / sum by (job) (rate(http_requests_total[5m])) > 0.05
        for: 10m
        labels: { severity: page }
        annotations: { summary: "5xx > 5% on {{ $labels.job }} for 10m" }
The identical YAML can live in AMP as an aws_prometheus_rule_group_namespace (AWS-evaluated) instead of in-cluster — same PromQL, different owner. Route the severity: page label through Alertmanager to the SNS topic the CloudWatch alarms already use, so both planes page one channel.
Cardinality: the metric that quietly costs the most
Prometheus is cheap on series count until it isn’t: every distinct label-value combination is a new time series, and one unbounded label — a user ID, a full URL path, a pod name baked into a metric — can multiply a single metric into millions. Self-hosted, that is memory and disk; on AMP it is per-sample ingest, so cardinality is the bill. The fix is to drop the offending labels before they are stored, with metricRelabelings on the ServiceMonitor endpoint:
# on a ServiceMonitor endpoint (Prometheus Operator field: metricRelabelings)
metricRelabelings:
  - action: labeldrop
    regex: (id|instance)              # unbounded labels you never query by
  - action: drop
    sourceLabels: [__name__]
    regex: go_gc_duration_seconds.*   # noisy metrics you never alert on
Two diagnostics worth memorising: prometheus_tsdb_head_series reports how many series a Prometheus is holding right now, and topk(10, count by (__name__)({__name__=~".+"})) shows which metric names dominate. Relabel the top offenders and both memory and the AMP bill drop immediately.
Provider ordering: the plan-time CRD problem
The subtlest Terraform issue here is not a resource — it is ordering across providers. kubernetes_manifest (used for the ServiceMonitor and PrometheusRule) reads the target type’s schema at plan time, from a live API server. But the CRDs that define ServiceMonitor / PrometheusRule do not exist until the helm_release has applied. So a single terraform apply that creates both the chart and a kubernetes_manifest for one of its CRDs fails at plan, with “no matches for kind ServiceMonitor” — and depends_on cannot save you, because the failure is at plan, before apply order matters at all.
| Approach | Works? | Trade-off |
|---|---|---|
One config, kubernetes_manifest + depends_on the release |
no — fails at plan (CRD absent) | the classic trap |
Two runs / -target the release first, then the manifests |
yes | manual, awkward in CI |
| Split state: chart+CRDs in config A, monitors in config B (reads the cluster via data) | yes | the production shape |
Push monitors through the chart’s own additionalServiceMonitors values |
yes | fewer providers in play |
This is also why the provider blocks read the cluster as data sources rather than referencing a cluster resource in the same config: a provider whose host/token comes from a resource created in the same apply cannot configure itself on the first plan. Cluster in one layer, add-ons/CRDs in the next, app-layer monitors in a third — different blast radii, and every plan actually plans.
Dashboards and data sources as code
Clicking a dashboard together in Grafana is the same click-ops we set out to kill, one layer up. Two durable patterns keep dashboards in git. The sidecar convention (used in the hands-on) is the Kubernetes-native one: the chart runs a Grafana sidecar that watches for ConfigMaps labelled grafana_dashboard: "1" and imports their JSON — so a dashboard is a kubernetes_config_map wrapping a versioned .json file. Data sources work the same way through provisioning YAML (grafana.additionalDataSources in the chart values), so Prometheus, CloudWatch and AMP appear pre-wired on install. For Grafana you do not run — AMG, or Grafana Cloud — the grafana Terraform provider (grafana_dashboard, grafana_data_source, grafana_folder) manages the same objects over the HTTP API. Either way the dashboard JSON is reviewed in a PR, not rebuilt from memory after someone deletes it.
Practice challenges
Six exercises, escalating from a one-line cost fix to cardinality control. Each is expressed against the hands-on stack; the values and field names are the real ones, so you can reason them through even without a live cluster. Try each before opening its solution.
1. Cap the log bill (beginner)
The add-on created four Container Insights log groups and they default to never expire. Make them expire after 14 days, in Terraform, without disabling log collection.
<details><summary>Show solution</summary>
resource "aws_cloudwatch_log_group" "ci" {
  for_each          = toset(["application", "host", "dataplane", "performance"])
  name              = "/aws/containerinsights/${var.cluster_name}/${each.key}"
  retention_in_days = 14
}
Why: the add-on adopts pre-existing groups, so declaring them with retention_in_days caps storage without touching collection — the single biggest silent EKS cost leak, closed in four lines.
</details>
2. Make a ServiceMonitor actually get scraped (beginner → intermediate)
You applied a ServiceMonitor for sample-app, but Prometheus shows no target. Name the two independent things that must both be true, and fix each.
<details><summary>Show solution</summary>
Label the monitor so the Prometheus serviceMonitorSelector picks it up, and reference the Service port by name, not number:
metadata = { name = "sample-app", namespace = "monitoring", labels = { release = "kps" } }
spec     = { endpoints = [{ port = "metrics", path = "/metrics" }] }   # "metrics", never 9797
Plus set serviceMonitorSelectorNilUsesHelmValues: false in the chart values so Prometheus honours monitors it did not ship.
Why: selection is two-level (Prometheus selects monitors; monitors select Services) and the endpoint keys on the port name — miss either and the target is silently absent, no error anywhere. </details>
3. Survive a pod restart (intermediate)
Your Grafana dashboards and Prometheus history vanish every time the pods reschedule. Fix both in the Helm values.
<details><summary>Show solution</summary>
Give Prometheus a storageSpec.volumeClaimTemplate and Grafana persistence, both on the gp3 class:
prometheus:
  prometheusSpec:
    storageSpec:
      volumeClaimTemplate:
        spec:
          storageClassName: gp3
          accessModes: ["ReadWriteOnce"]
          resources: { requests: { storage: 50Gi } }
grafana:
  persistence: { enabled: true, storageClassName: gp3, size: 10Gi }
Why: without a PVC both run on emptyDir, which is deleted with the pod — the TSDB and dashboards are only durable on an EBS-backed StorageClass.
</details>
4. Ship metrics to AMP over SigV4 (intermediate → advanced)
Turn on durable long-term storage: create an AMP workspace and remote_write to it from the in-cluster Prometheus, authenticated correctly.
<details><summary>Show solution</summary>
resource "aws_prometheus_workspace" "this" { alias = "${var.cluster_name}-metrics" }
Grant the Prometheus SA an IRSA role with aps:RemoteWrite scoped to that workspace ARN, annotate the SA (eks.amazonaws.com/role-arn), and add to the values:
prometheus:
  prometheusSpec:
    remoteWrite:
      - url: https://aps-workspaces.<region>.amazonaws.com/workspaces/<ws-id>/api/v1/remote_write
        sigv4: { region: ap-south-1 }
Why: AMP accepts only SigV4-signed writes; the signature comes from the SA’s IRSA role, so the URL alone — no sigv4 block, no IRSA — returns 403.
</details>
5. Alert on user impact, not just CPU (advanced)
Add a RED-style alert — fire when 5xx exceeds 5% of requests for 10 minutes — as a PrometheusRule, and route it to the existing SNS topic.
<details><summary>Show solution</summary>
groups:
  - name: red.rules
    rules:
      - alert: HighErrorRate
        expr: |
          sum by (job) (rate(http_requests_total{code=~"5.."}[5m]))
            / sum by (job) (rate(http_requests_total[5m])) > 0.05
        for: 10m
        labels: { severity: page }
        annotations: { summary: "5xx > 5% on {{ $labels.job }}" }
Author it as a kubernetes_manifest (kind PrometheusRule) that depends_on the release, and give Alertmanager an sns_configs receiver (SigV4-signed) for the severity: page route.
Why: a CPU alarm misses user-visible failure; a RED error-ratio rule pages on the symptom customers actually feel, through the same SNS channel as the AWS-native alarms. </details>
6. Cut cardinality before it cuts your budget (advanced)
prometheus_tsdb_head_series is climbing and the AMP bill with it. Drop a high-cardinality label and a noisy metric at scrape time — without touching the app.
<details><summary>Show solution</summary>
# ServiceMonitor endpoint → metricRelabelings
metricRelabelings:
  - action: labeldrop
    regex: (id|instance)
  - action: drop
    sourceLabels: [__name__]
    regex: go_gc_duration_seconds.*
Find the offenders first with topk(10, count by (__name__)({__name__=~".+"})).
Why: every label-value combination is a billable series on AMP; dropping unbounded labels and unused metrics at ingest is the one lever that cuts both memory and per-sample cost immediately. </details>
Common beginner mistakes
These are misconceptions, not error messages — the wrong mental model that leads you to build the wrong thing. (The symptom → cause → fix table under Common mistakes and troubleshooting handles the operational failures; this is about how people think about observability wrong.)
-
“
kubectl topis my monitoring.” It reads metrics-server’s few-minutes, in-memory window that exists to drive the HPA — no history, no alerting, no dashboards. It is a smoke test that the cluster reports usage, not a monitoring system. Right model:topanswers “what is hot right now?”; Container Insights or Prometheus answer “what happened at 14:02 last Tuesday?” -
“Container Insights or Prometheus — I have to pick one.” They answer overlapping questions with different economics, and most real platforms run both, scoped: Container Insights for cheap no-ops node/cluster visibility and CloudWatch-native alarms, Prometheus for app metrics, PromQL and rich Grafana. Treating them as mutually exclusive makes you under-instrument.
-
“Fluent Bit is an alternative to Prometheus.” No — Fluent Bit ships logs, Prometheus stores metrics. They are different pillars, not competitors. Asking “do I still need Prometheus if I have Fluent Bit?” is asking “do I need a speedometer if I already have a dashcam?”
-
“The
helm_releasewent green, so monitoring works.” Helm reporting success only means the objects were created. The PVCs can still bePending(no EBS CSI or no matching StorageClass), and your ServiceMonitor can be silently unscoped (label/selector mismatch). “Installed” is not “collecting” — always verify targets are UP and PVCs are Bound. -
“I’ll set log retention later.” The log groups default to never expire and start billing from the first Fluent Bit line. “Later” is after the surprise invoice. Set
retention_in_dayson day one, in the module, so a new cluster physically cannot leak. -
“More metrics means better observability.” Every extra label-value combination is a billable series and a chunk of Prometheus memory; one unbounded label (user ID, raw path) can 1000× a single metric. Good observability is scoped — collect and keep what you alert or dashboard on, and drop the rest at scrape time.
-
“Grafana dashboards are safe once I have built them.” Without
persistence, a Grafana pod restart resets every dashboard and setting; even with it, a click-built dashboard dies with the PVC. Right model: dashboards are code — a ConfigMap (sidecar) or thegrafanaprovider, reviewed in a PR. -
“
remote_writejust needs the AMP URL.” AMP rejects unsigned writes; the URL withoutsigv4.regionand an IRSA role carryingaps:RemoteWritereturns 403. The endpoint is the easy half — the authentication is the half that is actually load-bearing. -
“A CPU alarm covers me.” CPU can sit flat while users get 500s. USE (resources) and RED (requests) are different lenses; alert on user-visible symptoms — error rate and latency — not just saturation, or you will page on the wrong things and miss the real ones.
Cheat-sheet
Resources and the argument that matters most on each:
| Resource | Key arguments |
|---|---|
aws_eks_addon (observability) |
addon_name = "amazon-cloudwatch-observability" service_account_role_arn/pod_identity_association configuration_values resolve_conflicts_on_update |
aws_iam_openid_connect_provider |
url = ...identity[0].oidc[0].issuer client_id_list = ["sts.amazonaws.com"] thumbprint_list |
IRSA trust (aws_iam_policy_document) |
sts:AssumeRoleWithWebIdentity · Federated = OIDC ARN · :sub + :aud conditions |
aws_eks_pod_identity_association |
cluster_name namespace service_account role_arn (trust pods.eks.amazonaws.com) |
aws_cloudwatch_log_group |
retention_in_days (⚠️ default = forever) |
helm_release (kube-prometheus-stack) |
repository chart version (pin!) values (templatefile) set_sensitive timeout atomic |
| kube-prometheus values | prometheusSpec.storageSpec serviceMonitorSelectorNilUsesHelmValues=false remoteWrite.sigv4 grafana.persistence |
kubernetes_manifest (ServiceMonitor) |
labels.release selector.matchLabels endpoints[].port (name!) depends_on the release |
aws_prometheus_workspace |
alias; output prometheus_endpoint → +api/v1/remote_write |
aws_grafana_workspace |
authentication_providers = ["AWS_SSO"] data_sources = ["PROMETHEUS", ...] role_arn |
aws_cloudwatch_metric_alarm (CI) |
namespace = "ContainerInsights" dimensions = { ClusterName, Namespace } alarm_actions |
Verification commands:
| Task | Command |
|---|---|
| Agent + Fluent Bit up | kubectl get pods -n amazon-cloudwatch |
| Cluster reports usage | kubectl top nodes / kubectl top pods -A |
| kube-prometheus pods | kubectl get pods -n monitoring |
| PVCs bound (EBS CSI OK) | kubectl get pvc -n monitoring |
| Prometheus targets | port-forward :9090 → Status → Targets |
| Open Grafana | kubectl -n monitoring port-forward svc/kps-grafana 3000:80 |
| Grafana password | aws secretsmanager get-secret-value --secret-id <cluster>/grafana-admin |
| List add-ons | aws eks list-addons --cluster-name <cluster> |
| Add-on versions | aws eks describe-addon-versions --addon-name amazon-cloudwatch-observability |
The service account the add-on uses: cloudwatch-agent in namespace amazon-cloudwatch — that string is what the IRSA :sub condition (or the Pod Identity association) must name.
Interview and exam questions
-
What does the
amazon-cloudwatch-observabilityEKS add-on install, and what permission does it need? The CloudWatch agent (a DaemonSet) plus Fluent Bit — the agent publishes performance metrics to theContainerInsightsnamespace and Fluent Bit ships container logs to CloudWatch Logs. It needs theCloudWatchAgentServerPolicymanaged policy, granted to thecloudwatch-agentservice account (inamazon-cloudwatch) via IRSA or EKS Pod Identity. -
Walk through IRSA for the agent. Register the cluster’s OIDC issuer as an
aws_iam_openid_connect_provider; create an IAM role whose trust policy allowssts:AssumeRoleWithWebIdentityfrom thatFederatedprovider, conditioned on:sub = system:serviceaccount:amazon-cloudwatch:cloudwatch-agentand:aud = sts.amazonaws.com; attachCloudWatchAgentServerPolicy; pass the role ARN as the add-on’sservice_account_role_arn. -
IRSA vs EKS Pod Identity — when each? IRSA federates through the cluster’s OIDC provider (per-cluster issuer in the trust). Pod Identity trusts the
pods.eks.amazonaws.comservice principal and binds the SA→role with anaws_eks_pod_identity_association, so the same role is reusable across clusters and there’s no OIDC provider to manage. Prefer Pod Identity for new clusters; IRSA remains everywhere and is still required by some tools. -
Container Insights vs kube-prometheus-stack — the trade? Container Insights is one add-on, AWS-run, natively integrated (CloudWatch alarms, X-Ray), but AWS-only and priced per-GB/per-metric (cardinality is expensive). kube-prometheus-stack is one Helm release, self-run (you own storage, upgrades, scaling), PromQL + a huge Grafana library, portable, cheap on cardinality. Most teams run both, scoped.
-
Your Grafana and Prometheus pods are
Pending. Most likely cause on EKS? Their PVCs can’t be provisioned — the EBS CSI driver isn’t installed or there’s no matchinggp3StorageClass. Install theaws-ebs-csi-driveradd-on (with IRSA) and a StorageClass; the PVCs then bind and the pods start. It’s a storage prerequisite, not a Prometheus bug. -
A ServiceMonitor exists but no target appears in Prometheus. Two causes. Its labels don’t match the Prometheus instance’s
serviceMonitorSelector(so it’s ignored — fix withrelease: kpsand/orserviceMonitorSelectorNilUsesHelmValues: false), or the endpointportis a number instead of the Service port name (or the Service doesn’t expose/metrics). -
How do you keep Prometheus data across pod restarts? Give
prometheusSpecastorageSpec.volumeClaimTemplatepointing at an EBS-backed StorageClass — without it, Prometheus usesemptyDirand loses its TSDB on every restart. Size the PVC to theretentionwindow. -
What is AMP, and how does data get into it from an in-cluster Prometheus? Amazon Managed Service for Prometheus is a managed, HA, Prometheus-compatible store. Your Prometheus keeps scraping and
remote_writes to the workspace’s.../api/v1/remote_writeendpoint, signing each request with SigV4 (region-scoped) using an IRSA role that hasaps:RemoteWrite. -
How do you manage secret Helm values (the Grafana password) from Terraform safely? Generate it with
random_password, pass it throughset_sensitiveon thehelm_release(so it’s redacted inplan), and store it in Secrets Manager — never in thevaluesfile or a plaintext template variable. -
How does an EKS alert reach a human on each path? AWS-native: an
aws_cloudwatch_metric_alarmon aContainerInsightsmetric firesalarm_actionsto an SNS topic. CNCF: aPrometheusRulefires into Alertmanager, whosesns_configsreceiver (SigV4-signed) publishes to the same SNS topic. Both fan out to email/Slack/PagerDuty. -
(Terraform Associate style) Your
kubernetes_manifestfor a ServiceMonitor fails atplanwith “no matches for kind ServiceMonitor”. Why, and the fix? The CRD doesn’t exist yet at plan time —kubernetes_manifestneeds a live API that knows the type. Install the CRDs first (the kube-prometheus-stackhelm_release) anddepends_onit; in practice, apply the stack before the manifests, or split them into a second config. -
(Terraform Associate style) Why pin both the
addon_versionand the Helmchartversion? Un-pinned, each apply may select a newer version and silently change infrastructure (or re-template the whole release), producing drift and surprise upgrades. Pinning makes upgrades explicit, reviewableplandiffs.
Glossary
- Observability — the property of being able to answer new questions about a running system from its outputs (metrics, logs, traces) without shipping new code to ask them.
- Metrics / logs / traces — the three pillars: numeric time-series (what), discrete event records (why), and the path of one request across services (where).
- Container Insights — AWS’s EKS monitoring feature: per-pod/node/cluster metrics in the
ContainerInsightsnamespace plus log groups, populated by the CloudWatch agent and Fluent Bit. - CloudWatch agent — the DaemonSet the observability add-on runs on every node to collect performance metrics and publish them (as EMF) to CloudWatch.
- Fluent Bit — a lightweight log shipper (DaemonSet) that tails container/host/dataplane logs and forwards them to CloudWatch Logs.
- EMF (embedded metric format) — JSON log lines that carry metric values; CloudWatch extracts metrics from them, which is why Container Insights metrics and their logs live together.
amazon-cloudwatch-observability— the EKS add-on that installs the CloudWatch agent, Fluent Bit and the observability operator in one resource.- Application Signals — AWS’s APM layer (service map, per-service RED metrics, SLOs) built on the same add-on through runtime auto-instrumentation.
- kube-prometheus-stack — the community Helm chart bundling the Prometheus Operator, Prometheus, Alertmanager, Grafana, node-exporter and kube-state-metrics.
- Prometheus Operator — the controller that turns
ServiceMonitor/PodMonitor/PrometheusRulecustom resources into Prometheus scrape and rule config. - ServiceMonitor / PodMonitor — CRDs that declare what to scrape; the Operator generates the scrape config from them (two-level selection applies).
- PrometheusRule — a CRD holding recording and alerting rules written in PromQL.
- Recording rule — a rule that pre-computes an expensive PromQL expression on a schedule and stores it as a new series, so dashboards and alerts read it cheaply.
- Alerting rule — a rule that fires an alert when its expression stays true for a
forwindow; routed onward by Alertmanager. - Alertmanager — the component that deduplicates, groups and routes firing alerts to receivers (SNS, Slack, PagerDuty).
- node-exporter / kube-state-metrics — exporters for machine-level metrics (CPU, disk, network) and Kubernetes object state (pod/deployment/PVC counts) respectively.
- metrics-server — the lightweight Resource Metrics API that backs
kubectl topand the HPA; a few minutes of in-memory data, not a monitoring store. - PromQL — Prometheus’s query language, identical whether you self-host or use AMP.
- TSDB — Prometheus’s time-series database; on EKS it must live on an EBS-backed PVC to survive restarts.
- remote_write — Prometheus’s mechanism for streaming scraped samples to a remote store such as AMP.
- AMP (Amazon Managed Service for Prometheus) — a managed, horizontally-scaling, Prometheus-compatible store; priced per sample ingested and per query.
- AMG (Amazon Managed Grafana) — managed Grafana with IAM Identity Center SSO, reading AMP/CloudWatch/X-Ray as data sources.
- ADOT (AWS Distro for OpenTelemetry) — AWS’s supported OpenTelemetry Collector; one pipeline can export metrics to AMP, traces to X-Ray/Tempo, and more.
- IRSA (IAM Roles for Service Accounts) — binds a Kubernetes service account to an IAM role by federating through the cluster’s OIDC provider (trust conditioned on
:sub/:aud). - EKS Pod Identity — the newer SA→role binding that trusts
pods.eks.amazonaws.comand uses an association resource, so the role is reusable across clusters with no per-cluster OIDC provider. - SigV4 — AWS’s request-signing scheme; AMP requires each
remote_write(and each Alertmanagersns_configspublish) to be SigV4-signed. - Cardinality — the number of distinct label-value combinations (series) a metric produces; the main driver of Prometheus memory and AMP cost.
- USE / RED — monitoring methods: Utilization / Saturation / Errors for resources, Rate / Errors / Duration for services.
- StorageClass / PVC / EBS CSI — the Kubernetes storage chain that provisions the EBS volumes Prometheus and Grafana persist on; a missing
gp3class or driver leaves PVCsPending.
Key takeaways
- Observability is infrastructure: the collector add-on, its IAM role, the Helm stack, the PVCs, the alert rules and the SNS topic all belong in Terraform next to the cluster — versioned, reviewed, and stamped identically into every environment from one module.
- EKS gives you two paths, and both are one resource: the AWS-native CloudWatch Observability add-on (
aws_eks_addon+ IRSA/Pod Identity +CloudWatchAgentServerPolicy) drops the agent and Fluent Bit onto every node; the CNCF kube-prometheus-stack (helm_release) installs the whole Prometheus ecosystem. Most platforms run both, scoped. - The AWS-native failure is always the trust policy: green agent pods with no metrics means the
cloudwatch-agentservice account can’t assume the role — check the:sub/:audconditions and the policy attachment, not the agent. - The CNCF failure is always the PVC: Prometheus and Grafana are stateful, so their
volumeClaimTemplate/persistenceneeds agp3StorageClass on the EBS CSI driver — no driver,Pendingpods, no history. Storage comes first. - ServiceMonitors obey two-level selection: the monitor’s
releaselabel must match the PrometheusserviceMonitorSelector, and theportmust be the Service port name — get either wrong and the target is silently never scraped. - Manage Helm values from Terraform with
templatefile/yamlencodefor structure andset_sensitivefor secrets; pin the add-on and chart versions so upgrades are explicit diffs, not surprises. - Managed (AMP + AMG) keeps Prometheus’s ergonomics and offloads the HA storage: your Prometheus
remote_writes to AMP over SigV4, AMG reads it with SSO — a common pragmatic middle for teams that want PromQL without operating the database. - Set log retention on day one — Fluent Bit into never-expire Container Insights log groups is the classic silent EKS cost leak — and always finish the loop:
apply, verify withkubectl topand an open Grafana, thendestroy.