A logistics company runs 40,000 GPS-and-telemetry-emitting vehicles, and the operations desk wants a live map plus exception alerts (“this refrigerated trailer breached 8 °C twelve minutes ago”) instead of the hourly batch they have today. Telemetry arrives as a Kafka topic at roughly 18,000 events/second at peak, bursting to 50,000 during a depot sync. The data team’s mandate is to land every event in Snowflake within a couple of seconds, transform it into clean per-vehicle and per-alert tables continuously, and do it without standing up a Spark cluster or paying for an always-on warehouse that idles between bursts. This is the implementation guide that builds exactly that: Snowpipe Streaming for sub-second row-level ingestion into a raw table, then Streams and Tasks to incrementally transform that raw table into curated, queryable models — the serverless, no-files, near-real-time pattern Snowflake is built for, with the option to swap the Stream-and-Task layer for Dynamic Tables where declarative freshness fits better.
The shape that makes this work is three primitives that compose. Snowpipe Streaming writes rows directly through a channel — an ordered, stateful connection from a client (the Snowflake Ingest SDK or the Kafka connector) into a single target table — with no staged files, no per-file overhead, billed by throughput rather than by warehouse-hour. A Stream is a change-tracking cursor over a table that, when queried inside a transaction, exposes only the rows that have arrived since the cursor last advanced — Snowflake’s native change-data-capture (CDC) mechanism, built on Time Travel. A Task is a scheduled or DAG-chained unit of SQL that runs on a warehouse (or serverless, where Snowflake sizes and bills the compute per run) and is the thing that consumes a Stream, draining new rows into the next layer. Chain them — streaming writes raw, a Stream tracks the delta, a Task drains it into enriched, a second Task derives alerts — and you get a continuous medallion pipeline (raw → enriched → curated) with at-least-once-into-the-channel and exactly-once-out-of-the-Stream semantics, at second-to-minute latency, with the only steady compute cost being the seconds a small warehouse runs when there is actually data to move.
By the end of this guide you will be able to stand the whole pipeline up from scratch, reason about where every rupee and every second of latency comes from, decide channel-vs-file and warehouse-vs-serverless and Stream-and-Task-vs-Dynamic-Table on the merits, handle poison rows without stalling the pipeline, and diagnose the two failure modes that actually page you at 2 a.m.: a Stream that has gone stale and silently stopped feeding, and ingestion lag creeping past your SLO. The prose explains the mechanism; the tables enumerate every option, limit, and failure so you can keep them open mid-incident.
What problem this solves
The default way to get data into Snowflake is classic Snowpipe: your producer writes files to a stage (cloud object storage), an event notification (or a REST call) tells Snowpipe a file arrived, and Snowpipe copies it into a table. That is excellent for file-shaped data arriving every few minutes — clickstream micro-batches, hourly exports, vendor drops. It is a poor fit for a firehose of tiny events, because every file carries overhead (a COPY operation, metadata, a minimum effective latency measured in tens of seconds to a minute), and to get low latency you must write many tiny files, which is both slow and expensive. A vehicle emitting one telemetry row every two seconds, times 40,000 vehicles, is not a file problem — it is a row problem.
Snowpipe Streaming removes the file. The client opens a channel and pushes rows; Snowflake buffers and commits them into the target table on a cadence measured in seconds, and bills you for the throughput rather than for a warehouse. That solves landing. But landing raw events is not the job — the operations desk needs clean per-vehicle state and derived alerts, which means transformation, and transformation that runs continuously without re-scanning the whole raw table every minute. That is the CDC problem, and Streams solve it: a Stream remembers exactly which rows you have already processed, so a transform reads only the new ones. And something has to run the transform on a cadence — that is Tasks, with the critical property that a Task gated on SYSTEM$STREAM_HAS_DATA skips its run (and consumes zero compute) when there is nothing new.
What breaks without this combination: teams reach for an external orchestrator (Airflow, a cron job hitting Snowflake) plus full-table MERGE statements that re-scan millions of rows every minute, burning warehouse credits continuously and still landing minutes behind; or they over-rotate to classic Snowpipe with one-row files and watch the bill and the latency both balloon; or they keep a Spark Structured Streaming job alive 24/7 to do what Snowflake does natively. Who hits this: any team that needs near-real-time (seconds-to-a-couple-minutes) freshness on Snowflake — operational dashboards, fraud/anomaly alerting, IoT and telemetry, CDC-mirrored OLTP tables, real-time personalization features. The fix is not “a bigger warehouse” — it is choosing the right ingestion primitive, the right CDC cursor, and the right scheduler, and wiring them so compute only runs when data exists.
Here is the field, framed as the four decisions this article forces and where to look first:
| Decision | The question it forces | Default choice for “near-real-time telemetry” | Where the cost/latency lives |
|---|---|---|---|
| Ingestion: Streaming vs classic Snowpipe | Rows-per-second firehose, or files every few minutes? | Snowpipe Streaming (channels, no files) | Streaming: per-client-hour + per-GB; classic: per-file COPY compute |
| CDC: Stream vs full-scan vs Dynamic Table | Do I track an offset, re-scan, or declare freshness? | Append-only Stream on the raw table | Stream: near-zero; full-scan: warehouse credits every run |
| Schedule: warehouse Task vs serverless Task vs DT | Fixed warehouse, Snowflake-sized, or declarative refresh? | Serverless Task (spiky) or XS warehouse Task | Warehouse: per-second while running; serverless: per-run, right-sized |
| Target shape: imperative Tasks vs Dynamic Tables | Hand-written INSERT/MERGE, or a TARGET_LAG query? |
Tasks for multi-step DAG; DT for declarative SQL | DT: managed refresh compute; Tasks: your warehouse |
Learning objectives
By the end of this guide you can:
- Explain how Snowpipe Streaming channels differ from classic file-based Snowpipe — the channel/offset-token model, the commit cadence, the billing model — and choose between them for a given workload with real numbers.
- Stand up the Snowflake objects (database, schemas, landing table, least-privilege role, transform warehouse) with Terraform and SQL, and authenticate a streaming client with key-pair JWT auth.
- Configure the Snowflake Kafka connector in
SNOWPIPE_STREAMINGmode (or the Ingest SDK in Java) to open per-partition channels and stream rows continuously, tuning the latency-vs-cost knobs. - Create the right kind of Stream (standard vs append-only vs insert-only), reason about its offset, staleness window, and Time-Travel dependency, and consume it transactionally so the offset advances exactly-once.
- Build and chain Tasks into a DAG (root + dependents, finalizer), choose serverless vs warehouse execution, gate them on
SYSTEM$STREAM_HAS_DATA, and schedule bySCHEDULE,CRON, orAFTER. - Decide when to replace the Stream-and-Task layer with Dynamic Tables, and articulate the trade-offs (declarative
TARGET_LAGvs imperative control, full vs incremental refresh). - Handle poison rows with a dead-letter pattern (
TRY_CAST, error tables) so one malformed event never stalls the pipeline, and design error handling that preserves exactly-once. - Monitor and troubleshoot ingestion lag and Stream staleness using
TASK_HISTORY,SNOWPIPE_STREAMING_*views,STREAM_HAS_DATA, and connector JMX metrics — and fix each root cause.
Prerequisites & where this fits
You need a Snowflake account on Enterprise edition or higher (Streams and Tasks need it; serverless Tasks and Dynamic Tables need it too), and a role with ACCOUNTADMIN available for the one-time grants (EXECUTE TASK, EXECUTE MANAGED TASK, user creation). You should be comfortable with Snowflake SQL — CREATE TABLE, roles and grants, INSERT ... SELECT, the VARIANT type and semi-structured access (: and FLATTEN) — and with cloud object storage concepts even though Streaming bypasses staging.
For the ingestion client you need one of: the Snowflake Ingest SDK (Java 2.x, the snowflake-ingest-sdk artifact) for a hand-rolled producer, or the Snowflake Kafka connector ≥ 2.1 configured with snowflake.ingestion.method=SNOWPIPE_STREAMING when your source is already a Kafka topic. This guide uses the Kafka connector path because the source is Kafka, and shows the Ingest SDK shape for completeness. You also need a running Kafka (or Confluent Cloud) cluster with the vehicle.telemetry topic and a Kafka Connect worker, the snowsql CLI, Terraform ≥ 1.6 with the Snowflake-Labs/snowflake provider for the account objects, and an RSA key pair for key-pair authentication — Snowpipe Streaming clients authenticate with a JWT signed by a private key, never a password.
Where this fits: this is the ingestion + transformation backbone of a Snowflake data platform. Upstream of it sit your source systems and Kafka. Downstream sit your BI tools, your reverse-ETL, and your transformation framework — if you run dbt, the same Streams-and-Tasks-fed raw layer is what dbt models build on, and you would manage the heavier transforms in Set Up dbt Cloud Jobs with Slim CI and Snowflake Deferral. If your platform is Databricks-shaped instead, the analogous governance lives in Configure Databricks Unity Catalog External Locations and Storage Credentials. The Kafka side — multi-region topics, tiered storage — is covered in Configure Confluent Cloud Cluster Linking and Tiered Storage for Multi-Region Kafka. And the organizational pattern for owning these pipelines per-domain is Data Mesh: Decentralized Domain-Oriented Data Ownership at Scale.
A quick map of who owns which layer during an incident, so you page the right person:
| Layer | What lives here | Who usually owns it | Failure classes it causes |
|---|---|---|---|
| Kafka topic + Connect worker | Partitions, offsets, the sink connector | Streaming / platform team | Connector down → ingestion stops; rebalance → lag |
| Snowpipe Streaming channel | Per-partition channel, offset token, commit | Snowflake (managed) + connector config | Channel reset → duplicate-window; throughput throttle → lag |
| Raw landing table | VARIANT + typed columns, retention |
Data engineering | Wrong retention → Stream goes stale |
| Stream (CDC cursor) | Offset into the raw table | Data engineering | Not consumed long enough → stale, silent data loss |
| Tasks / DAG | The transform SQL + schedule | Data engineering | Suspended/failed Task → stream backs up, lag grows |
| Target curated tables | Enriched + alert tables | Data engineering / analytics | Schema drift, poison row stalling the batch |
Core concepts
Six mental models make every later decision obvious.
A channel is a stateful, ordered pipe into one table — and its offset token is how you get exactly-once. Snowpipe Streaming does not write files; a client opens a channel (a named, persistent connection scoped to one database.schema.table) and appends rows in order. Each insertRows call carries (optionally) an offset token — an opaque string you control, typically the Kafka partition offset or a monotonic sequence — and Snowflake durably remembers the latest committed offset token per channel. On client restart you ask the channel for its latest committed offset token and resume from there, so rows are neither lost nor double-written. The channel buffers rows client-side and the SDK/connector flushes them to Snowflake, which commits them into the table on a cadence (seconds). Until a commit, rows are buffered, not queryable; after commit they are in the table like any other row.
Streaming bills by throughput, not by warehouse. There is no virtual warehouse in the ingestion path. Snowflake meters Snowpipe Streaming as a per-client-connection rate (a small steady charge per active client/hour) plus the data volume ingested. This is the whole reason it beats classic Snowpipe for high-frequency small events: classic Snowpipe runs a COPY (compute) per file and has per-file overhead, so a million one-row files is catastrophic; streaming amortizes everything into a throughput meter. The trade-off: classic Snowpipe can be cheaper for large files arriving infrequently, because you pay only for the COPY compute and nothing between files.
A Stream is a query-able diff, implemented on Time Travel. A Stream object records an offset — a point in the table’s change history. When you SELECT from the stream, Snowflake computes the set of changes (inserts, and for a standard stream also updates/deletes) between that offset and the current table version, using the table’s Time Travel history. Three crucial consequences follow. (1) The stream’s offset only advances when the stream is consumed inside a DML statement that commits — a bare SELECT shows you the rows but does not move the cursor, so inspection is safe. (2) Because it relies on Time Travel, the stream’s offset must stay within the table’s data-retention window (DATA_RETENTION_TIME_IN_DAYS, extended by MAX_DATA_EXTENSION_TIME_IN_DAYS); if the offset falls behind the window — because nothing consumed the stream for longer than retention — the stream goes STALE and reading it returns nothing, silently. (3) A stream adds metadata columns — METADATA$ACTION (INSERT/DELETE), METADATA$ISUPDATE, METADATA$ROW_ID — that your transform uses to apply changes correctly.
Stream type is a cost-and-correctness choice. A standard stream tracks inserts, updates, and deletes (it represents an update as a delete + insert pair) — full CDC, needed when the source table is mutated. An append-only stream tracks only inserts and ignores deletes/updates entirely — cheaper and simpler, and correct for an append-only landing table (which a streaming target almost always is). An insert-only stream exists specifically for streams on external tables / directory tables over storage. For a Snowpipe Streaming raw table you append to and never update, append-only is the right default.
A Task is a scheduler bound to SQL, and the DAG is how you order work. A Task runs a single SQL statement (or a stored-procedure call, or a CALL) on a schedule (SCHEDULE = '1 MINUTE', a USING CRON expression, or AFTER <parent> to make it a dependent). Tasks chain into a DAG: one root task with a schedule, and dependents with AFTER, optionally ending in a finalizer task that runs after all leaves (good for cleanup/marker rows). Tasks run on either a named warehouse you specify (you control the size and it bills per-second while running) or, by omitting the warehouse and setting USER_TASK_MANAGED_INITIAL_WAREHOUSE_SIZE, as a serverless task that Snowflake sizes and bills per run — usually 10–20% cheaper for spiky/short work and with no idle. A Task is created suspended; you RESUME it (leaf-to-root) to arm the DAG. The single most important cost lever is the WHEN SYSTEM$STREAM_HAS_DATA(...) predicate: a Task whose condition is false skips the run entirely and consumes no compute, so empty ticks are free.
Dynamic Tables are the declarative alternative to the whole Stream-and-Task layer. A Dynamic Table is defined by a query plus a TARGET_LAG (e.g. '1 minute' or DOWNSTREAM); Snowflake’s automated refresh keeps it no more stale than that target, computing the change incrementally where it can (it manages the equivalent of a stream + task for you) and falling back to a full refresh for query shapes it can’t incrementalize. You write what the table should contain, not how to update it. The trade-off is control: Dynamic Tables are ideal for declarative SQL transforms where “keep this fresh within N” is the whole requirement; imperative Tasks win when you need procedural logic, side effects (dead-letter inserts, external calls), precise DAG ordering, or MERGE semantics a DT chain doesn’t express cleanly.
The vocabulary in one table
Pin down every moving part before the deep sections. The glossary repeats these for lookup; this is the mental model side by side.
| Concept | One-line definition | Where it lives | Why it matters here |
|---|---|---|---|
| Channel | Ordered, stateful pipe from a client into one table | Snowpipe Streaming client + Snowflake | The unit of streaming ingest; carries the offset token |
| Offset token | Opaque per-channel marker of last-committed row | Channel state (durable) | Exactly-once resume after client restart |
| Snowpipe Streaming | File-less, throughput-billed row ingestion | Ingest SDK / Kafka connector | Landing layer; no warehouse involved |
| Classic Snowpipe | File-based, COPY-per-file ingestion |
Stage + pipe object | The thing Streaming replaces for high-frequency events |
| Stream | CDC cursor exposing changes since an offset | Schema object on a table | Feeds the transform only the new rows |
| Offset (stream) | Point in Time-Travel history the stream tracks | Stream metadata | Advances only on committed DML consuming it |
| Stale stream | Offset fell outside the retention window | Stream state (STALE = true) |
Silent data loss; the #1 page |
| Append-only stream | Tracks inserts only, ignores updates/deletes | Stream option | Cheaper, correct for landing tables |
| Task | Scheduled/chained SQL unit | Schema object | Drains the stream into the next layer |
| Serverless task | Task on Snowflake-managed compute, billed per run | Task option | No warehouse to size; right-sized per run |
| DAG / finalizer | Root + AFTER dependents (+ post-leaf task) |
Task graph | Orders multi-step transforms |
SYSTEM$STREAM_HAS_DATA |
Boolean: does the stream have unconsumed rows? | Function in WHEN clause |
Empty ticks cost zero compute |
| Dynamic Table | Declarative auto-refreshed table with TARGET_LAG |
Schema object | Replaces Stream+Task for declarative SQL |
| Time Travel | Historical versions of a table’s data | Table feature (retention) | The substrate Streams are built on |
Snowpipe Streaming vs classic Snowpipe — the ingestion fork
This is the first and most consequential decision, so enumerate it fully. Both land data in a Snowflake table; they differ in unit, latency floor, billing, and operational shape.
| Dimension | Snowpipe Streaming | Classic Snowpipe (file-based) |
|---|---|---|
| Unit of ingest | Rows, through a channel | Files in a stage |
| Latency floor | Seconds (commit cadence) | ~Tens of seconds to ~1 minute (notify + COPY) |
| Compute model | No warehouse; throughput-metered | COPY runs on Snowpipe-managed compute per file |
| Billing | Per-client-hour + per-GB ingested | Per-file overhead + compute per COPY |
| Best for | Many small events, high frequency | Files arriving every few minutes |
| Worst for | Occasional large file drops | One-row-per-file firehoses |
| Ordering | Per-channel ordered | Per-file; order across files not guaranteed |
| Exactly-once | Offset token per channel | File-name dedup (a file loads once) |
| Client | Ingest SDK / Kafka connector (streaming mode) | Anything that writes to a stage + notifications |
| Schema evolution | Connector schematization (optional) | MATCH_BY_COLUMN_NAME, infer-schema on COPY |
The cost crossover is the part people get wrong. Per-file overhead in classic Snowpipe means a fixed minimum charge per file regardless of size; streaming’s per-client charge is per connection-hour regardless of row count. So:
| Workload | Cheaper option | Why |
|---|---|---|
| 50,000 events/sec, 200-byte rows | Streaming | A file-per-event would be millions of COPYs; streaming amortizes to a throughput meter |
| One 2 GB file every 10 minutes | Classic Snowpipe | One COPY on a big file is efficient; no need for an always-connected client |
| 5,000 events/sec but bursty (idle nights) | Streaming (serverless transform) | Steady client charge is small; you avoid file micro-batching latency |
| Hourly vendor CSV drops | Classic Snowpipe | Files already exist; notifications + COPY is the natural fit |
| CDC from an OLTP DB at thousands of changes/sec | Streaming (via connector) | Row-level, low latency, ordered per channel |
A subtlety worth internalizing: Snowpipe Streaming “high-performance” / classic-streaming architectures differ in throughput ceilings and pricing tiers, and the Kafka connector’s behavior (single-buffer vs double-buffer, channel-per-partition) is what you actually tune in practice. Do not assume a single flush knob controls everything — the latency you observe is the max of the client buffer flush interval and Snowflake’s commit cadence, and at very high throughput the binding constraint becomes per-channel/per-account ingestion limits, not your buffer setting.
The streaming client — Kafka connector and the Ingest SDK
Two ways to open channels. The Kafka connector is the no-code path when data is already in Kafka: point it at the topic and the target table, and it opens one Snowpipe Streaming channel per topic-partition, naming each channel deterministically (so a connector restart resumes the same channels at their committed offsets). The Ingest SDK is the code path for a custom producer: you open a channel, call insertRows with an offset token, and periodically check the last-committed offset.
The connector’s latency-vs-cost knobs, enumerated:
| Connector property | What it controls | Typical value | Effect of lowering | Effect of raising |
|---|---|---|---|---|
snowflake.ingestion.method |
Streaming vs classic | SNOWPIPE_STREAMING |
n/a | n/a (switches whole mode) |
buffer.flush.time |
Seconds before a partial buffer flushes | 1 |
Lower latency, more commits/overhead | Higher latency, fewer commits |
buffer.count.records |
Rows before a flush | 10000 |
Flush sooner on busy partitions | Larger commits, more memory |
buffer.size.bytes |
Bytes before a flush | 20000000 |
Flush sooner | Larger commits |
snowflake.streaming.enable.single.buffer |
Single vs double buffering | true |
Lower memory, simpler | More client-side parallelism |
tasks.max |
Connect tasks (parallel channels) | = partition count | Fewer parallel channels | More parallelism (≤ partitions) |
snowflake.enable.schematization |
Auto-create columns from JSON | true/false |
Strict schema | Auto-evolving columns |
errors.tolerance / DLQ |
Bad-record handling | all + DLQ topic |
Fail fast | Route bad rows to a DLQ |
The Kafka connector configuration in streaming mode (the private key is injected from a secret store at deploy time, never hardcoded):
{
  "name": "telemetry-snowpipe-streaming",
  "config": {
    "connector.class": "com.snowflake.kafka.connector.SnowflakeSinkConnector",
    "tasks.max": "8",
    "topics": "vehicle.telemetry",

    "snowflake.url.name": "kv-org.eu-west-1.snowflakecomputing.com:443",
    "snowflake.user.name": "SVC_TELEMETRY_INGEST",
    "snowflake.role.name": "ROLE_TELEMETRY_INGEST",
    "snowflake.private.key": "${file:/etc/connect-secrets/snowflake.properties:private_key}",

    "snowflake.ingestion.method": "SNOWPIPE_STREAMING",
    "snowflake.streaming.enable.single.buffer": "true",
    "snowflake.enable.schematization": "false",

    "snowflake.database.name": "TELEMETRY",
    "snowflake.schema.name": "RAW",
    "snowflake.topic2table.map": "vehicle.telemetry:TELEMETRY",

    "buffer.flush.time": "1",
    "buffer.count.records": "10000",
    "buffer.size.bytes": "20000000",

    "key.converter": "org.apache.kafka.connect.storage.StringConverter",
    "value.converter": "org.apache.kafka.connect.json.JsonConverter",
    "value.converter.schemas.enable": "false",

    "errors.tolerance": "all",
    "errors.deadletterqueue.topic.name": "vehicle.telemetry.dlq",
    "errors.deadletterqueue.context.headers.enable": "true"
  }
}
Deploy and check it:
curl -s -X PUT -H "Content-Type: application/json" \
  --data @telemetry-snowpipe-streaming.json \
  http://kafka-connect:8083/connectors/telemetry-snowpipe-streaming/config | jq .

# Confirm RUNNING and tasks healthy
curl -s http://kafka-connect:8083/connectors/telemetry-snowpipe-streaming/status \
  | jq '{state: .connector.state, tasks: [.tasks[].state]}'
For a hand-rolled producer, the Ingest SDK shape (Java) — the offset token is the load-bearing detail for exactly-once:
// Snowflake Ingest SDK 2.x — open a channel and append rows with an offset token
SnowflakeStreamingIngestClient client =
    SnowflakeStreamingIngestClientFactory.builder("TELEMETRY_CLIENT")
        .setProperties(props)  // url, user, private_key, role
        .build();

OpenChannelRequest req = OpenChannelRequest.builder("TELEMETRY_CH_P0")
    .setDBName("TELEMETRY").setSchemaName("RAW").setTableName("TELEMETRY")
    .setOnErrorOption(OpenChannelRequest.OnErrorOption.CONTINUE)  // skip bad rows, keep going
    .build();

SnowflakeStreamingIngestChannel channel = client.openChannel(req);

// On restart, resume from the durable committed offset — this is exactly-once:
String lastToken = channel.getLatestCommittedOffsetToken();  // null on first open
long resumeFrom = (lastToken == null) ? 0 : Long.parseLong(lastToken) + 1;

for (TelemetryEvent e : sourceFrom(resumeFrom)) {
    Map<String, Object> row = Map.of(
        "VEHICLE_ID", e.vehicleId, "EVENT_TS", e.eventTs,
        "LAT", e.lat, "LON", e.lon, "SPEED_KMH", e.speed, "TEMP_C", e.tempC);
    // offsetToken = source sequence; Snowflake remembers the last committed one
    channel.insertRow(row, Long.toString(e.sequence));
}
OnErrorOption.CONTINUE skips an individual malformed row and keeps the channel alive (you inspect the returned InsertValidationResponse for the rejects); ABORT_ON_ERROR fails the batch. For a telemetry firehose you almost always want CONTINUE plus your own dead-letter capture, so one bad row never stalls a channel.
The channel operations you actually call (SDK) or rely on (connector), and what each is for:
| Operation | SDK call | What it does | When you use it |
|---|---|---|---|
| Open channel | client.openChannel(req) |
Creates/reopens a named channel on a table | Producer startup; connector does one per partition |
| Insert rows | channel.insertRow(s)(...) |
Appends rows with an optional offset token | The hot path; returns reject info |
| Get committed offset | getLatestCommittedOffsetToken() |
Returns the durable last-committed token | On restart, to resume exactly-once |
| Close channel | channel.close() |
Flushes and releases the channel | Graceful shutdown; flushes the buffer |
| On-error policy | OpenChannelRequest...setOnErrorOption |
CONTINUE (skip bad rows) or ABORT_ON_ERROR |
Choose per workload (firehose → CONTINUE) |
Operational characteristics to keep in mind (treat these as mechanisms, not memorized hard numbers — confirm against current Snowflake docs for your edition/architecture):
| Characteristic | Behavior | Practical implication |
|---|---|---|
| Commit cadence | Snowflake commits buffered rows on a seconds-scale cadence | Latency floor is max(client flush, commit cadence) |
| Channel-to-table | A channel targets exactly one table | One channel per partition per target table |
| Offset token scope | Per channel, durable, opaque string | Resume is per-channel, not global |
| Ordering | Rows ordered within a channel | Cross-channel order is not guaranteed |
| Throughput ceiling | Bounded per channel / per account | At high rate, the binding limit is the ceiling, not your buffer knob |
| Schema handling | Optional connector schematization | Auto-add columns from JSON, or pin a strict schema |
Streams — the CDC cursor in depth
A Stream is where most subtle bugs live, so enumerate its behavior precisely.
Create an append-only stream on the landing table (correct because the table is insert-only):
USE ROLE SYSADMIN;
USE SCHEMA TELEMETRY.RAW;

CREATE OR REPLACE STREAM RAW.TELEMETRY_STREAM
  ON TABLE RAW.TELEMETRY
  APPEND_ONLY = TRUE
  COMMENT = 'CDC cursor feeding the transform tasks';

-- Inspect without advancing the offset (SELECT does NOT move the cursor)
SELECT SYSTEM$STREAM_HAS_DATA('RAW.TELEMETRY_STREAM');     -- TRUE if unconsumed rows exist
SELECT VEHICLE_ID, EVENT_TS, TEMP_C, METADATA$ACTION, METADATA$ROW_ID
FROM   RAW.TELEMETRY_STREAM
LIMIT  20;

-- Stream health: is it stale, what's its offset, what type is it?
SHOW STREAMS LIKE 'TELEMETRY_STREAM' IN SCHEMA TELEMETRY.RAW;
SELECT SYSTEM$STREAM_GET_TABLE_TIMESTAMP('RAW.TELEMETRY_STREAM');  -- offset as a timestamp
The stream metadata columns and what each means:
| Column | Values | Meaning | How a transform uses it |
|---|---|---|---|
METADATA$ACTION |
INSERT, DELETE |
Direction of the change | Filter = 'INSERT'; apply deletes via MERGE |
METADATA$ISUPDATE |
TRUE/FALSE |
Is this row part of an update (delete+insert pair)? | Distinguish a real delete from an update’s delete leg |
METADATA$ROW_ID |
Opaque id | Stable row identity across changes | Dedup / correlate update pairs |
The three stream types and when each is correct:
| Stream type | Tracks | Use for | Cost / behavior |
|---|---|---|---|
| Standard (default) | Inserts, updates, deletes | Mutable source tables (CDC mirror) | Computes net change; more work |
| Append-only | Inserts only | Append-only landing tables (streaming targets) | Cheapest; ignores deletes/updates entirely |
| Insert-only | Inserts only, on external/directory tables | Streams over external tables / stages | For storage-backed tables |
The staleness rules — this is the part that silently loses data, so learn the exact mechanism:
| Property / setting | What it governs | Default | Failure if mis-set |
|---|---|---|---|
DATA_RETENTION_TIME_IN_DAYS (on the source table) |
Time-Travel window the stream depends on | 1 (Standard ed.), up to 90 (Enterprise+) | Too short + slow consumer → stream goes STALE |
MAX_DATA_EXTENSION_TIME_IN_DAYS |
How long Snowflake extends retention to keep a stream readable | 14 | If exceeded with no consumption → STALE |
STALE_AFTER (shown in SHOW STREAMS) |
Timestamp after which the stream becomes stale if unconsumed | derived | Past this with no consume → STALE, reads return ∅ |
STALE (SHOW STREAMS column) |
Whether the stream is currently stale | FALSE | TRUE = silent data loss until recreated |
The exactly-once guarantee, stated precisely: the stream’s offset advances only when a DML statement that selected from the stream commits. A Task’s INSERT INTO target SELECT ... FROM stream does exactly this. If that INSERT fails or rolls back, the offset does not advance, so the same rows are re-presented on the next run — at-least-once becomes exactly-once because the target write and the offset advance are one atomic transaction. The corollary is the poison-row hazard: if a single bad row makes the whole INSERT fail, the offset never advances and the pipeline stalls re-trying forever — which is why dead-lettering (below) is mandatory at scale.
Multiple consumers, one source: if two different Tasks both need the same new rows, give each its own stream on the table (streams are independent cursors). Two consumers sharing one stream will each advance it and steal rows from the other — a classic mistake.
Tasks — scheduling, DAGs, and serverless vs warehouse
Now the transformation plane. Build two targets, a Task that drains the stream into the enriched table, and a dependent Task that derives alerts.
USE ROLE SYSADMIN;

CREATE OR REPLACE TABLE ENRICHED.VEHICLE_STATE (
  VEHICLE_ID STRING, EVENT_TS TIMESTAMP_NTZ, LAT FLOAT, LON FLOAT,
  SPEED_KMH NUMBER(6,2), TEMP_C NUMBER(5,2), LOADED_AT TIMESTAMP_LTZ
);

CREATE OR REPLACE TABLE CURATED.COLD_CHAIN_ALERTS (
  VEHICLE_ID STRING, EVENT_TS TIMESTAMP_NTZ, TEMP_C NUMBER(5,2),
  THRESHOLD_C NUMBER(5,2), DETECTED_AT TIMESTAMP_LTZ
);

-- ROOT TASK: raw stream -> enriched, every minute, only when data exists
CREATE OR REPLACE TASK ENRICHED.T_LOAD_VEHICLE_STATE
  WAREHOUSE = WH_TELEMETRY_TRANSFORM
  SCHEDULE  = '1 MINUTE'
  WHEN SYSTEM$STREAM_HAS_DATA('TELEMETRY.RAW.TELEMETRY_STREAM')
AS
  INSERT INTO ENRICHED.VEHICLE_STATE
  SELECT VEHICLE_ID, EVENT_TS, LAT, LON, SPEED_KMH, TEMP_C, CURRENT_TIMESTAMP()
  FROM   TELEMETRY.RAW.TELEMETRY_STREAM
  WHERE  METADATA$ACTION = 'INSERT'
    AND  VEHICLE_ID IS NOT NULL;   -- cheap guard; full DLQ pattern shown later

-- DEPENDENT TASK: runs AFTER the root (no schedule of its own)
CREATE OR REPLACE TASK CURATED.T_DERIVE_COLD_CHAIN_ALERTS
  WAREHOUSE = WH_TELEMETRY_TRANSFORM
  AFTER ENRICHED.T_LOAD_VEHICLE_STATE
AS
  INSERT INTO CURATED.COLD_CHAIN_ALERTS
  SELECT VEHICLE_ID, EVENT_TS, TEMP_C, 8.00, CURRENT_TIMESTAMP()
  FROM   ENRICHED.VEHICLE_STATE
  WHERE  TEMP_C > 8.00
    AND  LOADED_AT > DATEADD('minute', -2, CURRENT_TIMESTAMP());
Tasks are created suspended. Resume leaf-to-root so the DAG is fully armed before the scheduler can fire the root against a not-yet-resumed child:
USE ROLE ACCOUNTADMIN;                                  -- EXECUTE TASK privilege
ALTER TASK CURATED.T_DERIVE_COLD_CHAIN_ALERTS RESUME;   -- child first
ALTER TASK ENRICHED.T_LOAD_VEHICLE_STATE      RESUME;   -- root last
The scheduling options, enumerated:
| Schedule form | Syntax | Use for | Notes |
|---|---|---|---|
| Interval | SCHEDULE = '1 MINUTE' |
Simple fixed cadence (1–11520 min) | Minimum 1 minute |
| Cron | SCHEDULE = 'USING CRON 0 * * * * UTC' |
Wall-clock times, time zones | Full cron; TZ-aware |
| Dependent | AFTER <parent>[, <parent2>] |
DAG ordering; runs after parents finish | No schedule of its own |
| Finalizer | FINALIZE = <root> |
Runs once after all leaves complete | Cleanup / marker rows |
| Manual | (no schedule) + EXECUTE TASK |
Backfills, ad-hoc, testing | Fire on demand |
Serverless vs warehouse execution — choose deliberately:
| Aspect | Warehouse task (WAREHOUSE = ...) |
Serverless task (USER_TASK_MANAGED_INITIAL_WAREHOUSE_SIZE) |
|---|---|---|
| Compute | Your named warehouse | Snowflake-managed, sized per run |
| Billing | Per-second while the warehouse runs | Per-run, on a serverless rate (often ~10–20% cheaper for short jobs) |
| Idle cost | Pay until AUTO_SUSPEND kicks in |
None between runs |
| Sizing | You pick (XS, S, …) | Starts at your initial hint; Snowflake adapts over time |
| Best for | Steady, predictable, larger transforms | Spiky, short, unpredictable transforms |
| Concurrency | Bounded by warehouse + queuing | Snowflake-managed |
| Privilege to run | EXECUTE TASK |
EXECUTE MANAGED TASK |
To make the root serverless, drop the WAREHOUSE line and set the size hint:
CREATE OR REPLACE TASK ENRICHED.T_LOAD_VEHICLE_STATE
  USER_TASK_MANAGED_INITIAL_WAREHOUSE_SIZE = 'XSMALL'   -- serverless
  SCHEDULE  = '1 MINUTE'
  WHEN SYSTEM$STREAM_HAS_DATA('TELEMETRY.RAW.TELEMETRY_STREAM')
AS
  INSERT INTO ENRICHED.VEHICLE_STATE SELECT ...;
Other Task parameters worth knowing:
| Parameter | What it does | Default | When to change |
|---|---|---|---|
USER_TASK_TIMEOUT_MS |
Max run time before the task is cancelled | 3600000 (1 h) | Lower to fail fast on a hung run |
SUSPEND_TASK_AFTER_NUM_FAILURES |
Auto-suspend the root after N consecutive failures | 0 (off) → set it | Set to 3–5 so a broken task doesn’t burn credits forever |
ALLOW_OVERLAPPING_EXECUTION |
Allow a run to start before the previous finishes | FALSE | Keep FALSE for stream consumers (avoids double-consume races) |
ERROR_INTEGRATION |
Send task errors to a notification integration | none | Wire to email/queue for alerting |
SCHEDULE precision |
Interval or cron | — | Cron for time-zone-aware windows |
Keep ALLOW_OVERLAPPING_EXECUTION = FALSE for any task that consumes a stream — overlapping runs race the offset; the default serialization is what keeps consumption clean.
Dead-letter and error handling — never stall on a poison row
Because the stream offset only advances on a committed transaction, one un-castable row in a batch can fail the INSERT and stall the whole pipeline (the same bad batch re-presents forever). The fix is to make the transform total — every row either lands in the target or in a dead-letter table, and the statement always commits.
CREATE OR REPLACE TABLE RAW.TELEMETRY_DLQ (
  RAW_ROW VARIANT, ERROR_REASON STRING, METADATA$ROW_ID STRING,
  DEAD_AT TIMESTAMP_LTZ DEFAULT CURRENT_TIMESTAMP()
);

-- A multi-table transform via a stored proc so good + bad rows are one transaction
CREATE OR REPLACE PROCEDURE ENRICHED.SP_LOAD_VEHICLE_STATE()
RETURNS STRING LANGUAGE SQL AS
$$
BEGIN
  BEGIN TRANSACTION;

  -- good rows: types valid
  INSERT INTO ENRICHED.VEHICLE_STATE
  SELECT VEHICLE_ID, EVENT_TS, LAT, LON, SPEED_KMH, TEMP_C, CURRENT_TIMESTAMP()
  FROM   TELEMETRY.RAW.TELEMETRY_STREAM
  WHERE  METADATA$ACTION = 'INSERT'
    AND  VEHICLE_ID IS NOT NULL
    AND  TRY_TO_TIMESTAMP_NTZ(EVENT_TS::STRING) IS NOT NULL
    AND  TRY_TO_DOUBLE(LAT::STRING) IS NOT NULL;

  -- bad rows: same stream read, complementary predicate -> DLQ
  INSERT INTO RAW.TELEMETRY_DLQ (RAW_ROW, ERROR_REASON, METADATA$ROW_ID)
  SELECT OBJECT_CONSTRUCT('VEHICLE_ID', VEHICLE_ID, 'EVENT_TS', EVENT_TS,
                          'LAT', LAT, 'TEMP_C', TEMP_C),
         'validation_failed', METADATA$ROW_ID
  FROM   TELEMETRY.RAW.TELEMETRY_STREAM
  WHERE  METADATA$ACTION = 'INSERT'
    AND ( VEHICLE_ID IS NULL
       OR TRY_TO_TIMESTAMP_NTZ(EVENT_TS::STRING) IS NULL
       OR TRY_TO_DOUBLE(LAT::STRING) IS NULL );

  COMMIT;   -- both inserts commit together -> stream offset advances exactly once
  RETURN 'ok';
EXCEPTION WHEN OTHER THEN
  ROLLBACK; RAISE;   -- on a real error, offset does NOT advance -> safe retry
END;
$$;
One robustness note: the proc above references the stream twice (good + bad). To avoid double-consume surprises, snapshot the stream once into a temp table at the top of the transaction, then split from that snapshot:
-- Safer: snapshot the stream once, then partition the snapshot
CREATE OR REPLACE TEMPORARY TABLE _BATCH AS
  SELECT *, METADATA$ACTION AS _ACT, METADATA$ROW_ID AS _RID
  FROM TELEMETRY.RAW.TELEMETRY_STREAM;   -- this consume advances the offset on commit
-- ... then INSERT good rows and DLQ rows from _BATCH, all in one transaction
The dead-letter design choices:
| Strategy | Mechanism | Pros | Cons |
|---|---|---|---|
Inline TRY_CAST filter |
WHERE TRY_TO_* IS NOT NULL splits good/bad |
Simple; one statement | Coarse reason; drops detail |
| Stored-proc transaction | Snapshot stream → split → commit | Atomic, exact-once, rich reasons | More code |
| Connector DLQ (Kafka) | errors.deadletterqueue.topic.name |
Bad records never reach Snowflake | Lives in Kafka; separate reprocessing |
ON_ERROR (SDK) |
OnErrorOption.CONTINUE + reject inspect |
Row-level skip at ingest | Need your own capture of rejects |
| Quarantine + replay | DLQ table + scheduled re-validate task | Reprocess after a fix | Extra pipeline to operate |
The reprocessing loop is itself a small Task: periodically re-validate TELEMETRY_DLQ rows against the (possibly fixed) schema and move the now-valid ones into VEHICLE_STATE, deleting them from the DLQ — so a schema fix automatically heals the backlog.
Dynamic Tables — the declarative alternative
For the per-vehicle-state layer specifically, you could skip the Stream and the Task entirely and declare a Dynamic Table whose query is the transform, with a freshness target. Snowflake manages the incremental refresh.
CREATE OR REPLACE DYNAMIC TABLE ENRICHED.VEHICLE_STATE_DT
  TARGET_LAG = '1 minute'
  WAREHOUSE  = WH_TELEMETRY_TRANSFORM    -- or omit for serverless DT refresh
AS
  SELECT VEHICLE_ID, EVENT_TS, LAT, LON, SPEED_KMH, TEMP_C
  FROM   TELEMETRY.RAW.TELEMETRY
  WHERE  VEHICLE_ID IS NOT NULL;

-- Chain a second DT off the first; DOWNSTREAM means "as fresh as my consumers need"
CREATE OR REPLACE DYNAMIC TABLE CURATED.COLD_CHAIN_ALERTS_DT
  TARGET_LAG = 'DOWNSTREAM'
  WAREHOUSE  = WH_TELEMETRY_TRANSFORM
AS
  SELECT VEHICLE_ID, EVENT_TS, TEMP_C, 8.00 AS THRESHOLD_C
  FROM   ENRICHED.VEHICLE_STATE_DT
  WHERE  TEMP_C > 8.00;

-- Inspect refresh behavior and whether it incrementalized
SELECT NAME, TARGET_LAG_SEC, SCHEDULING_STATE, LAST_SUCCESSFUL_REFRESH
FROM   TABLE(INFORMATION_SCHEMA.DYNAMIC_TABLES());
SELECT * FROM TABLE(INFORMATION_SCHEMA.DYNAMIC_TABLE_REFRESH_HISTORY(
  NAME_PREFIX => 'ENRICHED.VEHICLE_STATE_DT'))
ORDER BY DATA_TIMESTAMP DESC;
Stream+Task vs Dynamic Table — the real decision matrix:
| Dimension | Streams + Tasks | Dynamic Tables |
|---|---|---|
| Programming model | Imperative (you write INSERT/MERGE) |
Declarative (you write the SELECT) |
| Freshness control | You set the Task schedule | TARGET_LAG (or DOWNSTREAM) |
| Incrementalization | You design it (stream = the delta) | Automatic where the query allows; else full refresh |
| Side effects (DLQ, calls) | Yes — full procedural control | No — pure query result only |
| Multi-step ordering | Explicit DAG with AFTER/finalizer |
DAG inferred from DT dependencies |
MERGE / upsert semantics |
Native | Expressed as the query’s result set |
| Operational surface | Tasks, streams, warehouses | Dynamic tables + refresh history |
| Best for | Procedural pipelines, dead-letter, precise control | Declarative transforms where “keep fresh” is the spec |
| When it surprises you | Stream staleness, offset bugs | A query shape forcing full (not incremental) refresh |
A practical hybrid is common: Snowpipe Streaming → raw table → Dynamic Tables for the clean declarative layers, but keep a Stream + Task for anything that needs a dead-letter side effect, an external API call, or a MERGE against an existing dimension. The streaming ingestion layer is identical either way; only the transform plane changes.
Architecture at a glance
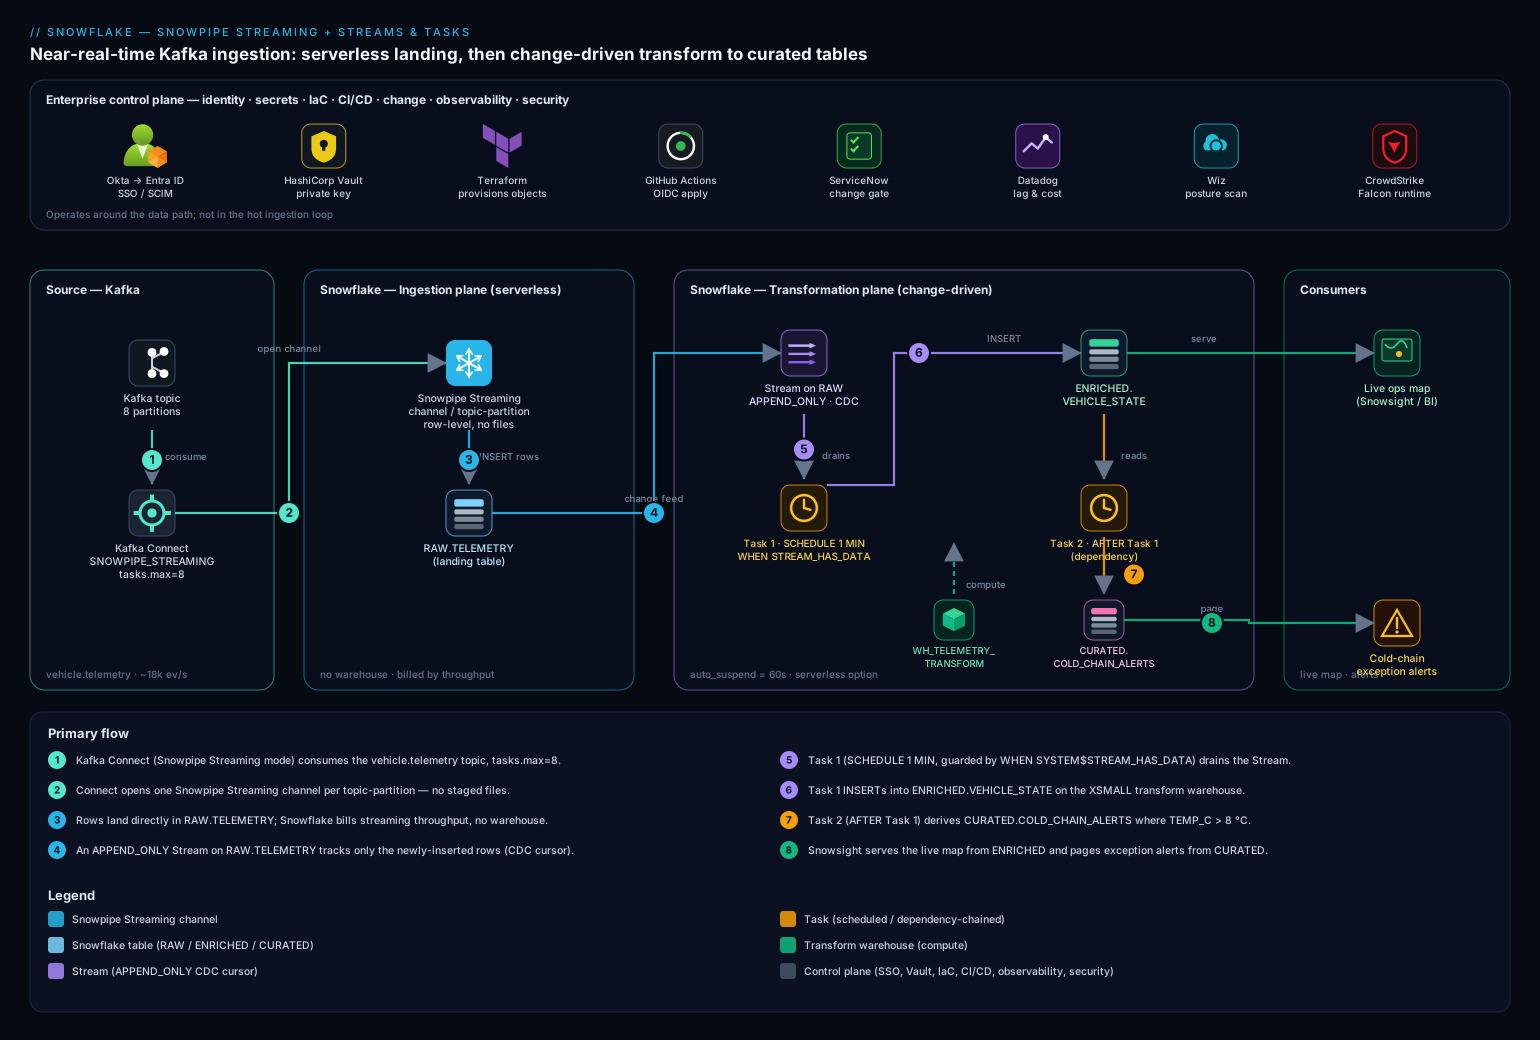
Two planes share the account but run on different clocks. The ingestion plane is push-driven and serverless: Kafka Connect opens one Snowpipe Streaming channel per topic-partition and streams rows straight into RAW.TELEMETRY with no compute warehouse involved — Snowflake bills the streaming throughput directly, and each channel carries an offset token so a connector restart resumes exactly where it left off. The transformation plane is change-driven: an append-only Stream on RAW.TELEMETRY tracks unconsumed rows, and a chain of Tasks (on a small dedicated warehouse, or serverless) drains the Stream every minute into ENRICHED.VEHICLE_STATE, then a dependent Task derives CURATED.COLD_CHAIN_ALERTS. The WHEN SYSTEM$STREAM_HAS_DATA guard means empty minutes cost nothing. A Dynamic Table branch is shown as the declarative alternative to the same Stream-and-Task hop.
Around the data path sit the controls the platform team actually operates: Okta → Entra ID federates human SSO into Snowsight with SCIM-provisioned roles, kept entirely separate from the SVC_TELEMETRY_INGEST key-pair service identity; HashiCorp Vault issues the connector’s private key and Snowflake login so no secret lands in a Kafka Connect config file; Terraform provisions every Snowflake object declaratively; Datadog scrapes the connector’s JMX metrics and Snowflake’s SNOWPIPE_STREAMING_* and TASK_HISTORY views for lag and cost; GitHub Actions applies the Terraform and SQL through an OIDC-authenticated pipeline; and ServiceNow is the change gate before a new Task or schema goes live. Follow the diagram left to right: Kafka partitions → per-partition channels → raw table → (Stream → Tasks → enriched → curated) or (Dynamic Tables), with the offset token on the ingest side and the stream offset on the transform side as the two “memory” markers that make the whole thing exactly-once.
Provision the Snowflake objects with Terraform
Create the database, schemas, a dedicated transform warehouse, and a least-privilege role. Keep this in version control; the GitHub Actions pipeline applies it.
# main.tf — Snowflake-Labs/snowflake provider
terraform {
  required_providers {
    snowflake = { source = "Snowflake-Labs/snowflake", version = "~> 0.95" }
  }
}

resource "snowflake_database" "telemetry" { name = "TELEMETRY" }

resource "snowflake_schema" "raw"      { database = snowflake_database.telemetry.name, name = "RAW" }
resource "snowflake_schema" "enriched" { database = snowflake_database.telemetry.name, name = "ENRICHED" }
resource "snowflake_schema" "curated"  { database = snowflake_database.telemetry.name, name = "CURATED" }

# A small, dedicated warehouse for the transform tasks (separate from BI/ad-hoc)
resource "snowflake_warehouse" "transform" {
  name                = "WH_TELEMETRY_TRANSFORM"
  warehouse_size      = "XSMALL"
  auto_suspend        = 60      # seconds; suspend fast between task runs
  auto_resume         = true
  initially_suspended = true
}

# Role the connector and the tasks run as
resource "snowflake_role" "ingest" { name = "ROLE_TELEMETRY_INGEST" }

resource "snowflake_grant_privileges_to_account_role" "db_usage" {
  account_role_name = snowflake_role.ingest.name
  privileges        = ["USAGE"]
  on_account_object { object_type = "DATABASE", object_name = snowflake_database.telemetry.name }
}

resource "snowflake_grant_privileges_to_account_role" "wh_usage" {
  account_role_name = snowflake_role.ingest.name
  privileges        = ["USAGE", "OPERATE"]
  on_account_object { object_type = "WAREHOUSE", object_name = snowflake_warehouse.transform.name }
}
terraform init
terraform plan  -out=telemetry.plan
terraform apply telemetry.plan
The auto_suspend = 60 matters: the transform warehouse should resume only when a Task fires and suspend the instant it idles, so you pay for seconds of compute per minute, not a running warehouse. Set the raw table’s retention generously (next section) so the Stream survives a long Task outage.
Real-world scenario
Frostline Logistics (a fictional but representative cold-chain carrier) ran 40,000 refrigerated vehicles and an hourly batch: a Kafka topic dumped to S3 every hour, a Snowflake COPY job loaded it, and a scheduled query rebuilt a “current state” table with a full-table MERGE over 90 million rows. The operations desk complained that a trailer could breach temperature at 09:05 and they wouldn’t see it until the 10:00 dashboard refresh — a 55-minute blind spot on perishable cargo worth lakhs per truck. The hourly MERGE ran on a Medium warehouse for ~6 minutes every hour and a separate always-on Small warehouse backed the dashboard, together burning roughly 48 credits/day (~₹13,000/day at their rate) for data that was still an hour stale.
The redesign was this article’s pipeline. They switched the Kafka sink to the Snowflake connector in SNOWPIPE_STREAMING mode (8 partitions → 8 channels, buffer.flush.time=1), landed rows into RAW.TELEMETRY, put an append-only Stream on it, and ran a serverless Task every minute gated on SYSTEM$STREAM_HAS_DATA to drain the stream into ENRICHED.VEHICLE_STATE, with a dependent Task deriving COLD_CHAIN_ALERTS. The first cut went live in a week.
Two things bit them in week one — both in this guide’s troubleshooting section. First, a stale stream. A bad deploy left the root Task suspended over a weekend; the raw table’s retention was the default 1 day; by Monday the stream’s offset had fallen outside the window and it had gone STALE = TRUE. The Task, once resumed, read nothing — 36 hours of telemetry sat in RAW.TELEMETRY but invisible to the stream — and the dashboard quietly under-counted. They caught it because Datadog alerted on TASK_HISTORY showing zero rows processed despite a busy connector. The fix: bump DATA_RETENTION_TIME_IN_DAYS on the raw table to 3, recreate the stream and one-time backfill the gap from the raw table by event timestamp, and set SUSPEND_TASK_AFTER_NUM_FAILURES so a future broken Task pages instead of silently sleeping. Second, a poison row. A firmware bug on a batch of trailers emitted TEMP_C as the string "ERR"; the INSERT failed type conversion, the stream offset never advanced, and the pipeline stalled re-trying the same bad batch — ingestion lag climbed from 40 seconds to 20 minutes in an hour. They added the TRY_CAST dead-letter split (good rows to VEHICLE_STATE, bad rows to TELEMETRY_DLQ), the stall cleared instantly, and the firmware team got a clean quarantine table to debug from.
After stabilization, steady-state compute was the serverless Task running ~3–8 seconds per minute when data flowed, plus the streaming throughput charge — about 5 credits/day (~₹1,400/day), an ~89% drop, while latency went from 55 minutes to under 90 seconds end-to-end. The operations desk got their live map; the cold-chain alert that used to surface an hour late now pages in well under two minutes; and the finance team got a Datadog panel showing exactly what real-time visibility costs per day so they could trade buffer.flush.time and the Task cadence against it.
Advantages and disadvantages
| Advantages | Disadvantages |
|---|---|
| Sub-second to single-digit-second landing with no files | Requires Enterprise edition (Streams, Tasks, serverless, DT) |
| No warehouse in the ingest path — throughput-billed | Streaming has a steady per-client charge even when idle |
Empty Task ticks cost zero compute (STREAM_HAS_DATA) |
Stream staleness is silent — needs monitoring discipline |
| Exactly-once via offset tokens (ingest) + transactional consume (transform) | Poison rows stall the pipeline unless you dead-letter |
| Native CDC (Streams) — no full-table re-scans | Standard streams on mutable tables add compute |
| Serverless Tasks / Dynamic Tables remove warehouse sizing | Dynamic Tables can silently fall back to full refresh |
Declarative TARGET_LAG option (Dynamic Tables) |
Two “memory” markers (offset token + stream offset) to reason about |
| All objects are SQL/Terraform-manageable, version-controllable | DAG resume order (leaf→root) is a footgun if forgotten |
When each matters: the no-warehouse ingest + zero-cost empty ticks advantage is decisive for spiky workloads (idle nights, burst days) — it’s the difference between a few credits a day and a credit-hour. The silent staleness disadvantage is the one that hurts most in production and is entirely preventable with retention sizing + a “rows-processed” alert. Choose Dynamic Tables when the transform is a clean SELECT and “keep it within a minute” is the whole spec; choose Streams + Tasks the moment you need a dead-letter, a MERGE, or any side effect.
Hands-on lab
Build the whole pipeline end to end with simulated streaming (we use a SQL generator instead of standing up Kafka, so the lab is free-tier-friendly and self-contained), prove each plane works, induce-and-fix a stale stream and a poison row, then tear down. Runs in Snowsight worksheets on any Enterprise trial account. Where the connector would normally open channels, we insert rows directly — the Stream and Task behavior is identical, because Snowpipe Streaming writes into an ordinary table exactly as our generator does.
Step 1 — Database, schemas, warehouse, role.
USE ROLE ACCOUNTADMIN;
CREATE DATABASE IF NOT EXISTS TELEMETRY;
CREATE SCHEMA   IF NOT EXISTS TELEMETRY.RAW;
CREATE SCHEMA   IF NOT EXISTS TELEMETRY.ENRICHED;
CREATE SCHEMA   IF NOT EXISTS TELEMETRY.CURATED;

CREATE WAREHOUSE IF NOT EXISTS WH_TELEMETRY_TRANSFORM
  WAREHOUSE_SIZE = 'XSMALL' AUTO_SUSPEND = 60 AUTO_RESUME = TRUE INITIALLY_SUSPENDED = TRUE;
Expected: each object created (or “already exists”). A SHOW WAREHOUSES LIKE 'WH_TELEMETRY_TRANSFORM' shows size = X-Small, auto_suspend = 60.
Step 2 — Raw landing table with generous retention. Generous retention is what keeps the Stream from going stale.
USE SCHEMA TELEMETRY.RAW;
CREATE OR REPLACE TABLE RAW.TELEMETRY (
  VEHICLE_ID  STRING,
  EVENT_TS    TIMESTAMP_NTZ,
  LAT         FLOAT,
  LON         FLOAT,
  SPEED_KMH   NUMBER(6,2),
  TEMP_C      VARIANT,                 -- VARIANT on purpose, to allow a poison row later
  LOADED_AT   TIMESTAMP_LTZ DEFAULT CURRENT_TIMESTAMP()
) DATA_RETENTION_TIME_IN_DAYS = 3;     -- comfortably exceeds any task outage
Step 3 — Append-only Stream (the CDC cursor).
CREATE OR REPLACE STREAM RAW.TELEMETRY_STREAM ON TABLE RAW.TELEMETRY APPEND_ONLY = TRUE;
SELECT SYSTEM$STREAM_HAS_DATA('RAW.TELEMETRY_STREAM');   -- expect FALSE (no rows yet)
Step 4 — Targets + the dead-letter table.
CREATE OR REPLACE TABLE TELEMETRY.ENRICHED.VEHICLE_STATE (
  VEHICLE_ID STRING, EVENT_TS TIMESTAMP_NTZ, LAT FLOAT, LON FLOAT,
  SPEED_KMH NUMBER(6,2), TEMP_C NUMBER(5,2), LOADED_AT TIMESTAMP_LTZ);

CREATE OR REPLACE TABLE TELEMETRY.CURATED.COLD_CHAIN_ALERTS (
  VEHICLE_ID STRING, EVENT_TS TIMESTAMP_NTZ, TEMP_C NUMBER(5,2),
  THRESHOLD_C NUMBER(5,2), DETECTED_AT TIMESTAMP_LTZ);

CREATE OR REPLACE TABLE TELEMETRY.RAW.TELEMETRY_DLQ (
  RAW_ROW VARIANT, ERROR_REASON STRING, DEAD_AT TIMESTAMP_LTZ DEFAULT CURRENT_TIMESTAMP());
Step 5 — The transform as a total stored proc (good rows + DLQ in one transaction).
CREATE OR REPLACE PROCEDURE TELEMETRY.ENRICHED.SP_LOAD_VEHICLE_STATE()
RETURNS STRING LANGUAGE SQL AS
$$
BEGIN
  -- snapshot the stream ONCE; the consume advances the offset on commit
  CREATE OR REPLACE TEMPORARY TABLE _BATCH AS
    SELECT * FROM TELEMETRY.RAW.TELEMETRY_STREAM WHERE METADATA$ACTION = 'INSERT';

  INSERT INTO TELEMETRY.ENRICHED.VEHICLE_STATE
  SELECT VEHICLE_ID, EVENT_TS, LAT, LON, SPEED_KMH,
         TRY_TO_NUMBER(TEMP_C::STRING, 5, 2), CURRENT_TIMESTAMP()
  FROM   _BATCH
  WHERE  TRY_TO_NUMBER(TEMP_C::STRING, 5, 2) IS NOT NULL AND VEHICLE_ID IS NOT NULL;

  INSERT INTO TELEMETRY.RAW.TELEMETRY_DLQ (RAW_ROW, ERROR_REASON)
  SELECT OBJECT_CONSTRUCT('VEHICLE_ID', VEHICLE_ID, 'TEMP_C', TEMP_C), 'bad_temp'
  FROM   _BATCH
  WHERE  TRY_TO_NUMBER(TEMP_C::STRING, 5, 2) IS NULL OR VEHICLE_ID IS NULL;

  RETURN 'loaded';
END;
$$;
Step 6 — The Task DAG (root drains stream; child derives alerts).
CREATE OR REPLACE TASK TELEMETRY.ENRICHED.T_LOAD_VEHICLE_STATE
  WAREHOUSE = WH_TELEMETRY_TRANSFORM
  SCHEDULE  = '1 MINUTE'
  SUSPEND_TASK_AFTER_NUM_FAILURES = 3
  WHEN SYSTEM$STREAM_HAS_DATA('TELEMETRY.RAW.TELEMETRY_STREAM')
AS CALL TELEMETRY.ENRICHED.SP_LOAD_VEHICLE_STATE();

CREATE OR REPLACE TASK TELEMETRY.CURATED.T_DERIVE_COLD_CHAIN_ALERTS
  WAREHOUSE = WH_TELEMETRY_TRANSFORM
  AFTER TELEMETRY.ENRICHED.T_LOAD_VEHICLE_STATE
AS
  INSERT INTO TELEMETRY.CURATED.COLD_CHAIN_ALERTS
  SELECT VEHICLE_ID, EVENT_TS, TEMP_C, 8.00, CURRENT_TIMESTAMP()
  FROM   TELEMETRY.ENRICHED.VEHICLE_STATE
  WHERE  TEMP_C > 8.00 AND LOADED_AT > DATEADD('minute', -2, CURRENT_TIMESTAMP());

-- arm the DAG leaf-to-root
ALTER TASK TELEMETRY.CURATED.T_DERIVE_COLD_CHAIN_ALERTS RESUME;
ALTER TASK TELEMETRY.ENRICHED.T_LOAD_VEHICLE_STATE      RESUME;
Step 7 — Simulate the stream (stand in for Snowpipe Streaming). Insert a batch of good rows plus a couple of breaches.
INSERT INTO TELEMETRY.RAW.TELEMETRY (VEHICLE_ID, EVENT_TS, LAT, LON, SPEED_KMH, TEMP_C)
SELECT 'VH-' || LPAD(SEQ4(), 4, '0'),
       DATEADD('second', -UNIFORM(0, 60, RANDOM()), CURRENT_TIMESTAMP()::TIMESTAMP_NTZ),
       12.9 + UNIFORM(0, 100, RANDOM())/1000, 77.5 + UNIFORM(0, 100, RANDOM())/1000,
       UNIFORM(0, 90, RANDOM()),
       TO_VARIANT(2.0 + UNIFORM(0, 900, RANDOM())/100)     -- mostly 2–11 °C
FROM   TABLE(GENERATOR(ROWCOUNT => 5000));

SELECT SYSTEM$STREAM_HAS_DATA('TELEMETRY.RAW.TELEMETRY_STREAM');   -- now TRUE
Step 8 — Run the DAG immediately (don’t wait for the minute) and validate.
EXECUTE TASK TELEMETRY.ENRICHED.T_LOAD_VEHICLE_STATE;   -- fires the root + dependent

-- give it a few seconds, then check both planes
SELECT COUNT(*) AS enriched_rows FROM TELEMETRY.ENRICHED.VEHICLE_STATE;   -- ~5000
SELECT COUNT(*) AS alert_rows    FROM TELEMETRY.CURATED.COLD_CHAIN_ALERTS; -- the >8°C subset
SELECT COUNT(*) AS dlq_rows      FROM TELEMETRY.RAW.TELEMETRY_DLQ;          -- 0 so far
SELECT SYSTEM$STREAM_HAS_DATA('TELEMETRY.RAW.TELEMETRY_STREAM');            -- FALSE (drained)
Expected: ~5000 enriched rows, a few hundred alert rows (the random >8 °C tail), DLQ empty, stream drained to FALSE. Confirm the Task ran:
SELECT NAME, STATE, SCHEDULED_TIME, COMPLETED_TIME, ERROR_MESSAGE
FROM   TABLE(INFORMATION_SCHEMA.TASK_HISTORY(
         SCHEDULED_TIME_RANGE_START => DATEADD('hour', -1, CURRENT_TIMESTAMP())))
ORDER  BY SCHEDULED_TIME DESC;
Step 9 — Induce a poison row and watch the dead-letter catch it.
INSERT INTO TELEMETRY.RAW.TELEMETRY (VEHICLE_ID, EVENT_TS, TEMP_C)
VALUES ('VH-DEAD', CURRENT_TIMESTAMP()::TIMESTAMP_NTZ, TO_VARIANT('ERR'));  -- un-castable temp

EXECUTE TASK TELEMETRY.ENRICHED.T_LOAD_VEHICLE_STATE;

SELECT COUNT(*) FROM TELEMETRY.RAW.TELEMETRY_DLQ;     -- 1 — the poison row is quarantined
SELECT SYSTEM$STREAM_HAS_DATA('TELEMETRY.RAW.TELEMETRY_STREAM');  -- FALSE — NOT stalled
This proves the design: the bad row went to the DLQ, the transaction still committed, the stream offset advanced, and the pipeline did not stall. (Compare: a naïve INSERT with a hard TEMP_C::NUMBER cast would have failed, left the offset un-advanced, and re-presented the bad row forever.)
Step 10 — Induce stream staleness (the silent-data-loss failure). Recreate a stream and let its offset fall behind by setting retention to the minimum, then querying staleness.
-- A fresh demo stream, then simulate "no consumption past retention" via SHOW
CREATE OR REPLACE STREAM RAW.DEMO_STREAM ON TABLE RAW.TELEMETRY APPEND_ONLY = TRUE;
SHOW STREAMS LIKE 'DEMO_STREAM' IN SCHEMA TELEMETRY.RAW;
-- Inspect STALE and STALE_AFTER in the result; STALE=false now.
-- In production, STALE flips to true once STALE_AFTER passes with no committed consume.
SELECT "name", "stale", "stale_after", "mode"
FROM TABLE(RESULT_SCAN(LAST_QUERY_ID()));
The lab can’t fast-forward Time Travel, but the validation is the check: monitoring "stale" from SHOW STREAMS (and alerting when it’s true) is exactly how you catch this in production. Drop the demo stream after.
Step 11 — Validation checklist.
| What you built | What it proves | The production analogue |
|---|---|---|
| Append-only stream on a landing table | CDC without full-table scans | The Snowpipe Streaming target’s delta feed |
Task gated on STREAM_HAS_DATA |
Empty ticks cost zero compute | The core cost control |
| Stored-proc transactional transform | Exactly-once: good + bad rows commit together | Poison-row resilience at scale |
| Poison row → DLQ, no stall | One bad event never blocks the batch | The firmware-"ERR" incident |
SHOW STREAMS staleness check |
You can detect silent data loss | The weekend-suspended-Task incident |
Step 12 — Teardown (children first).
ALTER TASK TELEMETRY.ENRICHED.T_LOAD_VEHICLE_STATE      SUSPEND;
ALTER TASK TELEMETRY.CURATED.T_DERIVE_COLD_CHAIN_ALERTS SUSPEND;
DROP TASK   IF EXISTS TELEMETRY.CURATED.T_DERIVE_COLD_CHAIN_ALERTS;
DROP TASK   IF EXISTS TELEMETRY.ENRICHED.T_LOAD_VEHICLE_STATE;
DROP STREAM IF EXISTS TELEMETRY.RAW.TELEMETRY_STREAM;
DROP DATABASE IF EXISTS TELEMETRY;          -- removes all schemas/tables/DLQ
DROP WAREHOUSE IF EXISTS WH_TELEMETRY_TRANSFORM;
Cost note. This lab uses an XSMALL warehouse for seconds at a time and a handful of EXECUTE TASK calls; on a trial account it consumes a fraction of a credit. Dropping the database and warehouse stops every charge.
Monitoring the pipeline
Before the troubleshooting playbook, know exactly which view answers which question — half of diagnosis is looking in the right place. Every one of these is a TABLE(INFORMATION_SCHEMA....) function or ACCOUNT_USAGE view; Datadog scrapes them on a schedule plus the connector’s JMX metrics.
| What you want to know | Where to look | Key columns / signal |
|---|---|---|
| Did Tasks run, succeed, skip? | INFORMATION_SCHEMA.TASK_HISTORY() |
STATE (SUCCEEDED/FAILED/SKIPPED), ERROR_MESSAGE, SCHEDULED_TIME vs COMPLETED_TIME |
| Is the stream stale / does it have data? | SHOW STREAMS; SYSTEM$STREAM_HAS_DATA() |
stale, stale_after, mode; boolean has-data |
| Streaming throughput / ingest history | SNOWPIPE_STREAMING_* / streaming history views |
Rows/bytes ingested, client activity |
| Warehouse credits burned (incl. idle) | ACCOUNT_USAGE.WAREHOUSE_METERING_HISTORY |
CREDITS_USED per warehouse per hour |
| Serverless task credits | ACCOUNT_USAGE.SERVERLESS_TASK_HISTORY |
CREDITS_USED per task |
| Dynamic Table refresh behavior | INFORMATION_SCHEMA.DYNAMIC_TABLE_REFRESH_HISTORY() |
REFRESH_ACTION (INCREMENTAL/FULL), lag |
| End-to-end ingest lag | the raw table directly | DATEDIFF('second', MAX(EVENT_TS), MAX(LOADED_AT)) |
| Connector health / record errors | Kafka Connect REST + JMX | task state, record-error-rate, buffer flush latency |
The three queries you keep pinned during an incident:
-- (a) Did the tasks run and consume the stream?
SELECT NAME, STATE, SCHEDULED_TIME, COMPLETED_TIME, ERROR_MESSAGE
FROM   TABLE(INFORMATION_SCHEMA.TASK_HISTORY(
         SCHEDULED_TIME_RANGE_START => DATEADD('hour', -1, CURRENT_TIMESTAMP())))
ORDER  BY SCHEDULED_TIME DESC;

-- (b) Is the stream stale, and does it have data right now?
SHOW STREAMS IN SCHEMA TELEMETRY.RAW;
SELECT SYSTEM$STREAM_HAS_DATA('TELEMETRY.RAW.TELEMETRY_STREAM');

-- (c) End-to-end freshness: how far behind real time is the latest landed row?
SELECT COUNT(*) rows_total, MAX(LOADED_AT) last_load,
       DATEDIFF('second', MAX(EVENT_TS), MAX(LOADED_AT)) ingest_lag_s
FROM   TELEMETRY.RAW.TELEMETRY;
Common mistakes & troubleshooting
The two failures that actually page you are stream staleness (silent data loss) and ingestion lag (freshness SLO breach); both have several root causes. First the scannable playbook, then the expanded reasoning for the ones that bite hardest.
| # | Symptom | Root cause | Confirm (exact command) | Fix |
|---|---|---|---|---|
| 1 | Task runs, processes 0 rows, but the connector is busy | Stream went STALE (offset past retention) | SHOW STREAMS → "stale" = true; SELECT SYSTEM$STREAM_HAS_DATA(...) = FALSE despite new rows |
Raise DATA_RETENTION_TIME_IN_DAYS; recreate stream; backfill the gap by EVENT_TS |
| 2 | Ingestion lag climbing; same batch retried forever | Poison row fails the INSERT; offset never advances |
TASK_HISTORY shows repeated FAILED with a cast/type error |
Add TRY_CAST DLQ split so the txn commits; quarantine bad rows |
| 3 | Lag grows steadily under load; Task runs every minute | Batch per run > what XS warehouse drains in the interval | TASK_HISTORY COMPLETED_TIME - SCHEDULED_TIME approaching the schedule |
Scale warehouse up, or shorten schedule, or serverless (auto-sizes) |
| 4 | New rows in raw table never appear downstream | Root Task suspended (or never resumed) | SHOW TASKS → root state = suspended |
ALTER TASK ... RESUME (leaf→root); check SUSPEND_TASK_AFTER_NUM_FAILURES didn’t trip |
| 5 | Duplicate rows downstream | Two consumers on one stream, or overlapping task runs | Count vs distinct on a natural key; ALLOW_OVERLAPPING_EXECUTION = true |
One stream per consumer; keep overlap = FALSE |
| 6 | Connector RUNNING but no rows land |
Channel/auth/role problem; rows buffered not committed | Connector status RUNNING but SNOWPIPE_STREAMING view shows no ingest; check role INSERT grant |
Grant INSERT on the table to the ingest role; verify key-pair JWT |
| 7 | Dependent Task never runs | Root skipped (WHEN false) so the DAG didn’t fire |
TASK_HISTORY shows root SKIPPED |
Expected when no data; if data exists, fix the WHEN predicate / stream name |
| 8 | Costs higher than expected at idle | Empty ticks resuming the warehouse | WAREHOUSE_METERING_HISTORY shows runs on idle minutes |
Add/repair WHEN SYSTEM$STREAM_HAS_DATA; lower AUTO_SUSPEND |
| 9 | Dynamic Table refresh slow / full each time | Query shape can’t incrementalize → full refresh | DYNAMIC_TABLE_REFRESH_HISTORY shows REFRESH_ACTION = FULL |
Rewrite to an incrementalizable shape, or move to Stream+Task |
| 10 | INSERT ... FROM stream returns more/fewer rows than expected |
Standard stream net-change semantics (update = delete+insert) | Inspect METADATA$ACTION/METADATA$ISUPDATE distribution |
Use append-only stream for insert-only tables; filter METADATA$ACTION |
| 11 | Connector lag spikes after a rebalance | Kafka partition rebalance reopened channels | Connect logs show task reassignment; consumer-group lag jumps | Stabilize the group; ensure tasks.max ≤ partitions; let channels recover |
| 12 | Schema unexpectedly grew new columns | snowflake.enable.schematization = true auto-added fields |
DESCRIBE TABLE shows new columns matching a new JSON field |
Disable schematization for strict schemas; pin the table shape |
The expanded form for the high-severity ones:
1. The Task runs but processes zero rows while the connector is clearly busy — a stale stream.
Root cause: The stream’s offset fell outside the source table’s Time-Travel window because nothing consumed it for longer than DATA_RETENTION_TIME_IN_DAYS (extended by MAX_DATA_EXTENSION_TIME_IN_DAYS). The stream is now STALE = TRUE; reading it returns nothing — and there is no error, just silence.
Confirm: SHOW STREAMS LIKE '...' and read the "stale" and "stale_after" columns; SELECT SYSTEM$STREAM_HAS_DATA('...') returns FALSE even though SELECT MAX(LOADED_AT) FROM raw_table shows fresh rows.
Fix: Raise the raw table’s retention to comfortably exceed your worst-case Task outage (ALTER TABLE ... SET DATA_RETENTION_TIME_IN_DAYS = 3), CREATE OR REPLACE the stream (which resets its offset to now), and one-time backfill the gap directly from the raw table filtered by EVENT_TS/LOADED_AT since the last good downstream timestamp. Prevent recurrence with a “rows processed = 0 while connector busy” Datadog alert and SUSPEND_TASK_AFTER_NUM_FAILURES so a broken Task pages instead of sleeping.
The stale-stream recovery, step by step — order matters because recreating the stream before backfilling would re-skip the gap:
| Step | Command | Why this order |
|---|---|---|
| 1. Confirm staleness | SHOW STREAMS → read stale = true |
Don’t backfill if the stream is actually fine |
| 2. Find the gap boundary | SELECT MAX(EVENT_TS) FROM enriched_target |
The last event you successfully processed downstream |
| 3. Extend retention | ALTER TABLE raw SET DATA_RETENTION_TIME_IN_DAYS = 3 |
So the new stream can’t re-stale as fast |
| 4. Backfill the gap | INSERT INTO target SELECT ... FROM raw WHERE EVENT_TS > <boundary> |
Recover the rows the stale stream skipped |
| 5. Recreate the stream | CREATE OR REPLACE STREAM ... (offset resets to now) |
Resume CDC from current; gap already backfilled |
| 6. Resume the Task | ALTER TASK ... RESUME (leaf→root) |
Re-arm the DAG |
| 7. Add the alert | Datadog: rows-processed=0 while connector busy | Catch the next occurrence in minutes, not days |
2. Ingestion lag climbs and the same batch is retried forever — a poison row.
Root cause: A single row that fails type conversion (e.g. TEMP_C = "ERR") makes the consuming INSERT fail; because the transaction never commits, the stream offset never advances, so the identical bad batch re-presents on every run and lag grows without bound.
Confirm: TASK_HISTORY shows repeated FAILED runs with a numeric/timestamp conversion error in ERROR_MESSAGE, and SYSTEM$STREAM_HAS_DATA stays TRUE run after run.
Fix: Make the transform total — split with TRY_CAST/TRY_TO_* so valid rows land in the target and invalid rows land in a DLQ, all in one committing transaction (the stored-proc pattern above). Use the Kafka connector’s DLQ (errors.deadletterqueue.topic.name) so the worst offenders never reach Snowflake at all.
3. Lag grows steadily under sustained load even though the Task fires every minute.
Root cause: Each minute’s batch is larger than the XS warehouse can drain in under a minute, so backlog accumulates — a throughput, not a correctness, problem.
Confirm: In TASK_HISTORY, COMPLETED_TIME - SCHEDULED_TIME creeps toward (or past) the 60-second schedule; the stream’s row count grows between runs.
Fix: Give the transform more compute — scale the warehouse up (XS → S), shorten the schedule so batches are smaller, or switch to a serverless Task so Snowflake sizes the compute to the batch. If a single Task can’t keep up, partition the work (e.g. by VEHICLE_ID hash) across parallel Tasks with their own streams.
6. The connector is RUNNING but no rows land.
Root cause: Almost always a permissions or auth issue — the ingest role lacks INSERT on the target table, the JWT/key-pair is wrong, or the role/database/schema in the connector config don’t match where you granted access. Rows may be buffering client-side and never committing.
Confirm: The connector status is RUNNING (so it’s not a Kafka problem) but SELECT * FROM TABLE(INFORMATION_SCHEMA.SNOWPIPE_STREAMING_FILE_MIGRATION_HISTORY(...)) / the streaming history shows no ingest; SHOW GRANTS TO ROLE ROLE_TELEMETRY_INGEST is missing INSERT on the table.
Fix: GRANT INSERT ON TABLE TELEMETRY.RAW.TELEMETRY TO ROLE ROLE_TELEMETRY_INGEST (plus USAGE on db/schema); verify the public key registered on the user matches the private key in the connector; confirm snowflake.role.name is the granted role.
Best practices
- Always gate stream-draining Tasks on
WHEN SYSTEM$STREAM_HAS_DATA(...). Empty ticks then cost zero compute — the single biggest cost control. Forgetting it means resuming the warehouse every minute for nothing. - Set the raw table’s retention to exceed your worst-case Task outage. A weekend-suspended Task plus default 1-day retention is the classic stale-stream, silent-data-loss trap. Three days is a sane floor for a minute-cadence pipeline.
- Make every transform total — dead-letter poison rows. Split with
TRY_CAST/TRY_TO_*so the consuming transaction always commits; one un-castable row must never stall the offset. - Use append-only streams on append-only landing tables. They’re cheaper and ignore the delete/update bookkeeping you don’t need on a streaming target.
- One stream per consumer. Independent cursors. Two Tasks sharing a stream steal rows from each other.
- Keep
ALLOW_OVERLAPPING_EXECUTION = FALSEon stream consumers. Overlap races the offset; serialization is what keeps consumption clean. - Resume the DAG leaf-to-root, suspend root-to-leaf. Arm children before the root can fire against them.
- Set
SUSPEND_TASK_AFTER_NUM_FAILURES(3–5). So a broken Task stops burning credits and surfaces, instead of failing silently every minute. - Prefer serverless Tasks for spiky telemetry. No idle warehouse, right-sized per run; reserve fixed warehouses for steady, predictable transforms.
- Choose Dynamic Tables for declarative
SELECTtransforms, Streams+Tasks for procedural needs. Don’t force aMERGE/DLQ/side-effect into a Dynamic Table or a pure declarative refresh into a hand-built DAG. - Tune
buffer.flush.timeto 1 second, not lower. Sub-second flushing maximizes commit overhead for negligible latency gain. - Monitor the two markers and the two failure modes. Alert on stream staleness (
SHOW STREAMS"stale"), on “rows processed = 0 while connector busy,” onTASK_HISTORYfailures, and on ingestion lag (MAX(LOADED_AT)vsMAX(EVENT_TS)). - Pin the schema unless you want auto-evolution.
snowflake.enable.schematization=truegrows columns from JSON; disable it where strict control matters.
Security notes
- Key-pair (JWT) auth only for the streaming client. There is no password on
SVC_TELEMETRY_INGEST; the private key lives in HashiCorp Vault and is injected into the connector at runtime so it never sits in a Kafka Connect config file or a Git repo. Rotate keys on a schedule; Snowflake supports two registered public keys per user for zero-downtime rotation. - Least-privilege ingest role.
ROLE_TELEMETRY_INGESTholds nothing beyondUSAGEon the database/schema,INSERTon the one landing table, andUSAGE/OPERATEon the transform warehouse — notSELECTon curated data, notOWNERSHIP. The connector cannot read what it shouldn’t. - Separate human and service identities. Analysts reach Snowsight via Okta federated to Microsoft Entra ID (SAML + SCIM-provisioned roles); no person ever holds the service credential, and revoking a human’s SSO never touches ingestion.
- Task execution privilege is account-level — control it.
EXECUTE TASK/EXECUTE MANAGED TASKare powerful; grant them to a dedicated operating role, applied through the OIDC-authenticated GitHub Actions pipeline, not hand-run in production. - Network-policy the account. Allowlist the Connect worker’s egress IPs with a Snowflake network policy so the streaming client can only connect from where it should.
- Protect the DLQ. A dead-letter table contains raw, possibly sensitive payloads — apply the same masking policies and access controls as the curated data; don’t leave it world-readable to the analytics role.
- Change-gate production DDL. New Tasks, schema changes, and grant changes go through a ServiceNow change record and the OIDC pipeline; the SQL is never applied by a person directly in prod.
The controls that secure and stabilize the pipeline pull in the same direction:
| Control | Mechanism | Secures against | Also prevents |
|---|---|---|---|
| Key-pair JWT + Vault | RSA key, no password | Credential leakage in config/Git | Auth-failure “no rows land” incidents |
| Least-privilege ingest role | INSERT-only grant |
Over-broad data access | Accidental writes to wrong tables |
| Okta→Entra ID SSO + SCIM | Federated human auth | Shared/standing credentials | People depending on the service identity |
Scoped EXECUTE TASK grant |
Dedicated operating role | Unauthorized DAG control | Ad-hoc prod task changes causing outages |
| Network policy allowlist | IP allowlist | Connections from unexpected hosts | Rogue clients flooding a channel |
| ServiceNow + OIDC pipeline | Change gate + federated deploy | Untracked production DDL | A bad schema/Task reaching prod un-reviewed |
Cost & sizing
The bill has exactly two real drivers in this design, and one of them you can drive to near-zero.
- Snowpipe Streaming throughput is metered as a per-active-client-connection charge plus the data volume ingested — no warehouse in the ingest path. The per-client charge is steady but small; the volume charge scales with your row rate. The lever is number of clients/channels and total bytes, not a warehouse size.
- Transform compute is the only warehouse cost, and the
WHEN SYSTEM$STREAM_HAS_DATAguard plusAUTO_SUSPEND = 60mean an XS warehouse runs only when there’s data and suspends within a minute — typically a few credits a day, not a credit-hour. Serverless Tasks are usually 10–20% cheaper still for short, spiky runs. Dynamic Tables bill their managed refresh compute similarly; an incrementalizing DT is cheap, a DT forced into full refresh every minute is not.
Sizing guidance and the rough monthly picture:
| Cost driver | What you pay for | Rough magnitude | What it buys | Watch-out |
|---|---|---|---|---|
| Streaming client-hours | Per active channel/connection | Small, steady | The file-less low-latency landing | Many idle clients still cost the per-client rate |
| Streaming data volume | Per-GB ingested | Scales with row rate | Throughput, not files | Verbose payloads = more GB; trim at source |
| Transform warehouse (XS, gated) | Seconds/run when data exists | A few credits/day | The incremental transform | Missing STREAM_HAS_DATA → idle credits |
| Serverless Task | Per-run, right-sized | Often ~10–20% below XS warehouse | No idle, no sizing | EXECUTE MANAGED TASK privilege needed |
| Dynamic Table refresh | Managed incremental compute | Cheap if incremental | Declarative freshness | Full-refresh fallback can be costly |
| Time Travel / retention | Storage for the retention window | Storage rate × window | Stream survivability | Long retention on huge tables = storage cost |
Two right-sizing rules. First, match the Task cadence to the freshness SLO, not to “as fast as possible.” A 1-minute schedule on a workload that genuinely needs 2-minute freshness halves your run count for free. Second, fix throughput problems with compute, not by removing the STREAM_HAS_DATA guard — if lag grows, scale the warehouse up or go serverless; never make empty ticks expensive to “keep up.” Track everything in Datadog by pulling SNOWPIPE_STREAMING_*, TASK_HISTORY, and WAREHOUSE_METERING_HISTORY into one panel so the team that asked for the live map can see exactly what real-time visibility costs per day and tune buffer.flush.time and the Task schedule against that number. Frostline’s steady state was ~5 credits/day after the redesign — proof the win is the pattern, not a bigger warehouse.
Interview & exam questions
1. How does Snowpipe Streaming differ from classic file-based Snowpipe, and when do you choose each? Snowpipe Streaming opens a channel and appends rows with no staged files, billed by throughput (per-client-hour + per-GB), with a seconds-scale latency floor. Classic Snowpipe loads files from a stage via a COPY per file, billed by that compute plus per-file overhead, with a tens-of-seconds-to-a-minute floor. Choose Streaming for high-frequency small events (telemetry, CDC); choose classic for files arriving every few minutes. The crossover is per-file overhead vs per-client-hour: a million one-row files is catastrophic for classic, while one 2 GB file every ten minutes favors classic.
2. What makes Snowpipe Streaming exactly-once? Each channel carries an offset token — an opaque per-channel marker that Snowflake durably remembers for the last committed row. On client restart you call getLatestCommittedOffsetToken() and resume just past it, so rows are neither lost nor double-written. It’s the channel’s durable offset memory, analogous to a Kafka consumer offset but on the write side.
3. What is a Stream, and when does its offset advance? A Stream is a CDC cursor recording a point in a table’s Time-Travel history; querying it returns the changes since that point. The offset advances only when a DML statement that consumed the stream commits — a bare SELECT shows rows but does not move the cursor. A Task’s INSERT ... FROM stream advances it atomically with the write, which is what gives exactly-once consumption.
4. What is a stale stream and how do you prevent it? A stream goes stale when its offset falls outside the source table’s Time-Travel window (DATA_RETENTION_TIME_IN_DAYS, extended by MAX_DATA_EXTENSION_TIME_IN_DAYS) because nothing consumed it for longer than retention. Reading a stale stream returns nothing, with no error — silent data loss. Prevent it by keeping the consuming Task running, setting retention to exceed your worst-case outage, and alerting on SHOW STREAMS’ stale column and on “rows processed = 0 while the connector is busy.”
5. Standard vs append-only vs insert-only streams? Standard tracks inserts, updates, and deletes (representing an update as a delete+insert pair) — full CDC for mutable tables. Append-only tracks inserts only and ignores updates/deletes — cheaper and correct for append-only landing tables. Insert-only is for streams on external/directory tables over storage. A Snowpipe Streaming target is append-only, so use an append-only stream.
6. Why gate a Task with WHEN SYSTEM$STREAM_HAS_DATA, and what happens without it? With the guard, a Task that finds an empty stream skips the run and consumes no compute — empty minutes are free. Without it, every scheduled tick resumes the warehouse and burns a credit even when there’s nothing to do. It is the single most important cost control in the design.
7. Serverless Task vs warehouse Task? A warehouse Task runs on a named warehouse you size and bills per-second while running (paying until AUTO_SUSPEND). A serverless Task omits the warehouse, sets USER_TASK_MANAGED_INITIAL_WAREHOUSE_SIZE, runs on Snowflake-managed compute sized per run, bills per-run (often ~10–20% cheaper for short jobs) with no idle, and needs EXECUTE MANAGED TASK. Use serverless for spiky/short transforms, warehouses for steady predictable ones.
8. How do Tasks form a DAG, and in what order do you resume them? One root Task has a schedule; dependents use AFTER <parent> (no schedule of their own); an optional finalizer runs after all leaves. Because a Task is created suspended, you resume leaf-to-root so the DAG is fully armed before the scheduler can fire the root against an un-resumed child; you suspend root-to-leaf.
9. A poison row stalls the pipeline. Why, and how do you fix it? The stream offset advances only on a committed transaction; if one un-castable row makes the INSERT fail, the transaction rolls back, the offset doesn’t move, and the same bad batch re-presents forever while lag grows. Fix by making the transform total: split with TRY_CAST/TRY_TO_* so valid rows land in the target and invalid rows land in a dead-letter table, all in one committing transaction; optionally route worst offenders to the Kafka connector’s DLQ before they reach Snowflake.
10. When would you use Dynamic Tables instead of Streams and Tasks? When the transform is a declarative SELECT and “keep this fresh within N” is the whole requirement: a Dynamic Table with a TARGET_LAG lets Snowflake manage the incremental refresh, with no stream or task to operate. Keep Streams+Tasks when you need procedural logic, side effects (dead-letter, external calls), a MERGE/upsert, or precise DAG ordering — things a pure declarative refresh doesn’t express. Watch for Dynamic Tables falling back to full (not incremental) refresh on query shapes they can’t incrementalize.
11. Your ingestion lag is climbing under load even though the Task runs every minute. Diagnose. Each minute’s batch is larger than the warehouse can drain in the interval, so backlog accumulates — a throughput problem, not a correctness one. Confirm via TASK_HISTORY (COMPLETED_TIME - SCHEDULED_TIME approaching the schedule) and a growing stream row count. Fix by scaling the warehouse up, shortening the schedule (smaller batches), going serverless, or partitioning the transform across parallel Tasks with their own streams.
12. What privilege model does this pipeline need? The ingest service user authenticates with key-pair JWT (no password) as a least-privilege role holding only INSERT on the landing table plus warehouse/database/schema USAGE. Running Tasks needs EXECUTE TASK (or EXECUTE MANAGED TASK for serverless), granted to a dedicated operating role and applied through CI/CD. Human access is fully separate via Okta→Entra ID SSO with SCIM roles. This maps to Snowflake’s SnowPro Advanced: Data Engineer material on continuous data pipelines, Streams/Tasks, and RBAC.
These map to the SnowPro Core (loading data, Streams & Tasks, Time Travel) and SnowPro Advanced: Data Engineer (continuous pipelines, Snowpipe Streaming, Dynamic Tables, performance) certifications.
| Question theme | Primary cert | Objective area |
|---|---|---|
| Streaming vs classic Snowpipe; channels/offsets | SnowPro Advanced: Data Engineer | Continuous data pipelines |
| Streams: types, offset, staleness, Time Travel | SnowPro Core / Advanced DE | Change tracking & Time Travel |
Tasks: DAGs, serverless, STREAM_HAS_DATA |
SnowPro Advanced: Data Engineer | Orchestration & scheduling |
| Dead-letter / exactly-once transactional consume | SnowPro Advanced: Data Engineer | Error handling & data quality |
| Dynamic Tables vs Streams+Tasks | SnowPro Advanced: Data Engineer | Declarative pipelines |
| RBAC, key-pair auth, network policy | SnowPro Core | Security & access control |
Quick check
- Your transform Task runs every minute and reports zero rows processed, but the Kafka connector is clearly busy ingesting. What single condition do you suspect first, and which command confirms it?
- True or false: simply
SELECT-ing from a Stream advances its offset, so inspecting a stream consumes its rows. - A firmware bug emits
TEMP_Cas the string"ERR"and your pipeline’s lag starts climbing without bound. Why does one bad row stall the whole pipeline, and what’s the fix? - You need the same new rows consumed by two different Tasks. What do you create, and what’s the mistake to avoid?
- When would you reach for a Dynamic Table instead of a Stream-and-Task pair, and what’s the one thing a Dynamic Table can’t do that a Task can?
Answers
- A stale stream. The stream’s offset has fallen outside the raw table’s Time-Travel retention window, so it returns nothing despite fresh rows — silent data loss. Confirm with
SHOW STREAMS LIKE '...'and read the"stale"(and"stale_after") column, and noteSYSTEM$STREAM_HAS_DATAreturnsFALSEwhileMAX(LOADED_AT)on the raw table is current. Fix by raisingDATA_RETENTION_TIME_IN_DAYS, recreating the stream, and backfilling the gap byEVENT_TS. - False. A bare
SELECTfrom a stream shows the rows but does not advance the offset; the offset only moves when a DML statement that consumed the stream commits. Inspecting is therefore safe. - The stream offset advances only on a committed transaction; the un-castable row makes the consuming
INSERTfail, the transaction rolls back, the offset never advances, and the identical bad batch re-presents every run while lag grows. Fix by making the transform total —TRY_CAST/TRY_TO_*split with valid rows to the target and invalid rows to a dead-letter table, all in one committing transaction. - Create two separate streams on the same source table — streams are independent cursors. The mistake is pointing both Tasks at one stream: they’d each advance it and steal rows from the other.
- Reach for a Dynamic Table when the transform is a declarative
SELECTand “keep it fresh withinTARGET_LAG” is the whole spec — no stream or task to operate. The thing it can’t do that a Task can: side effects / procedural logic — a dead-letterINSERT, an external call, aMERGEwith custom upsert logic. A Dynamic Table only materializes a query result.
Glossary
- Snowpipe Streaming — file-less, throughput-billed ingestion that appends rows into a table through a channel, with no virtual warehouse in the path.
- Channel — an ordered, stateful connection from a streaming client (Ingest SDK or Kafka connector) into a single target table; the unit of streaming ingest.
- Offset token — an opaque, per-channel marker of the last-committed row that Snowflake durably remembers, used to resume exactly-once after a client restart.
- Classic Snowpipe — file-based ingestion that runs a
COPYper file from a stage, triggered by notifications or REST; what Streaming replaces for high-frequency small events. - Ingest SDK — the Snowflake client library (Java 2.x) for opening channels and appending rows programmatically with offset tokens.
- Stream — a change-tracking object (CDC cursor) that exposes the rows changed in a table since its offset, implemented on Time Travel.
- Stream offset — the point in a table’s change history a stream tracks; advances only when a DML statement consuming the stream commits.
- Stale stream — a stream whose offset has fallen outside the table’s data-retention window; reading it returns nothing with no error (silent data loss).
- Append-only stream — a stream that tracks inserts only and ignores updates/deletes; cheaper and correct for append-only landing tables.
METADATA$ACTION/METADATA$ISUPDATE/METADATA$ROW_ID— the metadata columns a stream adds to express change direction, update-pairing, and stable row identity.- Task — a scheduled or DAG-chained unit of SQL that runs on a warehouse or serverless; the thing that consumes a stream into the next layer.
- Serverless Task — a Task that runs on Snowflake-managed compute sized per run and billed per run, with no warehouse to size and no idle cost.
- DAG / finalizer — a Task graph: one root with a schedule plus
AFTERdependents, optionally ending in a finalizer that runs after all leaves complete. SYSTEM$STREAM_HAS_DATA— a function used in a Task’sWHENclause; when false, the Task skips its run and consumes zero compute.- Dynamic Table — a declaratively-defined table kept fresh within a
TARGET_LAGby Snowflake’s managed (incremental where possible) refresh; the declarative alternative to Streams+Tasks. - Time Travel — Snowflake’s retention of historical table versions (
DATA_RETENTION_TIME_IN_DAYS); the substrate Streams depend on. - Dead-letter (DLQ) — a quarantine for rows that fail validation, so a poison row never stalls the offset; implemented as a table (or the Kafka connector’s DLQ topic).
- Key-pair (JWT) authentication — password-less Snowflake auth where the client signs a JWT with an RSA private key whose public key is registered on the user.
TARGET_LAG— a Dynamic Table’s freshness target (e.g.'1 minute'orDOWNSTREAM) that bounds how stale the table may be.
Next steps
You can now stand up a file-less, near-real-time Snowflake pipeline and reason about every second of latency and every credit it costs. Build outward:
- Next: Set Up dbt Cloud Jobs with Slim CI and Snowflake Deferral — layer governed, tested transformations on top of the raw layer this pipeline lands.
- Related: Configure Confluent Cloud Cluster Linking and Tiered Storage for Multi-Region Kafka — the Kafka side that feeds the streaming connector, across regions.
- Related: Configure Databricks Unity Catalog External Locations and Storage Credentials — the equivalent governance layer if your platform is Databricks-shaped.
- Related: Deploy ClickHouse Cluster with ReplicatedMergeTree and ClickHouse Keeper — an alternative engine when you need sub-second analytical reads over the same event stream.
- Related: Data Mesh: Decentralized Domain-Oriented Data Ownership at Scale — the organizational pattern for owning pipelines like this one per-domain.
- Related: Automate ServiceNow Change Requests from a CI/CD Pipeline via the Change API — the change gate that fronts production DDL for new Tasks and schemas.