In a nutshell
Imagine a giant airport for data. Millions of travelers (your devices) arrive every second. Each one needs a passport check at the gate (secure identity), a way to shout a short status update without queuing (an MQTT publish), and a sorting hall that instantly routes each message to the right destination — some to the “act on this right now” desk, some to permanent records storage, some to the analytics office (the Rules Engine fan-out). This lesson is the blueprint for that airport, built entirely from managed AWS services so you never run the building yourself.
Put plainly: an IoT analytics architecture takes a flood of tiny sensor readings and turns it into two things a business actually wants — instant alerts when something is wrong right now, and trustworthy history you can chart, audit, and learn from later. The catch is that the same reading has to travel two very different roads at once: a fast “hot” road measured in seconds, and a cheap, durable “cold” road measured in years. Most of this lesson is about building both roads and the junction — AWS IoT Core — that splits traffic between them.
Why should a beginner care? Because this is the shape of nearly every “connected thing” system — a smart thermostat, a delivery van, a factory robot, a hospital infusion pump. Learn this one pattern and you can reason about all of them. And the five ideas underneath it — secure identity, decoupled ingestion, stream processing, a durable lake, and a serving layer — reappear in almost every data architecture on AWS, IoT or not.
Level: Advanced (now with a beginner on-ramp) · Time: ~55 min
Prerequisites — helpful, not mandatory:
- Comfort with the idea of publish/subscribe messaging (a sender posts to a named “topic”; any number of receivers subscribe). We re-explain it from scratch below, so don’t worry if it is new.
- Basic AWS literacy: what an IAM role, an S3 bucket, and a Lambda function are. The IAM least-privilege lesson and the real-time streaming lesson are good warm-ups.
- No hardware or electronics knowledge required — we treat “the device” as a black box that emits small JSON messages.
After this lesson you will be able to:
- Trace, in order, how one sensor reading travels from a device to a dashboard, and name what each AWS service does to it along the way.
- Explain the hot / warm / cold path split and decide which data belongs on each road.
- Explain MQTT, device shadows, X.509 per-device identity, and the IoT Rules Engine well enough to teach them back to a colleague.
- Read and reason about the Terraform and IoT-policy snippets in this lesson rather than just copying them.
- Choose deliberately between Timestream and SiteWise, and between Kinesis, Firehose-direct, and MSK.
- Estimate roughly where the money goes at fleet scale and name the top three cost levers.
Industrial and connected-product companies sit on a paradox: their machines emit more telemetry than ever, yet the data lands in a dozen disconnected silos — a SCADA historian here, a CSV export there, a vendor cloud nobody can query. The result is that the most operationally valuable signal in the business (what the physical assets are actually doing, second by second) is the hardest to analyze. This article lays out a reusable AWS architecture that turns raw device telemetry into governed, queryable, dashboard-ready analytics, scaling from a single pilot line to a global fleet of millions of devices.
The business scenario
Picture three companies that look different but share the same shape of problem.
A mid-size HVAC manufacturer ships 40,000 rooftop units a year, each with a cellular modem. Warranty claims are killing margins, and the only way to know a compressor is failing is when a customer calls. They want predictive maintenance, but the telemetry never leaves the unit’s flash memory.
A regional water utility runs 1,200 pumping stations with PLCs speaking Modbus and OPC-UA. Their historian retains 90 days at full resolution, then downsamples and effectively forgets. Regulators now demand multi-year auditable records of flow, pressure, and chlorine dosing, and the operations team wants a single pane of glass instead of 1,200 vendor HMIs.
A logistics operator has 8,000 refrigerated trailers (reefers) with GPS, temperature, door, and fuel sensors reporting every 30 seconds. Cold-chain compliance fines are real money, and a single spoiled load can cost more than a year of cloud bills.
Every one of these is the same architecture under the hood: high-cardinality device telemetry, ingested securely at the edge, processed in motion, stored as time-series, and surfaced to both engineers and business users. What differs is scale (thousands vs. millions of devices), protocol (MQTT vs. industrial fieldbus), and latency tolerance (a reefer alarm needs seconds; a warranty trend can wait minutes).
The non-negotiable requirements that recur across all three:
- Secure per-device identity — no shared secrets, revocable in seconds, surviving a stolen device.
- Lossless ingestion that absorbs reconnection storms (a cell tower flaps and 10,000 devices reconnect at once).
- Hot path and warm path — real-time alerting in seconds, plus historical analytics over months or years.
- Asset context — raw
temp=4.2is useless;Trailer 7731 / Reefer Unit / Evaporator Coil = 4.2°Cis actionable. - Self-service dashboards for non-engineers, without exporting data to laptops.
- Predictable cost that scales sub-linearly with device count.
This is the canonical AWS IoT analytics stack: IoT Core → Kinesis → Timestream / SiteWise → QuickSight, with S3 as the durable backbone.
Architecture overview
The end-to-end data path moves left to right, from physical asset to business insight, with a clean split between a low-latency “hot path” and a high-throughput “warm/cold path.”
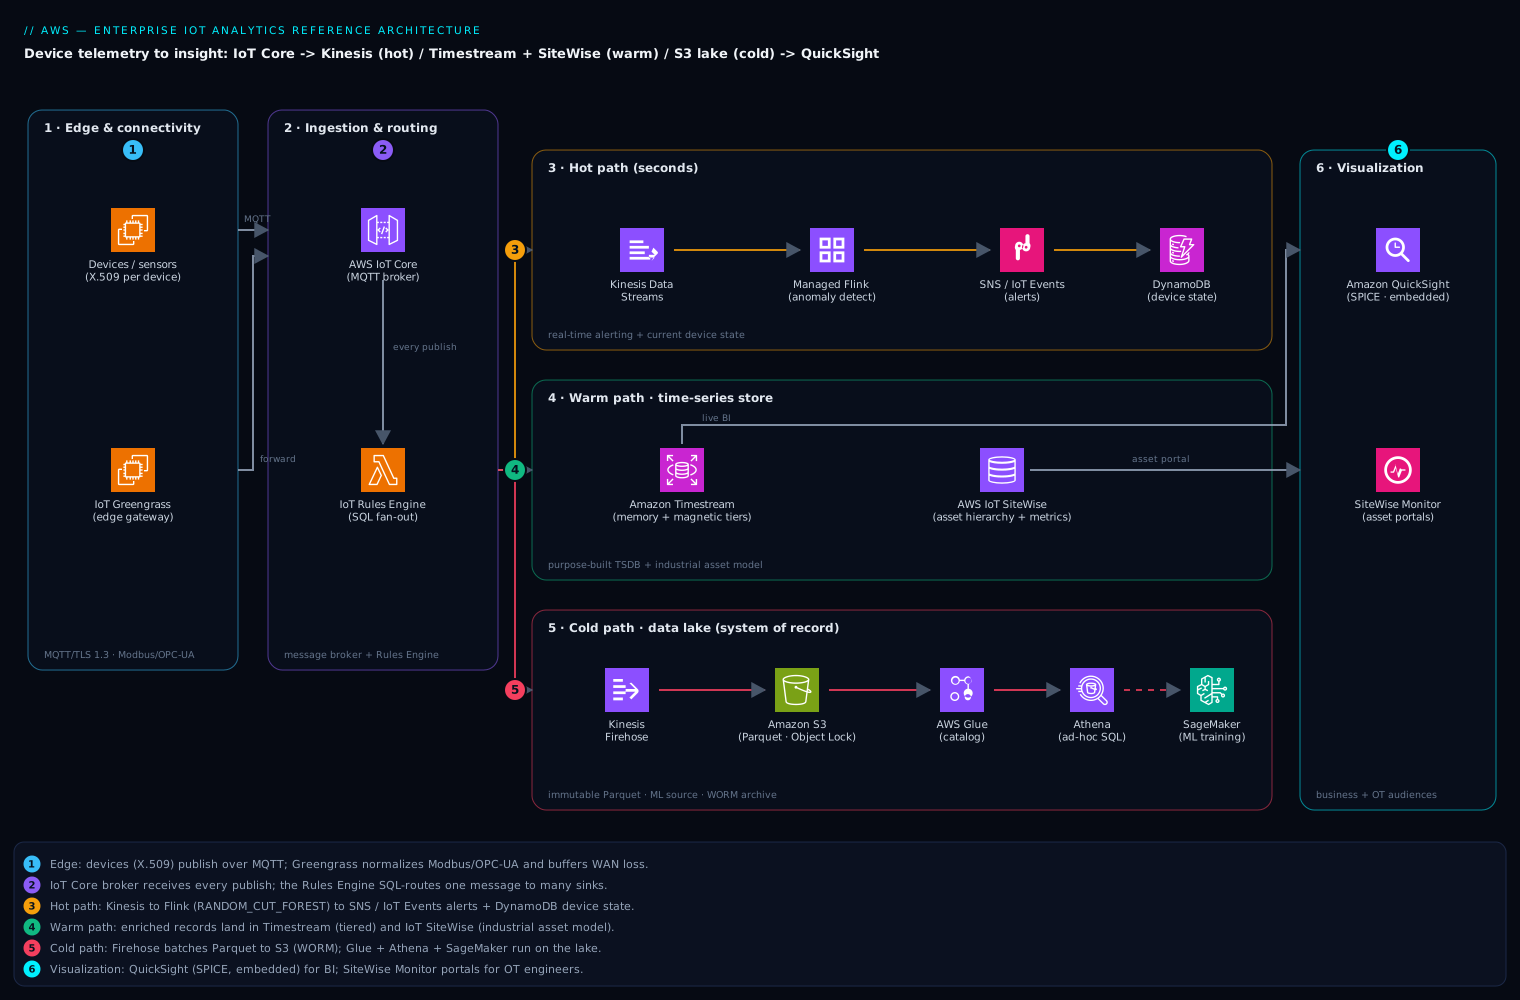
1. Edge & connectivity. Devices connect to AWS IoT Core over MQTT (TLS 1.3, mutual auth with X.509 certificates) or, for constrained cellular fleets, MQTT-over-WebSockets. Industrial sites that speak Modbus/OPC-UA don’t talk MQTT natively, so a gateway running AWS IoT Greengrass sits on-prem, normalizes fieldbus protocols, buffers during WAN outages, and forwards to the cloud. SiteWise can also ingest directly from the SiteWise Edge gateway at the plant.
2. Ingestion & routing. IoT Core’s message broker receives every publish. The IoT Rules Engine is the fan-out hub: a single inbound message can be routed by SQL-like rules to multiple destinations simultaneously. One rule pushes the full firehose to Amazon Kinesis Data Streams for stream processing; another sends a filtered subset (e.g., only alarm=true messages) to AWS IoT Events or directly to an SNS topic; a third writes structured measurements into AWS IoT SiteWise asset properties.
3. Hot path (seconds). Kinesis Data Streams feeds a stream processor — either Kinesis Data Analytics for Apache Flink (Managed Service for Apache Flink) for windowed aggregations and anomaly detection, or a Lambda consumer for simpler enrichment. Anomalies and threshold breaches fan out to SNS / IoT Events for alerting and to DynamoDB for the “current device state” lookup that operators query. Latency from sensor to alert is single-digit seconds.
4. Warm path / time-series store. Cleaned, enriched records land in Amazon Timestream — a purpose-built, serverless time-series database with a memory tier (fast, recent) and a magnetic tier (cheap, historical), and automatic tiering between them. In parallel, IoT SiteWise models the data against an asset hierarchy (Site → Line → Machine → Sensor), computes derived metrics (“transforms” and “metrics” like rolling OEE or average pressure), and serves both engineers and dashboards.
5. Cold path / data lake. Kinesis Data Firehose continuously batches raw and processed telemetry into Amazon S3 in Parquet, partitioned by date and device group. This is the immutable system of record. AWS Glue catalogs it; Athena queries it ad hoc; the lake feeds ML training (SageMaker) and long-term compliance retention via S3 lifecycle policies into Glacier.
6. Visualization & consumption. Amazon QuickSight is the business-facing layer. It connects natively to Timestream and Athena, uses SPICE (its in-memory engine) for snappy dashboards, and supports embedded analytics so the utility’s operators or the manufacturer’s dealers see dashboards inside their own portals. SiteWise also offers SiteWise Monitor portals for plant engineers who think in assets, not SQL.
In one sentence: IoT Core authenticates and ingests, the Rules Engine fans data into Kinesis (hot) and SiteWise/Firehose (warm/cold), Timestream and SiteWise store and model it, and QuickSight + SiteWise Monitor present it — with S3 as the durable lake underneath everything.
A naming clarification (read this first). This lesson is titled “IoT Analytics”, but it does not use — and you should not use — the old standalone service literally named AWS IoT Analytics. That product reached end of support on 15 December 2025 and is no longer a recommended path. The current, AWS-recommended pattern is exactly what this article builds: IoT Core rules → Kinesis / Firehose → S3 → Athena / QuickSight, plus purpose-built stores like Timestream and SiteWise. So “IoT analytics” here means the architecture pattern, composed from general-purpose managed services — not the retired product. If you inherit a system still wired to AWS IoT Analytics channels/pipelines/datasets, plan a migration onto this composition.
How devices talk to the cloud: MQTT and device shadows
The diagram shows arrows leaving the devices, but a beginner’s first honest question is: what actually travels along that first arrow, and how? The answer is MQTT, and understanding it removes most of the mystery from everything downstream.
MQTT in five minutes
MQTT is a lightweight publish/subscribe messaging protocol built for exactly this job: tiny devices, flaky networks, low bandwidth. AWS IoT Core is, at heart, a massively scaled managed MQTT broker that speaks MQTT 3.1.1 and MQTT 5 over TLS (port 8883), plus MQTT-over-WebSockets (port 443) for clients stuck behind restrictive firewalls.
The mental model has three moving parts:
- A device publishes a message to a topic — a slash-delimited string like
dt/site42/reefer/TRL-7731/telemetry. It neither knows nor cares who is listening. - Anything interested subscribes to a topic filter. Wildcards make this powerful:
+matches exactly one level (dt/+/reefer/+/telemetry), and#matches the entire remaining tree (dt/site42/#). - The broker sits between them. Publishers and subscribers never connect to each other; they only ever talk to the broker. That decoupling is why a fleet can grow from 40 devices to 4 million without any publisher changing a line of code.
A handful of MQTT details matter in production — and interviewers love them:
| Feature | What it means | AWS IoT Core specifics |
|---|---|---|
| QoS 0 | “At most once” — fire and forget | Supported. Cheapest, lowest latency; a dropped packet is simply lost. |
| QoS 1 | “At least once” — redelivered until acknowledged | Supported. Use for telemetry you cannot lose; expect occasional duplicates, so make consumers idempotent. |
| QoS 2 | “Exactly once” | Not supported by AWS IoT Core. Design for QoS 1 + idempotency instead. |
| Retained message | Broker keeps the last message on a topic and hands it to any new subscriber immediately | Supported; handy for “last known config/state” on a topic. |
| Last Will & Testament (LWT) | A message the broker publishes automatically if the device drops without a clean disconnect | Supported; the classic way to detect “a device just went dark.” |
| Keep-alive | Heartbeat interval; miss it and the broker declares the client gone | 30–1200 seconds. Tune against your cellular idle timeouts. |
The maximum MQTT payload AWS IoT Core accepts is 128 KB per message — a deliberate nudge toward many small readings rather than giant blobs (put large files in S3 and publish a pointer instead).
Device shadows: talking to something that is usually asleep
Cellular and battery devices are offline most of the time. So how do you “set the target temperature to 0°C” on a reefer that only wakes for four seconds every five minutes? You don’t talk to the device — you talk to its device shadow.
A shadow is a JSON document that AWS IoT Core stores on behalf of each device, with two halves that matter:
reported— the last state the device told the cloud (“I am at 4.2°C, setpoint 2°C”).desired— the state you want it in (“setpoint should be 0°C”).
When the two differ, IoT Core computes a delta and publishes it to a reserved topic. The next time the device connects, it reads the delta, applies the change, and reports its new state — which clears the delta. Device and cloud converge eventually, even though they are never online at the same instant.
{
  "state": {
    "desired":  { "setpoint_c": 0 },
    "reported": { "setpoint_c": 2, "actual_c": 4.2 },
    "delta":    { "setpoint_c": 0 }
  },
  "metadata": { "reported": { "actual_c": { "timestamp": 1749480000 } } },
  "version": 47
}
Shadows live under reserved MQTT topics ($aws/things/<thingName>/shadow/update, .../update/delta, .../get, .../update/accepted). The version field gives you optimistic concurrency — a stale updater is rejected — and each Thing can carry one classic (unnamed) shadow plus multiple named shadows (say, firmware and climate) to model independent sub-systems. Keep the two jobs mentally separate: the shadow is current state (“what is this device’s desired/actual configuration right now?”); the Kinesis/Timestream pipeline is the event history (“what has this device been doing over time?”). Using a shadow to store history, or the telemetry stream to hold current config, is a classic beginner tangle.
The Rules Engine, read slowly
The IoT Rules Engine is the busiest junction in the whole design, and its SQL trips people up because it looks like database SQL but runs over a stream of individual messages. Each inbound MQTT message is one “row.” A rule has three parts: a SELECT (reshape the payload), a FROM (a topic filter deciding which messages the rule even sees), and an optional WHERE (drop the ones you don’t want). Whatever survives is handed to one or more actions.
Walk through a realistic rule for the reefer fleet. A trailer publishes to dt/site42/reefer/TRL-7731/telemetry:
SELECT
  topic(4)                 AS deviceId,     -- 4th topic segment = TRL-7731
  temperature              AS temp_c,
  (temperature - setpoint) AS temp_error,
  timestamp()              AS ingest_ts
FROM 'dt/+/reefer/+/telemetry'
WHERE temperature > setpoint + 3
Read it line by line:
FROM 'dt/+/reefer/+/telemetry'— this rule only sees reefer telemetry, from any site, any device. The two+wildcards stand in for the site and device segments.topic(4)— the Rules Engine numbers topic segments starting at 1:dt=1,site42=2,reefer=3,TRL-7731=4,telemetry=5. Sotopic(4)lifts the device id straight out of the topic string, no payload field required. (Off-by-one here — counting from 0, or forgetting the literaldtroot counts as segment 1 — is the single most common Rules-Engine bug.)temperature - setpoint— SQL expressions run per message, so you can compute derived fields (here, how far above target we are) before anything downstream sees the data.WHERE temperature > setpoint + 3— only messages more than 3°C over target survive. Attach an alarm action and you have server-side alerting with zero custom code.
The same inbound message is usually matched by several rules at once — one unfiltered rule shoveling everything to Kinesis, this filtered alarm rule, and a third writing to SiteWise. That parallel fan-out from a single publish is the Rules Engine’s superpower. Two production habits you should never skip: attach an error action (a dead-letter SQS/CloudWatch target) to every rule so failures are visible, and prefer basic ingest ($aws/rules/<ruleName>/...) for high-volume telemetry to skip per-message broker messaging charges.
The path of one reading
Let’s follow a single temperature reading from trailer TRL-7731 the whole way, so every box on the diagram turns concrete. Assume the reefer’s evaporator coil is drifting warm.
- Sense & publish (t = 0 ms). The controller reads
4.2°C, wraps it in a small JSON payload with a timestamp and the2°Csetpoint, and publishes over MQTT (QoS 1, TLS, mutual-auth cert) todt/site42/reefer/TRL-7731/telemetry. Bytes on the wire: a few hundred. - Authenticate & ingest (t ≈ 20 ms). IoT Core validates the device’s X.509 certificate, checks that the attached IoT policy allows publishing to exactly that topic, and accepts the message. A stolen cert from a different trailer could not have published here, because the policy is scoped with
${iot:Connection.Thing.ThingName}. - Fan out via rules (t ≈ 25 ms). Three rules match at once. Rule 1 forwards the raw message to Kinesis Data Streams, partitioned by
deviceId. Rule 2 (theWHERE temperature > setpoint + 3alarm rule) evaluates4.2 > 2 + 3→4.2 > 5→ false, so the hard-threshold alarm stays quiet. (Note this carefully: the coil is failing, but it has not breached the crude threshold yet — which is exactly why we also run the ML anomaly path in the next step.) Rule 3 writes the measurement into SiteWise against the “Evaporator Coil” asset property. - Hot path (t ≈ 1–3 s). A Managed Service for Apache Flink job reads the Kinesis shard, keeps a per-trailer 5-minute window, and runs a Random Cut Forest anomaly model. The coil’s slow warm-up nudges the anomaly score upward. Minutes later, when the score crosses its threshold, Flink emits an event to IoT Events / SNS — the dispatcher is paged before the load spoils — and updates DynamoDB so the ops screen flags TRL-7731 as “at risk.”
- Warm path (t ≈ seconds). The cleaned reading is also written to Timestream, landing in the fast memory store. An operator’s live dashboard, and any
WHERE time > ago(1h)query, reads it from there. - Cold path (t ≈ up to a minute). In parallel, Firehose buffers this reading with thousands of others and, when the buffer fills (say 128 MB or 60 s), writes a Parquet object to S3, partitioned
region=.../date=.... This reading is now part of the permanent record — the exact row a compliance auditor or an ML training job will read next year. - Age & tier (t = days → years). In Timestream, the reading falls from the memory store to the cheap magnetic store once its retention window passes. In S3, a lifecycle rule eventually transitions the object to Glacier. Nothing is deleted; it just gets cheaper.
One reading, six services, three time-horizons — and the same byte of data ends up powering a real-time page, a live dashboard, and a two-year audit record. That triple-use, from a single publish, is the whole point of the pattern.
Component breakdown
| Component | Role | Why it’s here | Key configuration choices |
|---|---|---|---|
| AWS IoT Core | Managed MQTT broker + device registry + Rules Engine | Secure, scalable front door for millions of devices with per-device identity | X.509 cert per device via fleet provisioning; Thing Groups for fleet management; basic ingest topics to skip broker billing on high-volume rule traffic |
| AWS IoT Greengrass | Edge runtime on on-prem gateways | Protocol translation (Modbus/OPC-UA→MQTT), local buffering, edge ML inference during WAN loss | Stream Manager for store-and-forward; component-based deployment; local Lambda/container compute |
| IoT Rules Engine | SQL routing of inbound messages | Single message → many destinations without custom code | SQL SELECT with functions; error action to SQS/CloudWatch; route to Kinesis, SiteWise, Firehose, Lambda in parallel |
| Kinesis Data Streams | Ordered, replayable telemetry pipe | Decouples ingestion from processing; absorbs spikes; multiple consumers | On-demand mode for unpredictable IoT load, or provisioned shards (1 MB/s or 1,000 records/s each); partition key = deviceId; 24h–365d retention |
| Managed Service for Apache Flink | Stateful stream processing | Windowed aggregations, sessionization, real-time anomaly detection (RANDOM_CUT_FOREST) | Tumbling/sliding windows; checkpointing to S3; autoscaling parallelism |
| Amazon Timestream | Serverless time-series database | Purpose-built for trillions of events/day with automatic hot→cold tiering | Memory store retention (hours/days) + magnetic store (years); scheduled queries for rollups; partition by dimension |
| AWS IoT SiteWise | Industrial asset modeling + time-series | Gives raw signals asset context and computes OEE/derived metrics; engineer-friendly | Asset models + hierarchies; transforms & metrics; SiteWise Edge for on-prem; data buffering |
| Kinesis Data Firehose | Batched delivery to the lake | Zero-code, serverless landing of data into S3/Redshift | Parquet conversion via Glue schema; dynamic partitioning by deviceGroup/date; buffering 64–128 MB |
| Amazon S3 | Durable data lake / system of record | Immutable raw store, ML source, compliance archive | Partitioned Parquet; lifecycle to Glacier; Object Lock for WORM compliance |
| Amazon DynamoDB | “Current state” / device shadow store | Single-digit-ms lookup of latest reading per device for operator screens | deviceId PK; TTL on stale entries; on-demand capacity |
| Amazon QuickSight | BI & embedded dashboards | Self-service analytics for business users; embeddable in portals | SPICE for speed, direct query for freshness; row-level security per tenant; embedding via OIDC |
| SiteWise Monitor | Asset-centric operational portals | Plant engineers visualize hierarchies without BI tooling | Portals, projects, dashboards scoped by asset; SSO via IAM Identity Center |
A note on why two time-series destinations exist. Timestream is a general-purpose time-series database you query with SQL — ideal for cross-device analytics, ML feature engineering, and QuickSight. SiteWise is opinionated around the industrial asset model: it natively understands a hierarchy of equipment and computes engineering metrics. Many enterprises run both — SiteWise for the OT/engineering audience and the asset graph, Timestream (and the S3 lake) for the data-science and BI audience. Smaller deployments pick one. We call this out explicitly so the choice is deliberate, not accidental.
Implementation guidance
Device identity and provisioning. Never ship devices with a shared certificate. Use IoT Core fleet provisioning: each device presents a bootstrap claim certificate, calls the provisioning template, and receives a unique X.509 certificate bound to a Thing. Attach an IoT policy scoped with policy variables so a device can only publish/subscribe to its own topic namespace:
{
  "Effect": "Allow",
  "Action": ["iot:Publish"],
  "Resource": "arn:aws:iot:*:*:topic/dt/${iot:Connection.Thing.ThingName}/telemetry"
}
This is the cornerstone of Zero Trust here — a compromised device cannot impersonate or eavesdrop on any other.
Topic design. Adopt a hierarchical topic taxonomy, e.g. dt/<site>/<assetType>/<deviceId>/telemetry for data and cmd/<deviceId>/# for commands. Use basic ingest ($aws/rules/<ruleName>/...) for high-volume telemetry so you pay Rules Engine and downstream costs but skip per-message broker messaging charges.
IaC with Terraform. Manage everything as code. A representative module layout:
# IoT Core ingestion rule -> Kinesis (hot) + Firehose (cold) + SiteWise
resource "aws_iot_topic_rule" "telemetry_fanout" {
  name        = "telemetry_fanout"
  enabled     = true
  sql         = "SELECT *, topic(3) AS deviceId FROM 'dt/+/+/+/telemetry'"
  sql_version = "2016-03-23"

  kinesis {
    role_arn      = aws_iam_role.iot_to_kinesis.arn
    stream_name   = aws_kinesis_stream.telemetry.name
    partition_key = "$${deviceId}"
  }

  firehose {
    role_arn           = aws_iam_role.iot_to_firehose.arn
    delivery_stream_name = aws_kinesis_firehose_delivery_stream.lake.name
    separator          = "\n"
  }

  error_action {
    sqs {
      role_arn   = aws_iam_role.iot_dlq.arn
      queue_url  = aws_sqs_queue.rule_dlq.id
      use_base64 = false
    }
  }
}

resource "aws_kinesis_stream" "telemetry" {
  name             = "telemetry"
  stream_mode_details { stream_mode = "ON_DEMAND" }
  retention_period = 24
}

resource "aws_timestreamwrite_database" "iot" { database_name = "iot_analytics" }
resource "aws_timestreamwrite_table" "telemetry" {
  database_name = aws_timestreamwrite_database.iot.database_name
  table_name    = "device_telemetry"
  retention_properties {
    memory_store_retention_period_in_hours  = 24
    magnetic_store_retention_period_in_days = 1825   # 5 years
  }
}
Note the error action on every rule — IoT rule failures are silent unless you route them to a dead-letter queue. For SiteWise, model asset hierarchies with aws_iotsitewise_asset_model and aws_iotsitewise_asset, then wire the SiteWise rule action to map MQTT payload fields to asset property IDs. (Bicep/Deployment Manager don’t apply here — this is AWS-native; the Terraform AWS provider is the standard choice, with the CDK as an alternative for teams that prefer TypeScript/Python.)
Stream processing. For the Flink job, checkpoint to S3, key streams by deviceId, and use tumbling windows for periodic rollups (1-min averages) plus RANDOM_CUT_FOREST for unsupervised anomaly scores. Emit anomalies to a second Kinesis stream or directly to IoT Events for the alarm state machine.
Networking and identity wiring. Keep processing private: run Flink/Lambda consumers in a VPC and reach AWS services over VPC interface endpoints (PrivateLink) for Kinesis, Timestream, and S3 (gateway endpoint) so analytics traffic never traverses the public internet. IoT Core’s data plane is a public TLS endpoint by design, but you can use IoT Core VPC endpoints for device traffic from within your network or via Direct Connect for fixed industrial sites. Use IAM Identity Center for human SSO into QuickSight and SiteWise Monitor; use IAM roles (never long-lived keys) for every service-to-service hop. QuickSight embedding uses the GenerateEmbedUrlForRegisteredUser API behind your app’s auth.
Enterprise considerations
Security & Zero Trust. Identity is per-device, per-user, and per-service — never shared. Device certs are revocable instantly via the registry and continuously audited by AWS IoT Device Defender, which detects anomalous behavior (a device suddenly publishing 100x its baseline, or to topics outside its policy) and can quarantine it. Encrypt everywhere: TLS in transit; KMS-managed keys at rest in Kinesis, Timestream, S3, and DynamoDB. Scope IoT policies with policy variables (above). For the data lake, Lake Formation enforces column- and row-level permissions so the BI team sees aggregates but not raw GPS traces if policy forbids. QuickSight row-level security ensures a dealer sees only their own units in an embedded dashboard.
Cost optimization. IoT cost scales with message count and size, so the biggest lever is edge aggregation — have Greengrass or the device batch and pre-aggregate rather than firehosing every raw reading. Use basic ingest to drop broker messaging charges on telemetry that only feeds rules. Pick Kinesis on-demand for spiky fleets but switch to provisioned shards once load is predictable (often 40–60% cheaper at steady state). Lean on Timestream’s tiering: keep memory-store retention short (hours/days) and let data fall to the cheap magnetic tier; use scheduled queries to pre-aggregate so dashboards hit small rollup tables, not raw events. Land the lake in Parquet (5–10x cheaper to scan in Athena than JSON) and lifecycle cold partitions to Glacier. In QuickSight, SPICE caching avoids re-querying Timestream on every dashboard view, and the per-reader pricing keeps embedded analytics economical at scale.
Scalability. Every tier is horizontally elastic: IoT Core scales to millions of connections; Kinesis to thousands of shards (or on-demand auto-scale); Timestream and Firehose are serverless. Partition keys (deviceId) keep ordering per-device while spreading load. The architecture’s scaling is sub-linear in cost because of aggregation, tiering, and Parquet — doubling device count does not double the bill.
Reliability & DR (RTO/RPO). Kinesis replication is multi-AZ by default; set stream retention to 24h–7d so a downstream outage is replayable (this gives a near-zero RPO for the hot path — you can reprocess). The S3 lake is the durable source of truth (eleven nines); enable Cross-Region Replication for the buckets and Glacier archives if you need regional DR. Timestream is multi-AZ within a region; for cross-region resilience, the S3 lake is your rebuild source. A practical target: RPO ≈ minutes (bounded by Firehose buffer + Kinesis retention) and RTO of a few hours to stand up the processing/serving tier in a second region from IaC, with the lake replicated. IoT Core devices should be configured with exponential-backoff reconnection and offline buffering (Greengrass Stream Manager / device-side queue) so a regional blip doesn’t lose data.
Observability. CloudWatch metrics on IoT Core (Connect.Success, RulesExecuted, RuleMessageThrottled), Kinesis (IteratorAge — the canary for consumer lag), Firehose delivery success, and Timestream write/query latency. Alarm on IteratorAge rising (processing falling behind) and on IoT rule error-action DLQ depth. Device Defender feeds a security dashboard. Trace the pipeline end-to-end and surface the operational view in CloudWatch dashboards, while business KPIs live in QuickSight.
Governance. Tag every resource by cost center and environment. Use AWS Organizations + SCPs to enforce encryption and region restrictions. Catalog the lake in Glue Data Catalog and govern access with Lake Formation. Retain raw telemetry per regulatory mandate using S3 Object Lock (WORM) for tamper-proof compliance records — critical for the utility and cold-chain cases.
Reference enterprise example
ColdHaul Logistics operates 8,000 refrigerated trailers across North America. Each reefer reports GPS, setpoint vs. actual temperature, ambient temperature, door open/close events, and fuel level every 30 seconds — roughly 23 million messages per day, spiking to a reconnection storm of 8,000 simultaneous connects whenever trailers exit a dead zone. A single spoiled produce load costs the customer ~$45,000 and triggers a chargeback; regulators (FSMA, FDA cold-chain) require 2 years of auditable temperature records.
Their build:
- IoT Core with fleet provisioning — 8,000 unique certs, scoped policies, Device Defender watching for compromised modems. Devices use basic ingest to feed rules directly.
- Rules Engine fans each message three ways: (1) full stream → Kinesis on-demand; (2)
door_open && movingortemp > setpoint + 3°C for 5 min→ IoT Events alarm state machine → SNS to dispatcher + DynamoDB current-state; (3) raw → Firehose → S3 Parquet, partitioned byregion/date. - Managed Service for Apache Flink computes per-trailer 5-minute temperature averages and runs
RANDOM_CUT_FORESTto catch failing compressors before the load is lost — the highest-value signal in the system. - Timestream stores enriched readings: 48-hour memory tier for live ops, 2-year magnetic tier for compliance. Scheduled queries roll up hourly min/max/avg per trailer.
- QuickSight powers the ops control tower (live map, trailers-at-risk leaderboard from DynamoDB + Timestream) and an embedded customer portal where each shipper sees only their loads via row-level security.
- S3 + Object Lock holds the 2-year WORM compliance archive; lifecycle moves >90-day data to Glacier.
Numbers and outcome. At ~23M msgs/day with edge batching (devices send a 10-reading bundle every 5 minutes rather than each reading raw), monthly costs land near IoT Core ingest ~$600, Kinesis on-demand ~$700, Flink ~$900, Timestream ~$1,400, Firehose+S3+Glacier ~$500, QuickSight ~$1,200, totaling roughly $5,300/month — under $0.70 per trailer per month to monitor a $150,000 asset hauling perishable freight. In the first year, early compressor-failure detection prevented an estimated 31 spoiled loads (~$1.4M avoided), cold-chain chargebacks fell 78%, and the compliance team replaced a quarterly fire drill of CSV exports with a one-click audit export from the WORM archive. The data scientists later trained a remaining-useful-life model on the S3 lake with zero new pipeline work — the lake was already there.
When to use it
Use this architecture when you have genuine device telemetry at scale, need both real-time alerting and long-horizon historical analytics, require per-device security and revocability, and want business users (not just engineers) to self-serve insights. It shines for connected products, industrial/OT modernization, fleet and cold-chain monitoring, and energy/utility telemetry.
Trade-offs and decisions:
- Timestream vs. SiteWise. If your audience is OT/plant engineers who think in equipment hierarchies and need OEE, lead with SiteWise. If it’s data scientists and BI analysts who want SQL and ML, lead with Timestream + S3. Running both is common but doubles modeling effort — do it deliberately.
- Kinesis vs. MSK vs. direct-to-Firehose. For simple “land it in the lake,” IoT Rule → Firehose directly is cheaper and needs no stream processor. Add Kinesis when you need replay, multiple independent consumers, or sub-second processing. Choose MSK (Kafka) only if you have existing Kafka ecosystems or need its specific semantics — otherwise Kinesis is lower-ops.
- Timescale on RDS / OpenSearch. OpenSearch is tempting for time-series + search, but at high cardinality and long retention it gets expensive and operationally heavy versus serverless Timestream. Reach for it when you genuinely need full-text/log search alongside metrics.
Anti-patterns to avoid:
- No edge aggregation — firehosing every raw 1-second reading to the cloud is the single biggest cost mistake. Aggregate or batch at the edge.
- Shared device certificates — one stolen device compromises the fleet and is unrevocable in practice. Always per-device identity.
- Treating Timestream/SiteWise as the system of record — they’re serving layers. The S3 lake is the durable truth; everything else is rebuildable from it.
- Skipping IoT rule error actions — silent rule failures lose data invisibly. Always attach a DLQ.
- Querying raw events from dashboards — use scheduled-query rollups and SPICE so QuickSight hits small aggregates, not billions of rows.
- Building this for low-volume or non-streaming data — if you have a few hundred readings a day or batch file uploads, this is over-engineered. A scheduled Glue job into S3 + Athena + QuickSight is the right-sized alternative.
The pattern’s strength is that each layer is independently serverless or elastic, the data path degrades gracefully (devices buffer, Kinesis replays, the lake never forgets), and cost scales sub-linearly — so the same blueprint serves a 40-unit pilot and an 8-million-device global fleet with only configuration changes.
Going deeper
This section is for the reader who will actually operate one of these systems. It assumes you followed the path-of-one-reading above.
Kinesis internals and the hot-shard trap
A Kinesis Data Stream is an ordered log split into shards. Each shard ingests up to 1 MB/s or 1,000 records/s and emits up to 2 MB/s, shared across standard consumers. Two numbers govern your life here:
- Partition-key choice. Records with the same partition key always land on the same shard, which preserves per-device ordering. Using
deviceIdis right for ordering — but if 5% of your devices produce 80% of the traffic, those “hot” keys overload a few shards while the rest idle: the classic hot-shard problem. Mitigate with a composite key (deviceId+ a small bucket suffix) when strict per-device ordering isn’t required, or switch to on-demand mode, which shards and reshards for you. IteratorAge. The single most important metric in the whole pipeline: how far behind the newest record your consumer is. A steadily climbingIteratorAgemeans processing can’t keep up and data is aging toward the retention cliff. Alarm on this before anything else.
To fan out to many independent consumers without dividing that shared 2 MB/s, use enhanced fan-out (each consumer gets its own 2 MB/s pipe via a push model). Set retention (24 h default, up to 365 days) long enough that a downstream outage is replayable rather than lost — this is what gives the hot path a near-zero RPO.
Firehose, Parquet, and the small-file problem
Firehose is deliberately dumb and cheap: buffer, then flush. Two buffer triggers race — size (1–128 MB) and time (60–900 s) — whichever fires first. Tune them against a real tension: large buffers make big, scan-efficient Parquet files but add latency to the lake; small buffers feel fresh but spawn millions of tiny objects that make Athena slow and S3 request costs balloon (the small-file problem). Enable record-format conversion to Parquet (Firehose reads a Glue table’s schema) and dynamic partitioning so paths look like s3://lake/region=us-east-1/date=2026-06-09/. Point a Firehose error-output prefix at a separate S3 location so failed records are quarantined, never silently dropped.
The batch and warehouse tier (Glue, EMR, Redshift)
The hot path answers “what’s happening now”; the lake answers “what happened, in bulk.” Three tools sit over the S3 lake:
- AWS Glue — serverless Spark for ETL, plus the Data Catalog that gives every Parquet dataset a table definition. Use Glue jobs for scheduled cleansing/compaction and crawlers (or explicit schemas) to keep the catalog current.
- Amazon EMR — when a Glue job is too small a hammer: multi-hour Spark/Presto/Flink over petabytes, custom libraries, GPU nodes for ML. Reach for EMR (often on Spot to slash cost) when reprocessing years of history or running heavy feature engineering; stay on Glue for routine ETL.
- Amazon Redshift — the warehouse for BI-style joins of telemetry against business data (which trailer carried which customer’s load, joined to billing). Redshift Spectrum queries the S3 Parquet in place, so cold telemetry can stay in the lake and still be joined inside a warehouse query. Firehose can also deliver straight to Redshift for continuously-loaded tables.
A useful rule of thumb: Athena for ad-hoc exploration over the lake, Redshift for repeated high-concurrency BI, EMR for heavy custom batch, Glue for the ETL glue between them. For the full pattern, see the AWS lakehouse lesson.
Timestream, precisely
Timestream — specifically Timestream for LiveAnalytics (a separate Timestream for InfluxDB exists for teams standardized on InfluxDB) — models data as dimensions (metadata identifying a series: device_id, site), a measure (name + value), and a time. Ingestion lands in the memory store (fast, indexed, recent); after its retention it tiers automatically to the magnetic store (cheap, historical). Query cost is driven by the volume of data scanned, so the winning move is scheduled queries that continuously pre-aggregate raw events into small rollup tables (hourly min/max/avg per device); dashboards then hit the rollups, not the firehose of raw points. Watch for rejected records: a reading whose timestamp is older than the memory-store retention window is refused, so genuinely late-arriving data needs either a longer memory window or magnetic-store writes enabled.
Device security, beyond “use a cert”
The X.509 story has depth worth knowing:
- Provisioning options. Fleet provisioning (claim cert → provisioning template → unique per-device cert) suits devices you control at manufacture. JITP/JITR (just-in-time provisioning/registration) auto-registers a device the first time it connects with a cert signed by a CA you have registered — useful when a contract manufacturer flashes the devices. Both beat baking one shared cert into a firmware image.
- The credentials provider. Devices that must call other AWS services directly (put an object in S3, write to Kinesis) shouldn’t carry IAM keys. The IoT Core credentials provider exchanges the device’s X.509 cert for short-lived IAM role credentials (via a role alias) — the same “identity, not secrets” principle as everywhere else in AWS.
- Device Defender runs two ways: Audit (is any Thing using a shared cert, an overly-permissive policy, or a cert about to expire?) and Detect (does a device’s behavior deviate from its baseline — 100× its normal message rate, or connecting from a new geography?). Detect can fire mitigation actions: quarantine the Thing into a locked-down group, or revoke the cert.
- Scoping. Scoping every IoT policy with the
${iot:Connection.Thing.ThingName}policy variable is what makes a stolen device a blast-radius-of-one. This is the IoT expression of the least-privilege model from the IAM least-privilege lesson.
The edge: Greengrass internals
When the WAN dies, a naive fleet loses data. Greengrass turns the on-prem gateway into a mini-cloud: components (versioned, deployed like packages) run local Lambda/containers; Stream Manager does durable store-and-forward so readings survive an outage and sync when the link returns; a local MQTT broker and shadow let devices keep working offline; and edge ML runs inference (say, the anomaly model) next to the machine for millisecond reactions and to avoid shipping raw high-rate data upstream. SiteWise Edge is the industrial cousin, collecting OPC-UA/Modbus at the plant and computing metrics locally.
Reconnection storms, quotas, and failure modes
- Reconnection storms. When a cell tower recovers, thousands of devices reconnect in the same second. Without randomized (jittered) exponential backoff on the device, they synchronize into a thundering herd that trips IoT Core connect-rate limits. Jitter is a firmware requirement, not a cloud setting.
- Quotas to design against. IoT Core has account-level limits on concurrent connections, connect rate, publish rate, and rules; Kinesis has shard-per-stream limits; Timestream has ingestion and query throughput limits. Most are raiseable, but design partitioning and batching as if they are real — because at the wrong scale, they are.
- Silent failure modes to alarm on: rising Kinesis
IteratorAge(consumer falling behind), IoT rule error-action DLQ depth (rules failing invisibly), Firehose delivery failures (records piling up in the error prefix), and Timestream rejected-record counts (late or duplicate data). Because QoS 1 permits duplicates, every consumer must be idempotent — dedupe on a(deviceId, timestamp)key.
Version and naming caveats (2026)
- AWS IoT Analytics (the standalone service) reached end of support on 15 Dec 2025 — build the pipeline from IoT Core rules + Kinesis/Firehose/S3/Athena as this lesson does, not from that product.
- Kinesis Data Analytics for Apache Flink was renamed Amazon Managed Service for Apache Flink — same engine, new name; older docs and this lesson’s tables use both.
- Timestream now ships in two flavors (LiveAnalytics vs InfluxDB) — pick LiveAnalytics for the SQL pattern here.
- For the alarm state machine, Step Functions or EventBridge Pipes are increasingly used alongside or instead of IoT Events — treat the “alarm engine” box as a swappable choice, not a fixed product.
Practice challenges
Work these in order — they climb from beginner to advanced. Try each before opening the solution.
1. (Beginner) Write the subscription filter. Given the topic design dt/<site>/<assetType>/<deviceId>/telemetry, write one MQTT topic filter that receives telemetry from every reefer at site42, regardless of device id.
<details> <summary>Solution</summary>
dt/site42/reefer/+/telemetry — the + matches exactly one level (the device id). dt/site42/reefer/# also works but is broader (it would also match deeper sub-topics like .../TRL-7731/telemetry/raw).
Why: + matches a single level, # matches the whole remaining subtree — pick the narrowest filter that still catches what you need.
</details>
2. (Beginner) Pick the QoS. You cannot afford to lose alarm messages, but the occasional duplicate is harmless. Which MQTT QoS do you use on AWS IoT Core, and what property must the consumer have?
<details> <summary>Solution</summary>
QoS 1 (at least once). AWS IoT Core does not support QoS 2, so “exactly once” isn’t on the menu; you get it in practice by making the consumer idempotent — dedupe on a (deviceId, timestamp) key so a redelivered message is a no-op.
Why: QoS 1 guarantees delivery but permits duplicates; idempotency is the standard substitute for the missing QoS 2. </details>
3. (Intermediate) Author a rule. Write an IoT Rules Engine SQL statement that, for topic dt/<site>/<assetType>/<deviceId>/telemetry, selects the device id from the topic plus temperature, and only forwards messages where a boolean field door_open is true.
<details> <summary>Solution</summary>
SELECT topic(4) AS deviceId, temperature
FROM 'dt/+/+/+/telemetry'
WHERE door_open = true
topic(4) is the device-id segment (dt=1, site=2, assetType=3, deviceId=4). The FROM filter subscribes; the WHERE drops non-matching messages before any action runs.
Why: FROM chooses which messages the rule sees, WHERE filters per message, and topic(n) is 1-based including the literal root segment.
</details>
4. (Intermediate) Do the cost math. A fleet of 8,000 devices samples every 30 s. (a) How many readings per day? (b) If each device instead bundles 10 readings into one MQTT publish every 5 minutes, how many publishes per day, and what is the reduction factor? Name the AWS mechanism that makes the batched design cheaper still on the broker.
<details> <summary>Solution</summary>
(a) 8,000 × (86,400 / 30) = 8,000 × 2,880 = 23.04M readings/day. (b) Each device now publishes 1,440 / 5 = 288 times/day → 8,000 × 288 = 2.304M publishes/day — a 10× reduction in MQTT messages. Use basic ingest ($aws/rules/...) so those publishes skip per-message broker messaging charges entirely, and let edge aggregation (Greengrass or on-device batching) do the bundling.
Why: IoT cost scales with message count and size; batching at the edge plus basic ingest attacks both — the single biggest cost lever in the whole architecture. </details>
5. (Advanced) Diagnose the hot shard. Your Kinesis stream is partitioned by deviceId. CloudWatch shows one shard pinned at 100% WriteProvisionedThroughputExceeded while the others sit near idle, and IteratorAge on that shard is climbing. What is happening, and give two fixes with their trade-offs.
<details> <summary>Solution</summary>
A hot shard: a few very chatty deviceId keys hash to one shard (or a bug is sending a constant partition key, collapsing everything onto one shard). Fix 1 — use a composite partition key (deviceId#bucket) to spread the hot devices across shards, at the cost of losing strict global ordering within a device across buckets. Fix 2 — switch the stream to on-demand mode, which auto-reshards to absorb skew, at a higher per-GB price than well-tuned provisioned shards. Also confirm you aren’t accidentally sending one static partition key.
Why: same key → same shard, so skewed keys overload one shard while others idle; you trade ordering or cost to rebalance. </details>
6. (Advanced) Design the Timestream retention + query plan. You need fast live dashboards, cheap 2-year history for compliance, and you must not reject records that arrive up to 10 minutes late. Specify memory-store and magnetic-store retention, how dashboards should query, and the setting that keeps late data from being dropped.
<details> <summary>Solution</summary>
Set memory-store retention comfortably above your worst-case lateness — e.g. 12–48 h (anything ≥ ~1 h clears the 10-minute requirement with margin) so late records still fall inside the memory window and aren’t rejected. Set magnetic-store retention to 730 days for the 2-year mandate. Build scheduled queries that roll raw points into hourly min/max/avg tables, and point dashboards at those rollups (fewer bytes scanned = cheaper + faster). For pathologically late data beyond the memory window, enable magnetic-store writes. Keep S3 + Object Lock as the true compliance archive; Timestream is the serving layer. A sister walk-through of this exact compliance shape lives in the cold-chain monitoring lesson.
Why: Timestream rejects records older than the memory-store window, and query cost scales with data scanned — so the memory window must exceed max lateness, and dashboards must read rollups, not raw events. </details>
Common beginner mistakes
These are misconceptions, not symptom-and-fix tickets — each one is a wrong mental model that quietly steers a design off a cliff.
-
“IoT Core is a database I query the device from.” No. IoT Core is a broker plus rules engine. You never reach out and read a sleeping device on demand; you read its shadow (current state) or the stored telemetry (history). Right model: devices push; you query the copies AWS keeps for you.
-
“One certificate for the whole fleet is simpler.” It is simpler right up until one device is stolen or cloned — then you cannot revoke it without bricking the entire fleet, and any device can impersonate any other. Right model: one X.509 cert per device, scoped by an IoT policy to its own topics; revocation is then a blast-radius-of-one.
-
“Timestream (or SiteWise) is my system of record.” They are serving layers tuned for fast reads, not durability of truth. Right model: the S3 lake is the source of truth (eleven-nines durable, immutable, WORM-lockable); Timestream, SiteWise, and DynamoDB are all rebuildable from it.
-
“MQTT gives me exactly-once delivery.” Not on AWS IoT Core — it supports QoS 0 and QoS 1 only. Right model: assume at-least-once with duplicates, and make every consumer idempotent (dedupe on
deviceId+timestamp). -
“Just send every raw reading straight to the cloud.” This is the number-one cost blowout, because you pay per message and per byte at every hop. Right model: aggregate/batch at the edge (Greengrass or on-device) and use basic ingest; a 10× or 100× reduction in publishes changes the whole bill.
-
“
topic(1)is the first wildcard.” No —topic(n)is 1-based and includes the literal root segment. Fordt/site42/reefer/TRL-7731/telemetry,topic(1)isdtand the device id istopic(4). Right model: count every segment from 1, including the fixed prefix. -
“The device shadow is where I keep history.” The shadow is a small current-state JSON document (desired vs reported), not a time-series. Right model: shadows answer “what should this device be doing now”; the Kinesis → Timestream/S3 pipeline answers “what has it done over time.”
-
“If an IoT rule fails, I’ll see an error somewhere.” Rule failures are silent unless you attach an error action. Right model: every rule gets a dead-letter target (SQS/CloudWatch), and you alarm on its depth — otherwise data disappears invisibly.
-
“Dashboards can just query the raw events.” At billions of rows, that is slow and expensive on every page load. Right model: pre-aggregate with scheduled-query rollups and cache in QuickSight SPICE, so the dashboard reads small tables.
Glossary
- MQTT — a lightweight publish/subscribe messaging protocol for constrained devices and flaky networks. AWS IoT Core speaks MQTT 3.1.1 and MQTT 5 over TLS.
- Broker — the server (here, IoT Core) that receives every publish and delivers it to subscribers, so publishers and subscribers never talk to each other directly.
- Topic — the slash-delimited address a message is published to, e.g.
dt/site42/reefer/TRL-7731/telemetry. - Topic filter / wildcards — a subscription pattern:
+matches one level,#matches the entire remaining subtree. - QoS (Quality of Service) — delivery guarantee. QoS 0 = at most once; QoS 1 = at least once (may duplicate). AWS IoT Core does not support QoS 2 (exactly once).
- Retained message — the broker keeps the last message on a topic and hands it to any new subscriber immediately.
- LWT (Last Will & Testament) — a message the broker auto-publishes if a device disconnects uncleanly; used to detect “device went dark.”
- Device shadow — a JSON document IoT Core stores per device holding
desiredvsreportedstate (and a computeddelta), so cloud and an offline device converge eventually. Can be a classic (unnamed) shadow or one of several named shadows. - X.509 certificate — the per-device cryptographic identity used for mutual-TLS authentication; revocable instantly in the registry.
- Fleet provisioning — issuing a unique cert to each device at first connect from a bootstrap “claim” cert plus a provisioning template.
- JITP / JITR — just-in-time provisioning/registration: a device is auto-registered the first time it connects with a cert signed by a CA you have registered.
- IoT policy / policy variable — the permissions attached to a device identity;
${iot:Connection.Thing.ThingName}scopes a device to only its own topics. - Credentials provider (role alias) — exchanges a device’s X.509 cert for short-lived IAM role credentials so the device can call other AWS services without static keys.
- Rules Engine — IoT Core’s SQL router:
SELECT/FROM/WHEREover each inbound message, fanning it out to multiple actions in parallel. topic(n)— Rules Engine function returning the n-th topic segment, 1-based, counting the literal root segment.- Basic ingest — publishing to
$aws/rules/<ruleName>/...to feed rules while skipping per-message broker messaging charges. - Thing / Thing Group — the registry record for a device; groups enable fleet-wide policy and management.
- Greengrass — the AWS edge runtime: local compute, store-and-forward (Stream Manager), local shadow/broker, and edge ML during WAN loss.
- SiteWise / asset model / OEE — industrial time-series service that maps raw signals onto an equipment hierarchy and computes engineering metrics (e.g. Overall Equipment Effectiveness).
- Kinesis Data Streams — an ordered, replayable log for telemetry, split into shards; decouples ingestion from processing.
- Shard — a Kinesis throughput unit: ~1 MB/s or 1,000 records/s in, ~2 MB/s out (shared).
- Partition key — the field (often
deviceId) that decides which shard a record lands on; same key → same shard → preserved order. IteratorAge— how far behind the newest record a consumer is; the canary metric for a pipeline falling behind.- Enhanced fan-out — a Kinesis feature giving each consumer its own dedicated 2 MB/s read pipe.
- Kinesis Data Firehose — zero-code, serverless batching of records into S3/Redshift, with Parquet conversion and dynamic partitioning.
- Parquet — a columnar file format that is far cheaper to scan in Athena than raw JSON.
- Managed Service for Apache Flink — the stream-processing engine (formerly Kinesis Data Analytics for Apache Flink) for windowed aggregations and anomaly detection.
- Random Cut Forest — an unsupervised algorithm for scoring anomalies in streaming data.
- Amazon Timestream — serverless time-series database with a fast memory store and cheap magnetic store; data modeled as dimensions + measure + time; comes in LiveAnalytics and InfluxDB flavors.
- Scheduled query — a Timestream query that runs on a schedule to pre-aggregate raw events into small rollup tables.
- Athena — serverless SQL over the S3 lake, billed by data scanned.
- AWS Glue / Data Catalog — serverless Spark ETL plus the metastore that gives lake datasets table definitions.
- Amazon EMR — managed Spark/Presto/Flink clusters for heavy custom batch over petabytes, often on Spot.
- Amazon Redshift / Redshift Spectrum — the data warehouse for high-concurrency BI; Spectrum queries S3 Parquet in place.
- QuickSight / SPICE / row-level security — BI and embedded dashboards; SPICE is its in-memory cache; row-level security scopes each viewer to their own rows.
- Lake Formation — column- and row-level access governance over the S3 data lake.
- Device Defender — IoT security service: Audit (misconfig checks) and Detect (behavioral anomaly detection with mitigation actions).
- Hot / warm / cold path — the three data roads: seconds-latency alerting (hot), recent time-series serving (warm), and durable long-horizon lake storage (cold).
- Object Lock (WORM) — S3 write-once-read-many mode for tamper-proof compliance retention.
- RPO / RTO — Recovery Point Objective (how much data you can lose) and Recovery Time Objective (how fast you recover).