In a nutshell
Running one server, you can watch it by hand. Running an estate — hundreds of resources across dozens of subscriptions — you need three instruments on the wall, and most people only ever glance at one of them.
- Azure Service Health is the weather service for Azure itself. It answers one question: is the platform having a storm near me? When your app times out at 2am, Service Health tells you whether it is your bug or an Azure incident in your region and service — so you stop debugging code that was never broken.
- Azure Advisor is a personal trainer for your estate. It watches everything you run and hands you a ranked, plain-language to-do list — save money here, close this security hole, add redundancy there — plus a single fitness number, the Advisor Score, that climbs as you act on the advice.
- Azure Resource Graph is a search engine over every resource you own. Ask “show me every public IP with nothing attached to it across all 200 subscriptions” and it answers in well under a second — the same question would take hours of clicking through blades.
Keep the one-line version in your head: Service Health = is the platform OK? · Advisor = what should I fix? · Resource Graph = what do I even have? The first is reactive (something is wrong), the second proactive (something could be better), the third investigative (tell me the truth about my inventory) — and all three are free.
Level: Intermediate · Time: ~21 min · You’ll need an Azure subscription with a handful of resources, the portal, and Cloud Shell (az pre-installed). By the end you can tell at a glance whether an outage is yours or Azure’s, hand your manager a prioritised fix-list, and answer “what exists across the whole tenant?” in a single query.
The hardest questions in an operations review are rarely about a single broken resource. They are about the estate: “Is that timeout our bug or an Azure incident?” “Which of our three hundred subscriptions still has a public IP on a database?” “Where is the easy money — what is Advisor telling us we are wasting?” Answering those at speed needs three tools that beginners skip and seniors live in. Service Health tells you when the problem is Microsoft’s, not yours. Azure Advisor turns Microsoft’s telemetry about your resources into a ranked to-do list across cost, security, reliability, performance, and operational excellence. And Azure Resource Graph lets you query every resource across every subscription with a fast query language, in under a second, instead of clicking through blades.
This lesson is the operational-awareness layer of the Azure Zero-to-Hero course. We will separate the two “health” experiences learners constantly confuse — Service Health (the platform) versus Resource Health (your specific resource) — work through Advisor’s five recommendation categories and the Advisor Score, and get hands-on with Resource Graph and its KQL dialect, the single most useful skill for managing Azure at scale. By the end you can tell at a glance whether an outage is yours or Azure’s, hand your manager a prioritised list of fixes, and answer “show me every X across the whole tenant” in one query.
Learning objectives
- Distinguish Service Health (service issues, planned maintenance, health advisories, security advisories) from Resource Health, and know which one answers “is it me or Azure?”
- Create a Service Health alert that pages the right team when Azure declares an incident or schedules maintenance in your regions and services.
- Read and act on Azure Advisor recommendations across all five categories — Cost, Security, Reliability, Operational Excellence, Performance — and interpret the Advisor Score.
- Write Azure Resource Graph queries in KQL to inventory, filter, group, and join across resources spanning many subscriptions, and understand the engine’s scope and limits.
- Combine all three into a lightweight operational routine you can run weekly without a SIEM.
Prerequisites & where this fits
You need an Azure subscription with a handful of resources to look at, the Azure portal, and the az CLI (Cloud Shell works). A first pass over Azure Monitor Deep Dive helps, because Service Health alerts ride the same action group plumbing as metric alerts, and a working knowledge of the management-group and subscription hierarchy makes the multi-subscription scope of Resource Graph click into place. This sits in the Monitoring module alongside Azure Monitor: where Monitor answers “how is my workload performing and is it up?”, this lesson answers “is the platform healthy, what should I fix next, and what exists across my whole estate?” No paid tier or agent is required — everything here is free.
Core concepts
Three planes of awareness, three different questions. Keep them straight and most of Azure operations falls into place.
| Tool | The question it answers | Scope | Cost |
|---|---|---|---|
| Service Health | “Is Azure having a problem (or planned maintenance) that affects me?” | Your subscriptions, regions, services | Free |
| Resource Health | “Is this specific resource healthy right now, and why not?” | One resource at a time | Free |
| Azure Advisor | “What should I fix or improve across cost, security, reliability, performance, and operations?” | All resources you can read | Free |
| Resource Graph | “What exists across my estate, and which ones match this condition?” | All subscriptions in scope, at speed | Free |
A useful mental model: Service Health and Resource Health look down at health you do not (or only partly) control; Advisor looks sideways at improvements you should make; Resource Graph looks across everything you own. The first two are reactive (something is wrong), Advisor is proactive (something could be better), and Resource Graph is investigative (tell me the truth about my inventory).
One distinction that trips people up: the Azure Status page (status.azure.com) is the public, global health page for everyone — useful, but not personalised. Service Health in the portal is the authenticated, tenant-scoped view, filtered to the services and regions you actually use, and it is the only one you can alert on.
Service Health: is it me or Azure?
Service Health is the platform-health experience scoped to your tenant. It lives under Monitor → Service Health (or its own portal blade) and breaks into four event types you must be able to name:
| Event type | What it is | Typical action |
|---|---|---|
| Service issues | A live Azure incident (outage/degradation) affecting your services/regions right now | Stop debugging your code; track the incident, communicate, wait or fail over |
| Planned maintenance | Upcoming Azure maintenance that may reboot or briefly affect resources | Schedule around it; for VMs, self-trigger maintenance in a window you choose |
| Health advisories | Changes that require your action — deprecations, feature retirements, quota/config notices | Plan the migration before the deadline |
| Security advisories | Security-related notifications for services you run | Assess and remediate |
The single most important habit Service Health enables is the Service Health alert — a control-plane alert that fires the moment Azure posts an event matching your subscriptions, regions, services, and event types, routing it to an action group (email, SMS, webhook, Logic App, ITSM/PagerDuty). Without it you are refreshing a status page during an incident; with it the right team is paged automatically and your post-incident review can prove exactly when Azure declared the problem.
Service Health events are surfaced through the Activity Log under the ServiceHealth category, which is why the alert is a control-plane (Activity Log) alert, not a metric alert — you match on event properties (incident type, impacted region, impacted service), not on a numeric threshold.
Resource Health: the single-resource view
Where Service Health is the platform-wide view, Resource Health drills into one resource and reports its current and recent availability, with a plain-language reason. Open any VM, database, or App Service and there is a Resource Health blade in the left menu. The state is one of:
| State | Meaning |
|---|---|
| Available | The resource is healthy and operating normally |
| Unavailable | The platform has detected the resource is not healthy |
| Degraded | Reduced performance or partial functionality |
| Unknown | The platform has not had a signal recently (e.g. resource stopped/deallocated) |
Resource Health also attributes cause where it can: platform-initiated (Azure did it — maintenance, host fault), user-initiated (you deallocated it), or unknown. That attribution is the fast answer to “did we break this or did Azure?” for a single resource — and, like Service Health, you can raise a Resource Health alert so a specific critical resource going Unavailable pages you directly.
The exam-and-interview line to remember: Service Health is the platform-wide, tenant-scoped view of Azure’s health that you alert on; Resource Health is the per-resource availability view with cause attribution. One tells you “Azure has an incident in your region”; the other tells you “this VM is Unavailable, and Azure caused it.”
Azure Advisor: your ranked improvement backlog
Advisor is a free, always-on recommendation engine. It continuously analyses your resource configuration and usage telemetry and produces personalised, actionable recommendations grouped into five categories. Think of it as a free architecture-and-FinOps reviewer that never sleeps. Every recommendation states the issue, the impact (High/Medium/Low), the affected resources, and a remediation — many with a one-click or Quick Fix action and a deferral/dismiss option.
| Category | What it optimises | Representative recommendations |
|---|---|---|
| Cost | Spend efficiency | Buy reservations/savings plans, right-size or shut down underutilised VMs, delete unattached public IPs / idle disks / orphaned resources |
| Security | Posture (powered by Defender for Cloud) | Enable MFA, encrypt disks, restrict network exposure, apply system updates — surfaced as Advisor’s Security tab |
| Reliability | Resilience & continuity (formerly “High Availability”) | Enable backup, use Availability Zones/Availability Sets, add soft delete, configure redundancy |
| Operational Excellence | Process, governance, manageability | Apply Azure Policy, add resource tags, adopt service best practices, fix deprecated API usage |
| Performance | Speed & responsiveness | Upgrade to Premium/faster disk or SKU tiers, tune SQL/Cosmos, improve App Service plan sizing |
Memory hook for the five categories: “Cost, Security, Reliability, Operational excellence, Performance” — the same pillars as the Microsoft Azure Well-Architected Framework. Advisor is essentially the Well-Architected review, automated and pointed at your live estate.
A subtlety worth knowing: Advisor’s Security recommendations are sourced from Microsoft Defender for Cloud — Advisor presents them, but Defender for Cloud is the engine and the place to manage them at depth. The other four categories are native to Advisor.
The Advisor Score
The Advisor Score is a single percentage (0–100%) for how closely your estate follows Advisor’s recommendations, with an overall score plus a per-category sub-score. It is consumption-/impact-weighted — recommendations on costlier or higher-impact resources move the needle more, so it is not a naive count — and it tracks a trend over time, which makes it a clean executive metric (“we moved reliability from 64% to 81% this quarter”). Dismissing or postponing a recommendation affects the score, so use those actions honestly. Treat it as a direction and a prioritiser, not a vanity number to game.
Azure Resource Graph: query your whole estate
If you learn one thing from this lesson for day-to-day work, make it Resource Graph. It is a fast, read-only query service over the Azure Resource Manager (ARM) metadata of every resource you can see — across all subscriptions and management groups in scope — using KQL (Kusto Query Language), the same language as Azure Monitor Logs. The portal blade is Resource Graph Explorer. Its point is scale and speed: per-resource blades are fine for one resource but fall apart at “show me every public IP across 200 subscriptions.” Resource Graph answers that in well under a second.
Why it is fast: it queries a pre-indexed snapshot of ARM metadata, not the live control plane resource-by-resource. The trade-offs that follow are the gotchas:
- Read-only metadata — properties, tags, SKUs, locations, config — not live runtime state (a VM’s CPU is Monitor metrics; container contents are not visible).
- A brief propagation delay (seconds to a couple of minutes) after a change before the index reflects it.
- Scope-bound to your RBAC — you see only resources you can read; widen by being granted Reader at a management group.
- Paging/row limits apply (use
--first/skip-token or the SDK for very large result sets).
The core tables you will use almost every day:
| Table | Contains |
|---|---|
| resources | All Azure resources (the default; VMs, disks, storage, NICs, public IPs, etc.) |
| resourcecontainers | Subscriptions and resource groups (and management groups) |
| advisorresources | Advisor recommendations as queryable rows |
| securityresources | Defender for Cloud assessments/alerts |
| healthresources | Resource Health states across the estate |
| patchassessmentresources | Update/patch assessment data |
KQL reads top-to-bottom as a pipeline: a table, then a series of | operators that filter and shape rows. The handful you need:
| Operator | Does |
|---|---|
where |
Filter rows by a condition |
project |
Choose/rename the columns to return |
extend |
Add a computed column |
summarize |
Aggregate (count, sum) grouped by columns |
order by |
Sort |
join |
Combine rows from two queries (e.g. resources to their subscription) |
mv-expand |
Expand an array/property bag into rows (great for tags) |
A first query — count every resource by type, biggest first (the fastest way to learn the exact type strings you’ll filter on, e.g. microsoft.compute/virtualmachines):
resources
| summarize count() by type
| order by count_ desc
A governance/security query — every storage account that still allows public blob access. The same shape covers most inventory questions: filter by type, where on a property, project the columns you want (use tostring(properties...) to pull values out of the nested property bag, as in the VM-size query in Q&A 8):
resources
| where type == "microsoft.storage/storageaccounts"
| where properties.allowBlobPublicAccess == true
| project name, resourceGroup, location, subscriptionId
A cost-hygiene query — public IPs not associated to anything (idle addresses you pay for); a tagging-compliance variant uses where isnull(tags['costcenter']), and you can join kind=leftouter to resourcecontainers to add the human-readable subscription name:
resources
| where type == "microsoft.network/publicipaddresses"
| where isempty(properties.ipConfiguration) and isempty(properties.natGateway)
| project name, sku.name, resourceGroup, location, subscriptionId
And Advisor itself is queryable — surface every High-impact Cost recommendation across the estate in one shot:
advisorresources
| where type == "microsoft.advisor/recommendations"
| where properties.category == "Cost"
| where properties.impact == "High"
| project recommendation = tostring(properties.shortDescription.problem),
          impactedResource = tostring(properties.resourceMetadata.resourceId),
          subscriptionId
That last query is the bridge between the three tools: advisorresources pulls Advisor’s backlog into the same query plane you inventory with — a one-screen operational view, no SIEM required.
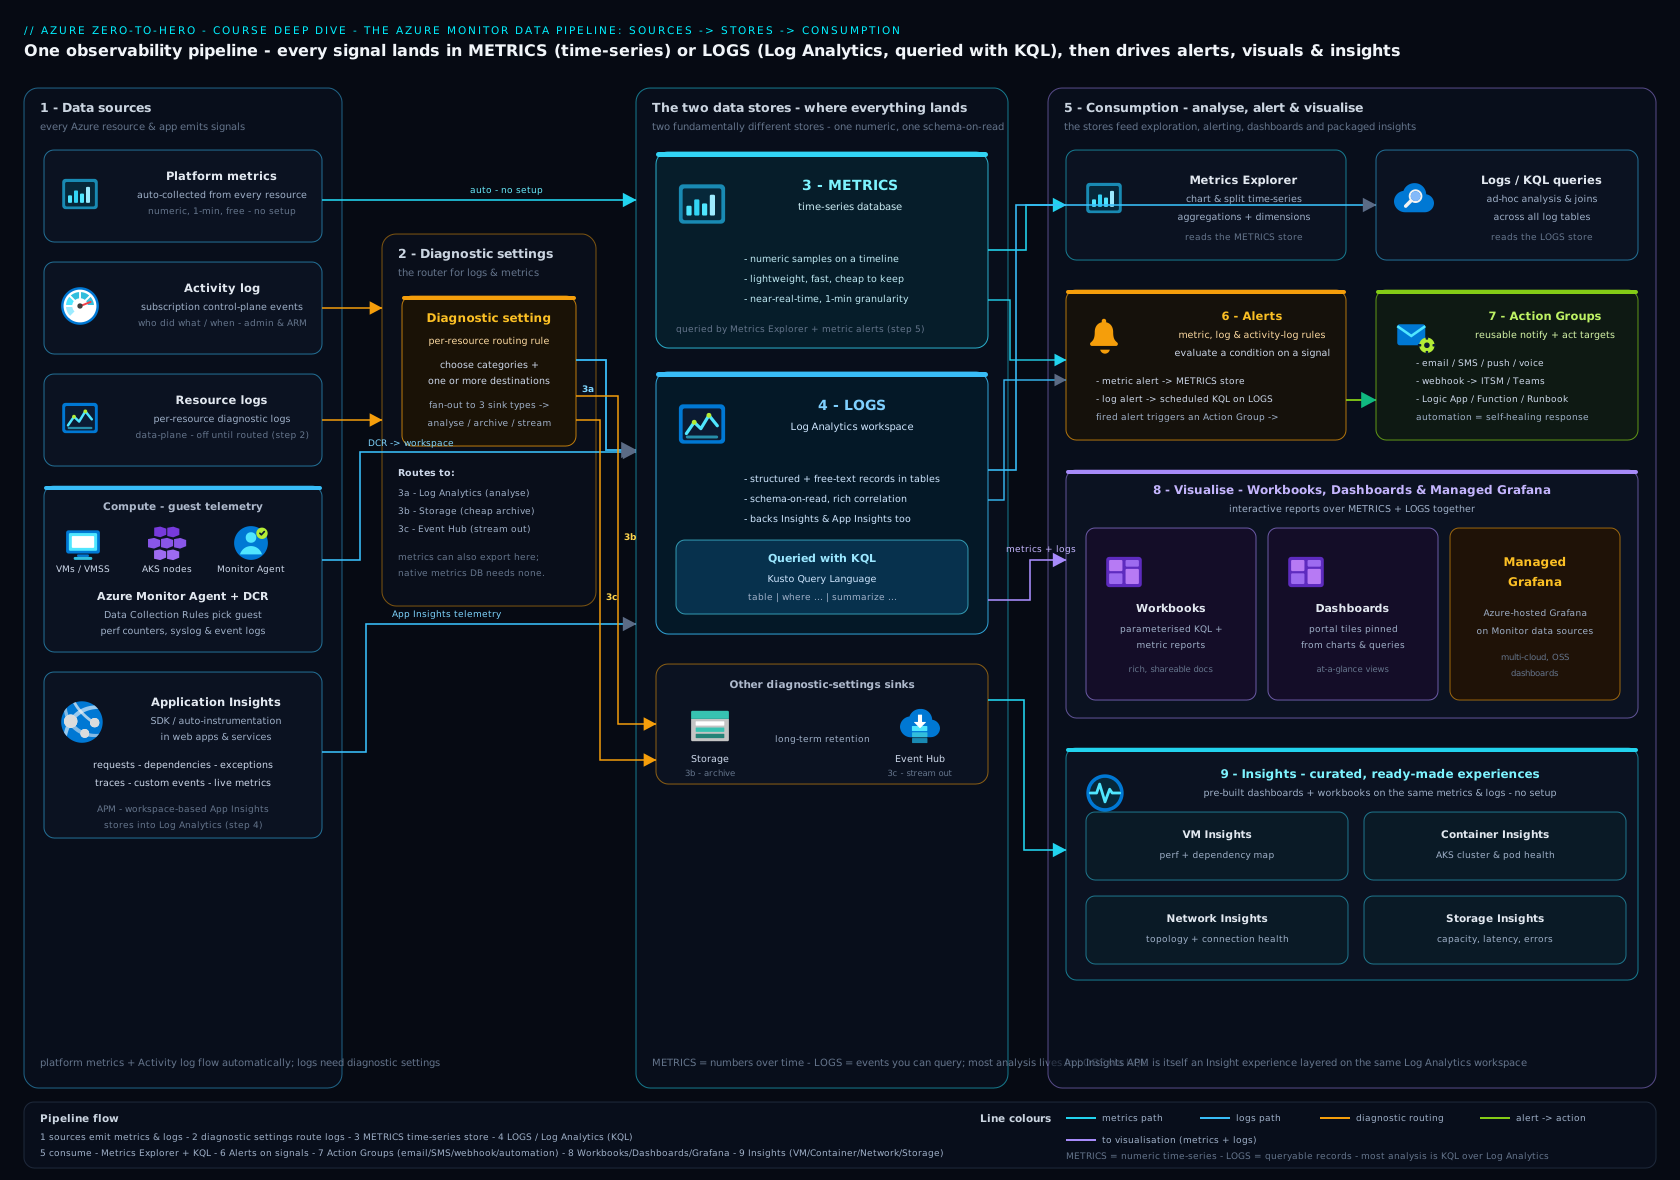
The diagram shows where these three services sit in the management plane: Service Health and Resource Health draw from platform telemetry and the Activity Log, Advisor and Defender for Cloud produce recommendations, and Resource Graph indexes ARM metadata across every subscription — all feeding the same alerting and dashboard surfaces as Azure Monitor.
Hands-on lab
Free, no resources created beyond an alert and an action group you delete at the end. You will run a Resource Graph query from the CLI and wire up a Service Health alert. Use Cloud Shell or a local az login.
1 — Add the Resource Graph CLI extension and run your first query. The extension installs on first use; confirm it works with a count by type:
az extension add --name resource-graph 2>/dev/null

az graph query -q "
resources
| summarize count() by type
| order by count_ desc
| limit 10
" --output table
Expected output: a two-column table of resource types and counts, highest first — your estate inventory in one call.
2 — Run a real governance query across every subscription you can read. Find unattached public IPs (idle spend) tenant-wide:
az graph query -q "
resources
| where type == 'microsoft.network/publicipaddresses'
| where isempty(properties.ipConfiguration) and isempty(properties.natGateway)
| project name, resourceGroup, location, subscriptionId
" --output table
Expected output: a table (possibly empty — that is a good result) of public IPs that are wasting money. To query a specific scope, add --subscriptions <id1> <id2> or --management-groups <mgId>.
3 — Create an action group so the alert has somewhere to send to. Replace the email:
RG=rg-svchealth-lab
az group create -n $RG -l australiaeast

az monitor action-group create \
  --resource-group $RG \
  --name ag-svchealth \
  --short-name svchealth \
  --action email oncall you@example.com
4 — Create a Service Health alert that fires on service issues (live incidents). Service Health alerts are Activity Log alerts scoped to the subscription; in the portal you would use Monitor → Service Health → Health alerts → Add, choosing event types, regions, and services. The CLI equivalent:
SUB=$(az account show --query id -o tsv)
AG_ID=$(az monitor action-group show -g $RG -n ag-svchealth --query id -o tsv)

az monitor activity-log alert create \
  --resource-group $RG \
  --name "alert-azure-service-issues" \
  --scope "/subscriptions/$SUB" \
  --condition category=ServiceHealth \
  --action-group "$AG_ID" \
  --description "Page on-call when Azure declares a service issue affecting this subscription"
In the portal you can narrow further to specific services and regions and to specific event types (Service issue / Planned maintenance / Health advisory / Security advisory). The CLI condition above matches the whole
ServiceHealthcategory; refine event-type/region filtering in the portal blade for production.
5 — Validate. Confirm the alert exists and is enabled:
az monitor activity-log alert show \
  -g $RG -n "alert-azure-service-issues" \
  --query "{name:name, enabled:enabled, scopes:scopes}" -o jsonc
You should see enabled: true. (You cannot safely force a real Azure incident, so validation here is confirming the rule is armed and pointed at your action group; the action group’s own test feature can send a sample notification.)
Cleanup:
az group delete --name rg-svchealth-lab --yes --no-wait
Cost note: Service Health alerts, Activity Log alerts, action groups, Advisor, Resource Health, and Resource Graph are all free. Action groups include a generous free tier of emails/notifications per month; SMS/voice and ITSM connectors can incur small charges. This lab costs effectively ₹0.
Going deeper
The core lesson gave you the three planes and one query each. This section is for the engineer who has to run this at estate scale: how the alert plumbing actually works, how the Advisor Score is really weighted, and how to turn Resource Graph from an ad-hoc query box into a governed, scheduled, cross-tenant capability.
Service Health under the hood: two alert planes, one Activity Log
The four event types are not just labels — they drive different human responses, and it pays to know their shape:
| Event type | Lifecycle you’ll see | What “done” looks like |
|---|---|---|
| Service issue | Investigating → Identified → Mitigating → Resolved, with running updates and a final PIR (Post-Incident Review) | You’ve tracked it, communicated, and read the PIR for root cause |
| Planned maintenance | Announced with a window; for many services you can self-trigger maintenance early in a window you pick | You rebooted/moved in your chosen window, not Azure’s |
| Health advisory | A deadline (deprecation, TLS/API retirement, quota or config change) | You migrated before the deadline |
| Security advisory | A security notification for a service you run | You assessed and remediated |
Before an incident is even formally classified you may see an emerging issue — Azure’s early, still-being-confirmed signal — surfaced on Azure Status and Service Health. It is a heads-up, not yet a committed incident.
Two distinct alert planes ride the Activity Log, and confusing them is the classic mistake:
- Service Health alert → Activity Log category
ServiceHealth, scoped to a subscription (optionally filtered to services, regions, and event types). “Is Azure broken for me?” - Resource Health alert → Activity Log category
ResourceHealth, scoped to a single resource, firing on transitions ofavailabilityState(e.g. Available → Unavailable). “Is this resource healthy?”
Both are control-plane (Activity Log) alerts — you match on event properties, never a numeric threshold — and both route to the same action groups as your metric alerts. Arm a Resource Health alert on your few genuinely critical resources:
# Reusing the lab's $RG and $AG_ID. Page when one critical VM leaves "Available".
VM_ID=$(az vm show -g $RG -n vm-prod-01 --query id -o tsv)   # placeholder resource

az monitor activity-log alert create \
  --resource-group $RG \
  --name "alert-vm-prod-01-unhealthy" \
  --scope "$VM_ID" \
  --condition category=ResourceHealth \
  --action-group "$AG_ID" \
  --description "Page on-call when vm-prod-01 becomes Unavailable or Degraded"
In the portal you refine further — current status (Unavailable/Degraded), previous status, and resource type — which the simple category=ResourceHealth condition leaves wide. One production caveat: availabilityState reports Unknown for a stopped/deallocated resource because the platform has no recent signal — that is expected, not an outage, so don’t page on Unknown alone. And because silencing alerts blinds operations, keep write access to alert rules and action groups least-privileged — an attacker who edits your Service Health alert removes your early warning.
Advisor: the five pillars, the score, and operationalizing it
The five categories map one-to-one onto the Well-Architected Framework pillars — Advisor is essentially a continuous, automated WAF review pointed at your live estate. Reliability was formerly labelled “High Availability,” and the Security category is not native: it is surfaced from Microsoft Defender for Cloud, which remains the engine and the place to manage posture in depth.
The Advisor Score deserves a precise mental model, because leaders will ask about it:
- It is 0–100%, with an overall score and a per-category sub-score.
- It is consumption- and impact-weighted — a recommendation on a costly, high-blast-radius resource moves the needle far more than one on a trivial resource. It is emphatically not a naive count of open recommendations.
- Each category shows a potential score increase (the points you’d gain by acting) so you can triage by return-on-effort.
- It carries a trend over time — the clean executive metric (“we moved Reliability from 64% to 81% this quarter”).
- Dismissing or postponing a recommendation changes the score. Use those actions honestly; gaming the number by dismissing real findings just blinds you.
Operationalizing Advisor means getting it out of the portal and into your workflow:
# Query the backlog from the CLI
az advisor recommendation list --category Cost \
  --query "[?impact=='High'].{problem:shortDescription.problem, resource:resourceMetadata.resourceId}" \
  -o table

# Tune the engine: exclude noise / change the low-utilisation CPU threshold used for right-sizing
az advisor configuration update --low-cpu-threshold 10
Three more operational levers:
- Exports — recommendations are queryable as rows via the
advisorresourcestable (below), downloadable as CSV/PDF from the portal, and reachable through the Advisor REST API for a warehouse or FinOps pipeline. - Digests & alerts — configure a periodic email digest of new recommendations, and set an Advisor alert (an Activity Log alert on category
Recommendation) so a newly-surfaced High-impact recommendation pages an action group automatically. - Quotas — some limit/quota risks surface as Advisor recommendations; the dedicated Azure Quotas experience is where you view usage against limits and request increases before you hit a wall mid-scale-out.
Azure Resource Graph at scale: KQL over the ARM inventory
Resource Graph is fast because it queries a pre-indexed projection of Azure Resource Manager metadata, not the live control plane resource-by-resource. That single design choice explains every strength (sub-second, estate-wide) and every limit (metadata only, brief propagation delay). Beyond the tables in the core lesson, two change tables unlock audit-style questions:
| Table | Contains |
|---|---|
| resources | Every resource’s ARM metadata — the default table |
| resourcecontainers | Subscriptions, resource groups, and management groups |
| resourcechanges | Create/Update/Delete events per resource, retained ~14 days (change analysis) |
| resourcecontainerchanges | The same change stream for subscriptions/RGs/MGs |
| healthresources / advisorresources / securityresources | Resource Health states, Advisor recs, Defender assessments as rows |
ARG runs a subset of full Kusto (KQL) — most day-to-day operators are present, but not every cross-cluster feature. The two patterns worth mastering are joins and change analysis.
A join stitches a friendly subscription name onto raw resources rows (which only carry the GUID):
resources
| where type == "microsoft.compute/virtualmachines"
| project name, subscriptionId, resourceGroup,
          vmSize = tostring(properties.hardwareProfile.vmSize)
| join kind=leftouter (
    resourcecontainers
    | where type == "microsoft.resources/subscriptions"
    | project subscriptionId, subscription = tostring(name)
  ) on subscriptionId
| project subscription, name, vmSize, resourceGroup
| order by subscription asc
Change analysis answers “who changed or deleted what, and when” without opening the Activity Log per resource:
resourcechanges
| extend changeTime = todatetime(properties.changeAttributes.timestamp),
         changeType = tostring(properties.changeType),
         target     = tostring(properties.targetResourceId),
         changedBy  = tostring(properties.changeAttributes.changedBy)
| where changeTime > ago(1d)
| project changeTime, changeType, target, changedBy
| order by changeTime desc
Two casing gotchas that eat hours: KQL’s == is case-sensitive, and ARG stores type and location lowercase — paste the portal’s Microsoft.Compute/virtualMachines with == and you get zero rows. Match lowercase, or use the case-insensitive =~. And nested values live in a property bag, so wrap them in tostring(...)/toint(...) (as in tostring(properties.hardwareProfile.vmSize)) before you project or compare them.
You reach the engine four ways: the portal Resource Graph Explorer, the CLI (az graph query), PowerShell (Search-AzGraph), and inside Azure Monitor Workbooks via an arg() query tile. For scale and governance:
- Paging — a query returns up to 1,000 rows per page; the CLI defaults to 100, so pass
--first 1000, and follow a skip-token (or--skip) for larger sets rather than assuming you saw everything. - Scope — query at a management group (
--management-groups <mgId>/Search-AzGraph -ManagementGroup) so one query covers the estate; results are always RBAC-bound to what you can read. - Cross-tenant — a single query is single-tenant by default; spanning tenants needs Azure Lighthouse delegation (or the SDK’s partial-scope options).
- Shared queries — promote a good query from a personal favourite to a shared query, an ARM resource anyone with RBAC can run and pin:
resource idlePublicIps 'Microsoft.ResourceGraph/queries@2020-04-01-preview' = {
  name: 'idle-public-ips'
  location: 'global'
  properties: {
    description: 'Public IPs with no association — idle spend'
    query: '''resources
| where type == "microsoft.network/publicipaddresses"
| where isempty(properties.ipConfiguration) and isempty(properties.natGateway)
| project name, resourceGroup, location, subscriptionId'''
  }
}
A query pack like this — versioned in source control, run on a schedule — is how a platform team keeps governance honest. Wire it to CI so the estate is scanned automatically, using OIDC federation (no stored secret) and management-group scope:
name: weekly-governance-scan
on:
  schedule:
    - cron: "0 6 * * 1"   # 06:00 UTC every Monday
  workflow_dispatch: {}
permissions:
  id-token: write         # OIDC federated login to Azure — no client secret stored
  contents: read
jobs:
  arg-scan:
    runs-on: ubuntu-latest
    steps:
      - uses: azure/login@v2
        with:
          client-id: ${{ secrets.AZURE_CLIENT_ID }}
          tenant-id: ${{ secrets.AZURE_TENANT_ID }}
          subscription-id: ${{ secrets.AZURE_SUBSCRIPTION_ID }}
      - name: Idle public IPs across the platform management group
        run: |
          az extension add --name resource-graph --only-show-errors
          az graph query --management-groups ${{ vars.MG_ID }} --first 1000 -q "
            resources
            | where type == 'microsoft.network/publicipaddresses'
            | where isempty(properties.ipConfiguration) and isempty(properties.natGateway)
            | project name, resourceGroup, location, subscriptionId
          " --output table
Combining all three into one free ops dashboard
The pay-off is a single, no-SIEM operational view. Build an Azure Dashboard (or a Monitor Workbook with arg() tiles) that carries: a Service Health banner for live incidents; a healthresources tile listing anything not Available; the Advisor Score and an advisorresources backlog filtered to High impact; and two or three pinned resources inventory/cost queries (idle IPs, unattached disks, untagged resources). Share it read-only with the team, and your weekly routine becomes one screen, top to bottom: is Azure healthy → what should we fix → what do we even have.
Practice challenges
Six exercises, beginner → advanced. Run the KQL in Resource Graph Explorer or with az graph query -q "...". Try each before opening the solution. An empty result is often a good result (nothing misconfigured), not a broken query.
1 (Beginner) — Inventory by subscription. Count how many resources sit in each subscription, largest first.
<details> <summary>Solution</summary>
resources
| summarize resources = count() by subscriptionId
| order by resources desc
Why: summarize count() by is the workhorse aggregation; grouping by subscriptionId instantly shows which subscriptions carry the most sprawl — your first governance signal.
</details>
2 (Beginner → Intermediate) — Insecure storage, tenant-wide. Find every storage account that still accepts plain HTTP (i.e. is not HTTPS-only) across everything you can read.
<details> <summary>Solution</summary>
resources
| where type == "microsoft.storage/storageaccounts"
| where properties.supportsHttpsTrafficOnly == false
| project name, resourceGroup, location, subscriptionId
Why: supportsHttpsTrafficOnly == false means the account will serve unencrypted requests — a one-query audit that scales to the whole estate instead of opening each account’s blade.
</details>
3 (Intermediate) — Resource Health alert, not Service Health. In the lab you armed a Service Health alert. Now arm a Resource Health alert so one critical VM pages you when it leaves Available. Which Activity Log category, and how does it differ from the lab’s alert?
<details> <summary>Solution</summary>
VM_ID=$(az vm show -g $RG -n vm-prod-01 --query id -o tsv)   # placeholder VM
az monitor activity-log alert create \
  --resource-group $RG --name "alert-vm-prod-01-unhealthy" \
  --scope "$VM_ID" --condition category=ResourceHealth \
  --action-group "$AG_ID"
Why: Service Health alerts use category ServiceHealth scoped to a subscription (platform-wide); Resource Health alerts use ResourceHealth scoped to a single resource ID. One says “Azure has an incident in my region,” the other “this VM specifically is unhealthy.”
</details>
4 (Intermediate) — Join for human-readable names. List every VM with its subscription display name (not the GUID), size, and resource group.
<details> <summary>Solution</summary>
resources
| where type == "microsoft.compute/virtualmachines"
| project name, subscriptionId, resourceGroup,
          vmSize = tostring(properties.hardwareProfile.vmSize)
| join kind=leftouter (
    resourcecontainers
    | where type == "microsoft.resources/subscriptions"
    | project subscriptionId, subscription = tostring(name)
  ) on subscriptionId
| project subscription, name, vmSize, resourceGroup
| order by subscription asc
Why: resources carries only the subscription GUID; resourcecontainers holds the friendly name, and a leftouter join on subscriptionId stitches them together — the reusable pattern for any “add the readable name” report.
</details>
5 (Advanced) — Change analysis. Using the change-analysis table, list every resource deleted in the last 7 days and who deleted it.
<details> <summary>Solution</summary>
resourcechanges
| extend changeTime = todatetime(properties.changeAttributes.timestamp),
         changeType = tostring(properties.changeType),
         target     = tostring(properties.targetResourceId),
         changedBy  = tostring(properties.changeAttributes.changedBy)
| where changeType == "Delete" and changeTime > ago(7d)
| project changeTime, target, changedBy
| order by changeTime desc
Why: resourcechanges records create/update/delete events for ~14 days; filtering changeType == "Delete" turns Resource Graph into a lightweight, RBAC-scoped audit trail without paging the Activity Log resource-by-resource.
</details>
6 (Advanced) — Advisor backlog as a governance pack. Produce the estate’s High-impact recommendation backlog grouped by category, then describe how to make it a reusable, shareable asset.
<details> <summary>Solution</summary>
advisorresources
| where type == "microsoft.advisor/recommendations"
| extend category = tostring(properties.category),
         impact   = tostring(properties.impact)
| where impact == "High"
| summarize count() by category
| order by count_ desc
Save it as a shared query (Microsoft.ResourceGraph/queries), grant the platform team Reader on it, and pin the tile to a shared Azure Dashboard beside the Advisor Score.
Why: advisorresources brings Advisor’s backlog into the same query plane as your inventory; promoting a good query to a shared, version-controlled asset turns a one-off into a governance pack the whole team runs on schedule.
</details>
Common beginner mistakes
These are misconceptions — wrong mental models — distinct from the symptom→fix troubleshooting table above.
- “The public Azure Status page is my incident alert.”
status.azure.comis global and unauthenticated: it shows the world’s biggest fires, is not filtered to your services and regions, and you cannot alert on it. The personalised, alertable view is Service Health in the portal. Right model: keep Status for broad context, but wire a Service Health alert for paging. - “Service Health and Resource Health are the same screen.” One is platform-wide (“is Azure having an incident in my region?”), the other is a single resource (“is this VM Available, and who caused it?”). Reaching for the wrong one wastes the first ten minutes of an incident.
- “A high Advisor Score means I’m finished.” The score is impact-weighted, not a checklist you complete once — and dismissing real recommendations to inflate it just blinds you. Treat the trend as the signal, and dismiss only genuine false positives.
- “Resource Graph shows live state, so I’ll check CPU there.” ARG is a metadata index — SKUs, tags, config, locations — not runtime telemetry. CPU, memory, and latency live in Azure Monitor metrics; in-guest and container-internal state are not visible at all.
- “My query returned nothing, so it’s broken.” Three innocent causes before you blame the query: you only see subscriptions you have Reader on (RBAC scope), your
typestring’s casing is off (next point), or there genuinely are none — an empty “idle public IPs” result is a win. - “
==will match the type I copied from the portal.” KQL’s==is case-sensitive, and ARG storestype/locationlowercase. PasteMicrosoft.Compute/virtualMachineswith==and you get zero rows. Fix: match lowercase, use the case-insensitive=~, and always confirm the exact string withsummarize count() by typefirst.
Common mistakes & troubleshooting
| Symptom | Likely cause | Fix |
|---|---|---|
| “We found out about the outage from Twitter” | No Service Health alert configured | Create a Service Health Activity Log alert → action group for the on-call rota |
| Resource Graph returns far fewer resources than expected | Query is scoped to one subscription or you lack reader on others | Add --management-groups/--subscriptions, or get granted Reader at the management group |
KQL where type == "..." returns nothing |
Resource type string is wrong/cased oddly | Type comparisons in Resource Graph are case-insensitive for the value, but get the exact type from a summarize count() by type first |
| A just-created resource is missing from query results | Index propagation delay (seconds–minutes) | Wait briefly and re-run; Resource Graph is a near-real-time snapshot, not the live control plane |
| Advisor shows no Cost recommendations | Subscription too new / too little usage telemetry | Advisor needs days of utilisation data; cost right-sizing appears after enough signal accumulates |
| Resource Health says Unknown for a stopped VM | Resource is deallocated — no recent platform signal | Expected; Unknown ≠ broken. Start the resource to restore a signal |
| Service Health alert never fires though there was an incident | The incident did not affect your subscriptions/regions/services | Service Health is personalised; broaden region/service filters if you want wider awareness |
az graph query errors with “extension not installed” |
resource-graph extension missing |
az extension add --name resource-graph |
Best practices
- Always configure a Service Health alert as part of every subscription’s baseline — it is free and it is the difference between proactive and embarrassed.
- Scope Resource Graph at a management group, not subscription-by-subscription, so a single query truly covers the estate.
- Save and version your Resource Graph queries — keep a library of governance/inventory/cost queries in source control and run them on a schedule.
- Triage Advisor weekly, top-down by impact, and treat Security items (from Defender for Cloud) with priority; track the Advisor Score trend as your improvement KPI.
- Pin key Resource Graph results and the Advisor Score to a shared dashboard so the whole team sees inventory drift and posture at a glance.
- Use Resource Health alerts for your few genuinely critical resources, and Service Health alerts for the platform — do not try to make one cover the other.
Security notes
Resource Graph is read-only and RBAC-scoped — it never mutates resources and never exposes anything you cannot already read, so it is safe to grant broadly via Reader. That same property makes it a superb security-audit tool: use securityresources and resources queries to find public exposure, missing encryption, or non-compliant configuration across the whole tenant in one pass, and feed the results to your remediation pipeline. Advisor’s Security category is your continuous, free posture check sourced from Defender for Cloud; act on its High-impact items first. And lock down who can edit Service Health alerts and action groups — an attacker who silences your alerting blinds your operations — so keep Monitor/alert-rule write permissions least-privileged.
Interview & exam questions
1. What is the difference between Service Health and Resource Health? Service Health is the tenant-scoped, platform-wide view of Azure’s own health — service issues, planned maintenance, health advisories, security advisories — filtered to your subscriptions, regions, and services, and you can alert on it. Resource Health reports the current availability of a single resource (Available/Unavailable/Degraded/Unknown) with cause attribution (platform- vs user-initiated). Service Health = “is Azure broken for me?”; Resource Health = “is this resource healthy and who caused it?”
2. How do you get paged when Azure has an incident affecting your workloads?
Create a Service Health alert — an Activity Log alert on the ServiceHealth category — scoped to your subscription/regions/services and event types, routed to an action group (email, SMS, webhook, PagerDuty/ITSM). It fires automatically when Azure posts a matching event.
3. Name the four Service Health event types. Service issues (live incidents), planned maintenance, health advisories (actions you must take, e.g. deprecations), and security advisories.
4. What are the five Azure Advisor categories? Cost, Security, Reliability, Operational Excellence, Performance — the same pillars as the Well-Architected Framework. (Security recommendations are surfaced from Defender for Cloud.)
5. What is the Advisor Score and what makes it more than a count? A 0–100% measure (overall plus per-category) of how well your estate follows Advisor’s best practices. It is consumption-/impact-weighted — recommendations on costlier or higher-impact resources count more — and it has a trend over time, which makes it a useful executive KPI rather than a raw tally.
6. What is Azure Resource Graph and what language does it use? A fast, read-only query service over ARM resource metadata across all subscriptions/management groups in your RBAC scope, queried with KQL (Kusto). It is built for estate-wide inventory and governance questions at sub-second speed.
7. Why is Resource Graph so fast, and what is the trade-off? It queries a pre-indexed snapshot of ARM metadata rather than walking the live control plane resource-by-resource. The trade-off: it returns metadata only (no live runtime state) and there is a short propagation delay after changes before the index updates.
8. Write a Resource Graph query to find all VMs and their sizes across the tenant.
resources | where type == "microsoft.compute/virtualmachines" | project name, vmSize = tostring(properties.hardwareProfile.vmSize), location, resourceGroup, subscriptionId — filter on the type, then project the size out of the properties bag with tostring.
9. A user reports a single VM is unreachable. Which tool tells you whether Azure caused it, and how? Resource Health on that VM — it shows the current state and cause attribution (platform-initiated such as host fault/maintenance, vs user-initiated such as a deallocate). Cross-check Service Health to see whether a broader regional incident is in play.
10. Resource Graph returns only resources in one subscription. Why, and how do you widen it?
Results are RBAC-scoped and default to your accessible subscriptions; if you can only read one, you see one. Fix by passing --management-groups/--subscriptions and obtaining Reader at the management group so a single query covers the estate.
11. Where does the Advisor Security tab get its recommendations? From Microsoft Defender for Cloud — Advisor presents them, Defender for Cloud is the engine and the place to manage them in depth.
12. How would you build a free, single-screen “what should we fix?” view across many subscriptions?
Query the advisorresources table in Resource Graph (filter by category/impact) and pin the result plus the Advisor Score and key resources inventory queries to a shared dashboard — no SIEM, all free.
Quick check
- Which tool do you alert on to know about Azure incidents in your regions — Service Health or Resource Health?
- Name all five Azure Advisor categories.
- What language does Azure Resource Graph use, and over what data?
- Why might a resource you created 30 seconds ago not appear in a Resource Graph query yet?
- The Advisor Score is weighted by what (so it is not a naive count)?
Answers
- Service Health — it is the tenant-scoped platform view you can raise Activity Log alerts on. (Resource Health alerts exist too, but only for a single resource.)
- Cost, Security, Reliability, Operational Excellence, Performance.
- KQL (Kusto Query Language), over a pre-indexed snapshot of Azure Resource Manager metadata for every resource in your RBAC scope.
- Index propagation delay — Resource Graph queries a near-real-time snapshot, so a brand-new change takes seconds to a couple of minutes to appear.
- Consumption/impact — recommendations on costlier or higher-impact resources move the score more than trivial ones.
Exercise
Build your own free, estate-wide operational view. (1) Create a Service Health alert on the ServiceHealth category routed to an action group with your email, and confirm with az monitor activity-log alert show that it is enabled. (2) Write and run three Resource Graph queries from the CLI: an inventory query (count resources by type), a governance query (find storage accounts with allowBlobPublicAccess == true or untagged resources missing a costcenter tag), and an Advisor query against advisorresources filtered to impact == "High". (3) Open Advisor in the portal, read your Advisor Score and its per-category breakdown, and write one short paragraph: which category is your weakest, the single highest-impact recommendation it lists, and the order in which you would action your top three findings. Clean up with az group delete on the lab resource group. The goal is a repeatable weekly routine: is Azure healthy → what should we fix → what do we even have.
Certification mapping
| Exam | Skills this lesson covers |
|---|---|
| AZ-104 (Azure Administrator) | Monitor and maintain Azure resources: configure and interpret Service Health and Resource Health, create Service Health / Activity Log alerts with action groups; use Azure Advisor recommendations across all five categories and the Advisor Score; query the estate with Azure Resource Graph and KQL for inventory, governance, and cost hygiene. The az graph query and alert-creation steps mirror the exam’s task-based items. |
| AZ-305 (Solutions Architect) | Design monitoring and governance: incorporate Advisor (Well-Architected-aligned) into a continuous-improvement loop, design tenant-wide Resource Graph-based inventory/compliance reporting at management-group scope, and design Service Health alerting into incident-response and operational-readiness processes. |
Glossary
- Service Health — Tenant-scoped view of Azure platform health (service issues, planned maintenance, health/security advisories), alertable via the Activity Log.
- Resource Health — Per-resource availability view (Available/Unavailable/Degraded/Unknown) with platform- vs user-initiated cause attribution.
- Azure Status — The public, global, unauthenticated Azure health page (status.azure.com); not personalised and not alertable.
- Service issue — A live Azure incident (outage/degradation) currently affecting your services/regions.
- Planned maintenance — Scheduled Azure maintenance that may reboot or briefly affect resources.
- Health advisory — A notice requiring your action (deprecations, retirements, configuration/quota changes).
- Azure Advisor — Free recommendation engine producing personalised, ranked best-practice guidance across five categories.
- Advisor Score — A 0–100% consumption-/impact-weighted measure (overall and per-category) of adherence to Advisor’s recommendations, tracked over time.
- Well-Architected Framework — Microsoft’s five-pillar design framework (Cost, Security, Reliability, Operational Excellence, Performance) that Advisor’s categories mirror.
- Azure Resource Graph — Fast, read-only KQL query service over ARM resource metadata across all subscriptions/management groups in scope.
- KQL (Kusto Query Language) — The pipeline-style query language used by Resource Graph and Azure Monitor Logs.
- resources / resourcecontainers / advisorresources — Key Resource Graph tables: all resources; subscriptions/RGs/MGs; Advisor recommendations as rows.
- Action group — A reusable set of notification/automation targets (email, SMS, webhook, ITSM/PagerDuty) that alerts route to.
- Activity Log alert — A control-plane alert that matches on event properties (e.g. the
ServiceHealthcategory) rather than a numeric threshold. - Defender for Cloud — The engine behind Advisor’s Security recommendations and the place to manage posture at depth.
- Security advisory — The fourth Service Health event type: security-related notifications for services you run; assess and remediate.
- Emerging issue — An early, still-being-confirmed platform problem surfaced on Azure Status / Service Health before it is classified as a full service issue.
- Resource Health alert — An Activity Log alert on the
ResourceHealthcategory, scoped to a single resource, that fires when it leaves Available. - healthresources — The Resource Graph table exposing per-resource availability states (
microsoft.resourcehealth/availabilitystatuses) across the estate. - resourcechanges (change analysis) — The Resource Graph table recording create/update/delete events per resource for ~14 days — a lightweight, RBAC-scoped audit trail.
=~(case-insensitive equals) — The KQL operator that matches strings regardless of case; contrast with==, which is case-sensitive.- Shared query — A saved Resource Graph query stored as an ARM resource (
Microsoft.ResourceGraph/queries), shareable via RBAC and pinnable to dashboards; the basis of a governance query pack. - skip-token / paging — Resource Graph returns up to 1,000 rows per page; larger result sets are retrieved by following a skip-token (or
--first/--skipin the CLI). - Advisor digest / Advisor alert — A periodic email summary of new recommendations, and an Activity Log alert (category
Recommendation) that routes new recommendations to an action group. - Azure Lighthouse — Cross-tenant delegated resource management; the mechanism that lets a single Resource Graph query span multiple tenants.
- Azure Quotas — The experience for viewing usage against subscription limits and requesting increases; some quota/limit risks also surface as Advisor recommendations.
Next steps
- Azure Backup & Site Recovery Deep Dive — the natural sequel: once you can see incidents and estate state, protect against them with point-in-time backup and region/zone failover, and wire backup/DR alerts into the same action groups you built here.
- Azure Monitor Deep Dive — go deeper on the metrics, logs, KQL, workbooks, and alerting pipeline that complement this operational-awareness layer.
- Microsoft Entra ID & Governance Admin Deep Dive — lock down who can read across the estate and edit alerts, and understand the management-group scope that Resource Graph queries span.