A payments platform team ships a checkout service forty times a week to a 30-node EKS cluster, and the last three Sev-2 incidents all followed the same script: a deploy went green, the pods passed their readiness probes, and only fifteen minutes later did the p99 latency and the 5xx rate creep past the threshold — by which point the bad version was already taking 100% of traffic and the on-call was reverse-engineering a rollback at 2 a.m. The mandate from the new head of platform is blunt: “No release takes full traffic until the metrics prove it is healthy, and if it is not, roll it back without a human.” That is exactly what Harness Continuous Delivery (CD) with Continuous Verification (CV) does — a progressive canary rollout where each traffic increment is gated by an automated analysis of Prometheus and Datadog metrics that compares the canary against the stable baseline and auto-rolls-back on a regression. This guide builds that pipeline end to end, as pipeline-as-code, with the real YAML.
The pattern is worth naming precisely because teams conflate two things. A canary shifts a small slice of traffic to the new version. Continuous Verification is the judgment layer on top: Harness queries your observability stack during the canary window, runs anomaly detection — a time-series comparison against a baseline, or a fixed threshold — over the metrics you nominate, assigns a risk score per metric and an overall verdict, and either promotes to the next phase or fails the stage and triggers rollback. Without CV, a canary is just a slower way to ship a bad build to everyone. With it, the metrics make the promotion decision. Harness’s differentiator over a hand-rolled Argo Rollouts + AnalysisTemplate stack (which the sibling Set Up Argo Rollouts with Datadog Metric Analysis for Automated Canary Promotion covers) is that CV ships as a first-class pipeline step with learned baselines, a delegate that runs the queries from inside your network, and a control plane that already owns RBAC, secrets, and approvals.
By the end you will understand the object model (how a pipeline references a service, an environment, an infrastructure definition, connectors, and a delegate), the three deployment strategies and when each fits, the mechanics of CV (health sources, analysis type, sensitivity, the risk score, the baseline), and how to express all of it as reviewable YAML in Git so a pipeline is a pull request, not a pile of forms. You will build the real thing against EKS, break it on purpose to prove the gate fires, and tear it down. This is an implementation guide; the hands-on lab is the centrepiece.
What problem this solves
The core failure this addresses is the detection lag between “the deploy succeeded” and “the deploy is bad.” A Kubernetes rolling update declares victory the moment new pods pass their readiness probe — but that probe answers “can this pod accept a connection?”, not “does this version return correct results at acceptable latency under real traffic?”. A version can be perfectly ready and still leak a 2% error rate on one code path, add 300 ms of p99 latency under load, or double database calls per request — none of which trips a readiness probe. By the time a human notices, via a customer complaint or a lagging-SLO alert, the bad version already serves everyone.
What breaks without this: teams either ship fast and eat the incidents, or they slow to a crawl with manual bake times and staring-at-Grafana ceremonies that don’t scale past a handful of deploys a week and depend on a human being awake at exactly the wrong hour. The middle path — a canary that a machine judges against real metrics and rolls back autonomously — removes both the incidents and the human toil, and the expensive incident it prevents (a bad release reaching 100% traffic) pays for the whole setup on the first auto-rollback.
Who hits this: any team practising continuous delivery to Kubernetes at a cadence where manual verification doesn’t scale — SaaS, payments, ad-tech, anywhere a bad deploy costs money per minute. It bites hardest where the workload is latency-sensitive and multi-dependency (a checkout that fans out to a payment provider, a fraud service, and an inventory DB), because those are exactly the regressions readiness probes miss. It also matters for regulated shops that need an audit trail proving each production change was verified and, on failure, rolled back — which is why the ServiceNow and RBAC pieces are not optional decoration here.
The spectrum of “how do I know a deploy is safe?”, weakest to strongest, and where Harness CV sits:
| Verification approach | What it actually checks | Detection lag | Human required | Where it fails |
|---|---|---|---|---|
| Readiness probe only | Pod accepts a TCP/HTTP connection | Seconds — but only checks liveness | No | Misses latency/error/correctness regressions entirely |
| Smoke test post-deploy | A handful of synthetic requests pass | Seconds | No (in pipeline) | Passes on low volume; misses load-dependent bugs |
| Manual bake + eyeball Grafana | A human watches dashboards for N minutes | Minutes to hours | Yes, and awake | Doesn’t scale; subjective; 2 a.m. problem |
| Fixed-threshold alert after 100% | Error rate/latency crosses a static line | Minutes — after full rollout | On-call paged | Bad version already serves everyone |
| Canary (traffic split) no gate | Small slice on new version | Depends on who’s watching | Yes, to promote | “Slower way to ship a bad build to everyone” |
| Canary + Continuous Verification | ML/threshold analysis of real metrics, canary vs baseline, during the window | Minutes, before promotion | No — auto-promote or auto-rollback | Noisy metrics + wrong sensitivity → false rollbacks (tunable) |
Learning objectives
By the end of this article you can:
- Explain the Harness CD object model end to end — pipeline → stage → service → environment → infrastructure definition → connectors → delegate — and how a change to one propagates.
- Install and register a Harness Delegate into EKS with Helm, scope its Kubernetes RBAC to least privilege, and confirm it runs both the deploy and the metric queries.
- Choose correctly between canary, blue-green, and rolling strategies, and name the trade-off each makes on traffic, cost, and rollback speed.
- Wire Continuous Verification as a pipeline step: create a Monitored Service, add Prometheus and Datadog health sources, set the analysis type (canary/threshold/baseline), and tune sensitivity and duration so the gate is decisive without false rollbacks.
- Express the whole pipeline as pipeline-as-code YAML in Git, so a deployment change is a reviewable pull request.
- Resolve all credentials from HashiCorp Vault via the delegate’s Kubernetes auth, and gate human access with Okta → Entra ID SSO mapped to Harness RBAC.
- Insert a ServiceNow change-approval gate ahead of production and understand how a CV-triggered rollback updates the ITSM record.
- Diagnose the classic CV failures (empty window, canary/baseline series not separated, delegate can’t reach the metric backend, mis-tuned sensitivity) from the signal each produces.
Prerequisites & where this fits
You should already be comfortable with Kubernetes fundamentals — Deployments, Services, readiness/liveness probes, kubectl, Helm v3 — and with the idea of a container image built and pushed by an upstream CI pipeline (this article deploys and verifies that image; it does not build it). You should understand what Prometheus and Datadog are and how a PromQL/Datadog metric query is shaped, because CV is only as good as the queries you point it at. Familiarity with progressive delivery (canary, blue-green) helps but isn’t required — Core concepts builds the model from scratch.
Concretely, the lab prerequisites — what each is for, and the gotcha if it’s missing:
| Prerequisite | Why it’s needed | Version / detail | If missing |
|---|---|---|---|
| Harness account + CD & GitOps module | The control plane and pipeline engine | SaaS or Self-Managed EE | No pipeline to build |
| Role: create Projects/Connectors/Envs/Pipelines | Authoring permission | Account/Org admin or a scoped role | Can’t create the objects |
Kubernetes cluster + admin kubectl |
The deploy target | EKS 1.29 (examples) | Nowhere to deploy |
| Canary-capable Deployment manifest in Git | Source of the workload spec | Must tolerate the harness.io/track label |
Canary can’t clone/tag pods |
| Prometheus scraping the workload | CV signal (latency/error) | kube-prometheus-stack, private ClusterIP | No in-cluster metrics for CV |
| Datadog account + API & App keys | CV signal (APM/host) | Keys stored in Vault | No APM/host metrics for CV |
| HashiCorp Vault | Runtime secret resolution | k8s auth method enabled | Secrets end up inline (bad) |
kubectl, helm v3, harness CLI |
Local tooling | Current versions | Can’t install/apply from your workstation |
Where this sits: it is the delivery and verification layer on top of your build pipeline and in front of your runtime. It pairs tightly with the observability stack (CV consumes Prometheus and Datadog), your secrets platform (Vault, and Set Up External Secrets Operator to Sync Vault and AWS Secrets into Kubernetes if you sync secrets into the cluster too), and your ITSM/identity systems. It is a genuine alternative or complement to a pure-GitOps flow with Deploy Argo CD on Kubernetes with OIDC SSO, RBAC, and ApplicationSets for Multi-Cluster GitOps — the two coexist cleanly, and this article shows how.
A quick map of who owns which layer, so you route questions to the right team during an incident:
| Layer | What lives here | Who usually owns it | What it contributes to a CV rollout |
|---|---|---|---|
| Harness control plane (SaaS) | Pipeline, service, env defs; RBAC; UI | Platform / DevEx team | The pipeline definition and the verdict — never touches the cluster directly |
| Harness Delegate (in cluster) | Runs deploys + metric queries from inside the VPC | Platform team | Applies manifests, queries Prometheus/Datadog for CV |
| CI (GitHub Actions) | Build image, push to ECR, bump manifest tag | App / build team | The artifact CV will verify |
| Observability (Prometheus, Datadog) | Metrics, APM, dashboards | SRE / observability team | The signal CV analyses; wrong queries = wrong verdict |
| Secrets (HashiCorp Vault) | AWS role, Datadog keys, registry creds | Security / platform | Runtime-resolved credentials; nothing inline in YAML |
| Identity (Okta → Entra ID) | SSO, group claims → Harness roles | IAM team | Who can approve/override a production promotion |
| ITSM (ServiceNow) | Change request / incident records | Change management | The audit trail; auto-updated on CV rollback |
Core concepts
Six mental models make every later section obvious — get these right and the YAML reads itself.
The Harness object model is a small graph, not a monolith. A Pipeline is an ordered set of Stages. A deployment stage references three reusable objects: a Service (the what — manifests + artifact), an Environment (the where, e.g. prod), and an Infrastructure Definition (the concrete target — a specific EKS cluster + namespace, via a Connector). Every action runs on a Delegate — a worker Pod inside your network. The split buys reuse and blast-radius control: the checkout service is defined once and deployed to dev/staging/prod; a connector is defined once and referenced everywhere; a manifest change propagates to every pipeline using it. You assemble references, not copy-pasted config.
The Delegate is the only thing that touches your cluster. Harness Manager (the SaaS control plane) holds the pipeline definition but has no network path to your workloads. Every kubectl apply, Prometheus query, and Datadog API call runs on the delegate Pod inside your VPC, which reports results back over an outbound connection. This is what makes CV possible — the delegate reaches an in-cluster Prometheus at a private ClusterIP and Datadog over your egress because it is inside your network — and it means the delegate’s Kubernetes RBAC, not anything in the UI, is the real security boundary for what a pipeline can do to your cluster.
A canary is a traffic experiment; CV is the verdict on it. In a Kubernetes canary, Harness stands up N canary pods (a percentage of stable replicas) alongside the stable ReplicaSet, so a fraction of traffic hits the new version — the experiment. CV is the measurement and decision: during the window it runs your health-source queries, isolates canary-tagged from stable-tagged series, and asks “is the canary meaningfully worse than the baseline?” The output is a per-metric risk (green/amber/red) and an overall verdict — green promotes, red fails the stage and (with the failure strategy wired) rolls back. Without CV the canary promotes on a timer or a click; with CV it promotes on evidence.
CV’s analysis has a type, a baseline, and a sensitivity — those three decide everything. The analysis type picks the comparison: Canary (canary-tagged vs stable-tagged series from the same deploy — apples to apples), Rolling/Threshold (new version vs fixed min/max you set), or Baseline (vs a pinned prior known-good run). The baseline is what “normal” means. The sensitivity (LOW/MEDIUM/HIGH) sets how large a deviation counts as a regression — HIGH catches subtle regressions but risks false rollbacks on noisy metrics; LOW tolerates more but can miss real ones. Pick the type from your strategy, the baseline from what you trust as good, the sensitivity from how noisy your metrics are.
Health sources are metrics with a risk direction and a category. A Monitored Service binds a service+environment to one or more Health Sources (Prometheus, Datadog, AppDynamics, New Relic, Splunk, CloudWatch, Dynatrace, and more). Each metric carries a risk profile — a category (Errors, Performance/Response Time, Infrastructure/Saturation) and a direction (higher = higher risk, or lower = higher risk) so CV knows a rising 5xx rate is bad but a rising success count is not. Register only the metrics that genuinely decide health; every extra one is a chance to add noise and a false rollback.
The failure strategy is what removes the human. A CV verdict on its own just marks the step passed or failed. What turns “the Verify step failed” into “roll the whole thing back automatically” is the stage’s failure strategy: onFailure → errors: [Verification] → action: StageRollback. That single mapping is the 2-a.m.-eliminator — without it a red verdict pauses for a human; with it the bad version is torn down and stable restored before anyone is paged.
The vocabulary in one table
Before the deep sections, pin down every moving part. The glossary at the end repeats these for lookup; this table is the model side by side:
| Concept | One-line definition | Where it lives | Why it matters to a canary + CV rollout |
|---|---|---|---|
| Pipeline | Ordered set of stages | Harness project (as YAML in Git) | The unit you run; the reviewable artifact |
| Stage | One phase (Deployment, Approval, Custom) | Inside a pipeline | Canary+CV is a Deployment stage; approval is separate |
| Service | The what — manifests + artifact | Project-level, reused | Defines the workload CV verifies |
| Environment | The where — dev/staging/prod |
Project-level, reused | Prod is where CV and approvals matter most |
| Infrastructure Definition | Concrete target: cluster + namespace | Under an environment | Binds env to a real EKS + namespace via a connector |
| Connector | Credentialed link to an external system | Project/org/account level | K8s, ECR, Prometheus, Datadog, Vault, ServiceNow |
| Delegate | Worker process inside your network | A Pod in the cluster | Runs every deploy and every metric query |
| Monitored Service | Binds service+env to health sources | Under Project Setup | The container CV reads its metrics from |
| Health Source | A metric provider + its CV metrics | Inside a Monitored Service | Prometheus + Datadog here |
| Verify step | The CV gate in the pipeline | Inside the deployment stage | Runs the analysis, emits the verdict |
| Analysis type | Canary / Threshold / Baseline | On the Verify step | Decides the comparison method |
| Sensitivity | LOW/MEDIUM/HIGH regression threshold | On the Verify step | How subtle a regression fails the gate |
| Failure strategy | What to do when a step fails | On the stage | StageRollback on Verification = auto-rollback |
| Deployment strategy | Canary / Blue-Green / Rolling | On the deployment stage | How the new version replaces the old |
The Harness delivery model, layer by layer
The whole pipeline is an assembly of six object types. Enumerate each — what it is, what it references, what you set, the gotcha — and the YAML stops being mysterious.
Services, environments, and infrastructure definitions
The three-object split (service / environment / infrastructure definition) is the core of Harness’s reuse model; knowing which one holds which field separates a clean setup from duplicated config that drifts.
| Object | Holds | Does NOT hold | Reused across | Gotcha |
|---|---|---|---|---|
| Service | Manifests (source + path), artifact source (registry + image + tag), service variables | Cluster, namespace, credentials | Every environment you deploy it to | Tag is usually <+input> so the same service ships any build |
| Environment | Name, type (Production/PreProduction), env-level variables, overrides |
The concrete cluster | Every infra def under it | Type Production unlocks stricter RBAC/approval policy |
| Infrastructure Definition | Deployment type, connector ref, namespace, release name | The image, the manifests | Pipelines targeting that specific target | releaseName must be stable per env or Harness loses track of the release history |
A service declares where its manifests come from (a Git connector + branch + path, or a Helm chart), a valuesPaths list, and an artifact source (ECR/GCR/ACR/Docker/Nexus + image path + tag). The tag is almost always <+input> so the same service ships build 1.4.7 today and 1.4.8 tomorrow without edits. Manifests must be canary-capable: the built-in canary clones your Deployment and stamps harness.io/track: canary, so your manifests and metric labels must not fight that. An environment is deliberately thin — a name, a type, optional overrides — and its type matters: Production lets you attach policy (e.g. OPA requiring an approval before any prod deploy) and is the natural RBAC boundary. An infrastructure definition is the concrete target — deploymentType, a connectorRef to the cluster’s Kubernetes connector, the namespace, and a releaseName that must be stable per env (Harness tracks release history by it), so use a deterministic value like release-<+INFRA_KEY_SHORT_ID>.
Connectors — the credentialed links
A connector is Harness’s typed, credentialed link to an external system, each with an execution context — it runs through a delegate (for anything inside your network) or, for some SaaS APIs, directly from the platform. The full set this pipeline uses:
| Connector type | Links to | Auth method (recommended) | Runs via | Used by |
|---|---|---|---|---|
| Kubernetes | The EKS cluster | In-cluster delegate ServiceAccount | Delegate | Infra def; deploy steps |
| AWS (ECR) | Amazon ECR registry | IRSA / IAM role assumed by delegate | Delegate | Service artifact source |
| Git (GitHub) | Manifest + pipeline repo | GitHub App / token from Vault | Delegate or platform | Service manifests; pipeline-as-code |
| Prometheus | In-cluster Prometheus | None (ClusterIP) or bearer token | Delegate (must be in-cluster) | CV health source |
| Datadog | Datadog API | API key + App key from Vault | Delegate or platform | CV health source |
| HashiCorp Vault (Secret Manager) | Vault | Kubernetes auth (delegate SA) | Delegate | Every secret reference |
| ServiceNow | ServiceNow instance | OAuth / basic from Vault | Delegate or platform | Approval + incident record |
Two connector rules save real pain. First, the Prometheus connector must run through the in-cluster delegate — its URL is a private ClusterIP (http://prometheus-operated.monitoring:9090) unreachable from the SaaS platform, so set “run on delegate” explicitly. Second, connector credentials come from the Secret Manager (Vault), never inline — the Datadog connector references <+secrets.getValue("datadogApiKey")>, resolved at runtime on the delegate. A key pasted into a connector lands in Git history forever.
Delegates — where everything actually runs
The delegate is the workhorse — a long-running process (a Kubernetes Deployment, typically two replicas for HA) that polls Harness for tasks, runs them inside your network, and reports back. It runs the kubectl apply, evaluates the canary, and — critically for CV — issues the Prometheus and Datadog queries. Its properties:
| Delegate property | What it controls | Recommended | Why |
|---|---|---|---|
| Kubernetes RBAC (ServiceAccount) | What the delegate can do to the cluster | Scoped to app namespaces (not cluster-admin) |
This is the real security boundary for the pipeline |
| Replicas | HA and task concurrency | 2 for prod | One can restart without stalling a deploy |
| Sizing | CPU/memory per replica | ~1 vCPU / 2 GiB each | Ample for this deploy+query throughput |
| Image pin | Delegate version | Explicit tag (e.g. 25.05.85503) |
Avoids surprise upgrades of an in-cluster control component |
| Auto-upgrade | Whether the delegate self-updates | On for lab, controlled for prod | Prod wants change control on the control plane |
| Tags/selectors | Which delegate a step uses | Tag prod vs non-prod delegates | Route production tasks to the hardened delegate |
| Egress | Reachability to metric backends | Allow Prometheus ClusterIP + api.datadoghq.com |
A blocked egress makes CV fail with a connection error, not a verdict |
The delegate’s ServiceAccount RBAC is the field most often over-provisioned. cluster-admin is fine for a throwaway lab, but production should scope a Role/RoleBinding to the app namespaces — get/list/create/patch/delete on Deployments, ReplicaSets, Services, ConfigMaps, Secrets, and Pods there, nothing cluster-wide it doesn’t need. Over-broad RBAC means a compromised delegate (or a buggy pipeline) can touch anything in the cluster.
Deployment strategies: canary vs blue-green vs rolling
Harness supports three Kubernetes deployment strategies, and CV attaches most naturally to canary. Which fits — and what CV comparison each implies — is a design decision you make before writing YAML.
| Dimension | Canary | Blue-Green | Rolling |
|---|---|---|---|
| How it works | N canary pods alongside stable; verify; then promote | Full new (green) env stood up beside old (blue); flip service selector | Replace pods in batches (maxSurge/maxUnavailable) |
| Traffic on new version during test | A slice (e.g. 25%) | 0% (green isolated until flip) or test traffic | Increasing as pods roll |
| Extra compute during rollout | Small (canary % of replicas) | ~2× (full green env) | ~1× + surge |
| Rollback speed | Fast (delete canary pods) | Instant (flip selector back) | Slow (roll pods back) |
| Best CV analysis type | Canary (canary vs stable, same load) | Threshold or smoke on green before flip | Threshold (new vs baseline) |
| Blast radius if bad slips | Limited to canary % | All-or-nothing at flip | Grows with each batch |
| When to pick | Latency/error-sensitive services where you want graded exposure | Stateless services needing instant rollback and zero mixed-version | Simple stateless apps; low-risk changes |
| Gotcha | Needs canary/stable label separation for CV | 2× resource cost during overlap | Mixed versions serve simultaneously mid-roll |
Canary is the subject of this guide: graded exposure (25% of traffic sees the new version) plus the cleanest CV comparison (canary vs stable, same real traffic) — choose it where a subtle regression is expensive and you want the machine to judge a small blast radius first. Blue-green stands up a parallel environment and flips the selector atomically — instant rollback, no mixed-version state, at ~2× pods during overlap; CV runs as a threshold/smoke check against green before the flip. Pick it where clean instant rollback beats resource cost. Rolling replaces pods in batches (the Kubernetes default) — simplest, but serves mixed versions mid-roll and rolls back slowly, and CV is limited to threshold analysis. Use it for low-risk changes where a canary’s ceremony isn’t warranted.
The Harness step primitives differ per strategy — the sequences that compose each:
| Strategy | Harness step sequence (typical) |
|---|---|
| Canary | K8sCanaryDeploy → Verify (CV) → K8sCanaryDelete → K8sRollingDeploy (promote to 100%) |
| Blue-Green | K8sBlueGreenDeploy (stand up green) → Verify/smoke → K8sBGSwapServices (flip) |
| Rolling | K8sRollingDeploy → optional Verify (threshold) |
| Rollback (all) | K8sRollingRollback (canary/rolling) or swap-back (blue-green) in rollbackSteps |
Continuous Verification in depth
CV is the reason this pipeline exists. Five moving parts: the Monitored Service, health sources, the analysis type, the sensitivity, and the verdict/failure-strategy coupling.
The Monitored Service and health sources
A Monitored Service binds a service + environment (e.g. checkout + prod) to the metrics that decide its health. Inside it you add health sources — one per provider — each contributing one or more CV metrics with a risk profile. The fields you set per metric:
| Field | What it means | Values | Why CV needs it |
|---|---|---|---|
| Query | The PromQL / Datadog query returning the series | provider-specific | The raw signal |
| Metric category / risk type | What kind of health this is | Errors, Performance (Response Time), Infrastructure (Saturation) | Groups the verdict and applies category logic |
| Risk direction | Which way is bad | Higher = higher risk, or Lower = higher risk | So a rising 5xx is bad but rising success isn’t |
| Analysis type | How this metric is compared | Canary vs Threshold vs Baseline | Decides the comparison for this metric |
| Deployment marker / group identifier | The label that separates canary from stable | e.g. harness.io/track |
Lets CV isolate canary series from stable series |
| Service instance identifier | The label naming the pod/instance | e.g. pod or host |
Lets CV analyse per-instance, catching one-bad-pod |
The deployment marker / service-instance identifier is the most-missed field and the cause of the number-one CV failure: if the query doesn’t carry a label separating canary from stable (and identifying the instance), CV can’t do a canary comparison — both versions blur into one series and a real regression hides. The label your Deployment stamps must flow all the way into the Prometheus/Datadog series, or CV has nothing to split on.
Analysis types and what each compares
The analysis type is the single most consequential CV choice — get it wrong and CV either can’t run or compares the wrong things.
| Analysis type | Compares | Requires | Best with strategy | Failure mode if misused |
|---|---|---|---|---|
| Canary | Canary-tagged series vs stable-tagged series, same deploy | A label separating canary from stable in the metrics | Canary | No canary label → both blur → false green |
| Threshold (Rolling) | New version vs fixed min/max you define | You to set correct absolute thresholds | Rolling, Blue-Green (pre-flip) | Wrong absolute thresholds → false red or false green |
| Baseline (previous / load-test) | Current run vs a pinned prior known-good run | A saved baseline run | Any (esp. pre-prod load tests) | Stale baseline → compares against outdated “normal” |
Canary analysis is the star: canary vs stable series from the same deployment, so both see identical traffic and time-of-day effects — the cleanest comparison, needing only the canary/stable label separation. Threshold analysis compares the new version against fixed min/max you set (“p99 under 500 ms, error rate under 1%”) — for rolling or blue-green pre-flip, but you own the burden of correct absolute numbers. Baseline analysis compares against a pinned prior good run — invaluable for pre-prod load tests, dangerous if the baseline goes stale.
Sensitivity, the risk score, and the window
Three tuning knobs govern whether the gate is decisive or flaky. Sensitivity (LOW/MEDIUM/HIGH) sets how large a deviation must be before CV flags a metric red — HIGH flags on a small deviation, LOW tolerates a larger one:
| Sensitivity | Flags a regression when the deviation is… | Catches | Risks | Start here when… |
|---|---|---|---|---|
| HIGH | Small | Subtle regressions (a few % latency creep) | False rollbacks on noisy metrics | Critical path, clean/low-noise metrics |
| MEDIUM | Moderate | Clear regressions | Balanced | Default — start here, tune from real deploys |
| LOW | Large | Only gross regressions | Real subtle regressions slip through | Very noisy service, or early rollout of CV |
The practical rule: start at MEDIUM, watch a dozen real deploys, then tighten to HIGH (missing subtle regressions) or loosen to LOW (good deploys rolled back). Sensitivity is per-analysis and can differ per metric category.
The risk score is CV’s per-metric and overall verdict — green (low) / amber (medium) / red (high) — computed from the deviation between the canary/new series and the baseline, weighted by category. The stage verdict fails when any metric (or the aggregate, per config) crosses into high risk at the chosen sensitivity.
The duration (analysis window) is how long CV observes before deciding, with a hard floor tied to your metric resolution:
| Window consideration | Rule | Why |
|---|---|---|
| Minimum useful window | ≥ 3–4× the Prometheus scrape interval | CV needs several data points to compare; too few → default-low-risk |
| Typical production window | 10–15 min | Enough to see load-dependent regressions without stalling deploys |
| Upper bound | As short as decisive | A 4-hour window is not more correct than 15 min, just slower and costlier |
| Data presence check | Every health-source query must return points during the window | An empty series → CV can’t judge → misleading pass |
The most dangerous misconfiguration is a window shorter than the scrape interval: with a 30-second scrape and a 60-second window you give CV two data points, and it may return low risk by default because it has nothing to compare. Set duration to at least 3–4× the scrape interval (15 min is a safe floor for a 15–30s scrape) and always confirm each query actually returns points during the window.
Reading the verdict in the Verify step’s UI — each colour and the move it implies:
| Per-metric risk | Colour | Meaning | Typical cause | Your move |
|---|---|---|---|---|
| Low | Green | Canary within normal deviation of baseline | Healthy release | Auto-promote proceeds |
| Medium | Amber | Deviation noticeable but under the fail threshold | Borderline / noisy metric | Watch; check if the metric is just noisy |
| High | Red | Deviation exceeds the sensitivity threshold | Real regression (or over-sensitive on noise) | Stage fails → StageRollback fires |
| No data | Grey | Query returned no points in the window | Wrong query, empty series, window too short | Fix the query/window before trusting any verdict |
The verdict → failure-strategy coupling
CV’s verdict is inert until you wire what happens on failure. The stage failure strategy maps the Verification error to an action:
| Failure strategy action | On a red CV verdict, Harness… | Use when |
|---|---|---|
StageRollback |
Rolls the whole stage back (deletes canary, restores stable) | The default for auto-rollback — this is the 2 a.m. eliminator |
StepGroupRollback |
Rolls back just the step group | Multi-step-group stages needing partial rollback |
ManualIntervention |
Pauses for a human to decide (then retry/rollback/ignore) | When you want a human in the loop initially while you trust CV |
Abort |
Fails the pipeline, no rollback | Rare — leaves the canary up; only if something else cleans up |
Ignore |
Treats the failure as success | Never for CV — defeats the entire purpose |
The mapping onFailure → errors: [Verification] → action: StageRollback makes the system autonomous. ManualIntervention is a reasonable first posture while building trust — it pauses on a red verdict and pages a human — and you graduate to StageRollback once a dozen real deploys prove the gate’s judgment.
Pipeline-as-code: expressing it all in YAML
The reason to use YAML over the UI: a pipeline becomes a pull request — reviewed, versioned, diffable, revertible — instead of form state that lives only in Harness. Harness stores every entity as YAML, and its Git Experience can make Git the source of truth so a merge to main is the deployment definition. The anatomy of a deployment stage in YAML:
| YAML block | Purpose | Key fields |
|---|---|---|
pipeline.stages[].stage |
One stage | name, identifier, type: Deployment |
stage.spec.service |
Which service | serviceRef |
stage.spec.environment |
Which env + infra | environmentRef, infrastructureDefinitions |
stage.spec.execution.steps |
The ordered steps | Canary deploy → Verify → delete → promote |
step.spec (per step) |
Step config | e.g. instanceSelection, sensitivity, duration |
stage.spec.execution.rollbackSteps |
What to run on rollback | K8sRollingRollback |
step.failureStrategies |
Per-step failure handling | Verification → StageRollback |
Two identifiers matter throughout: identifier (the stable machine name other objects reference — never change it) and name (the human label, free to edit). <+input> is a runtime input resolved at run time (the image tag is the classic one); <+...> expressions (e.g. <+secrets.getValue("datadogApiKey")>) resolve during execution. Keeping the image tag as <+input> lets one pipeline deploy any build.
Architecture at a glance
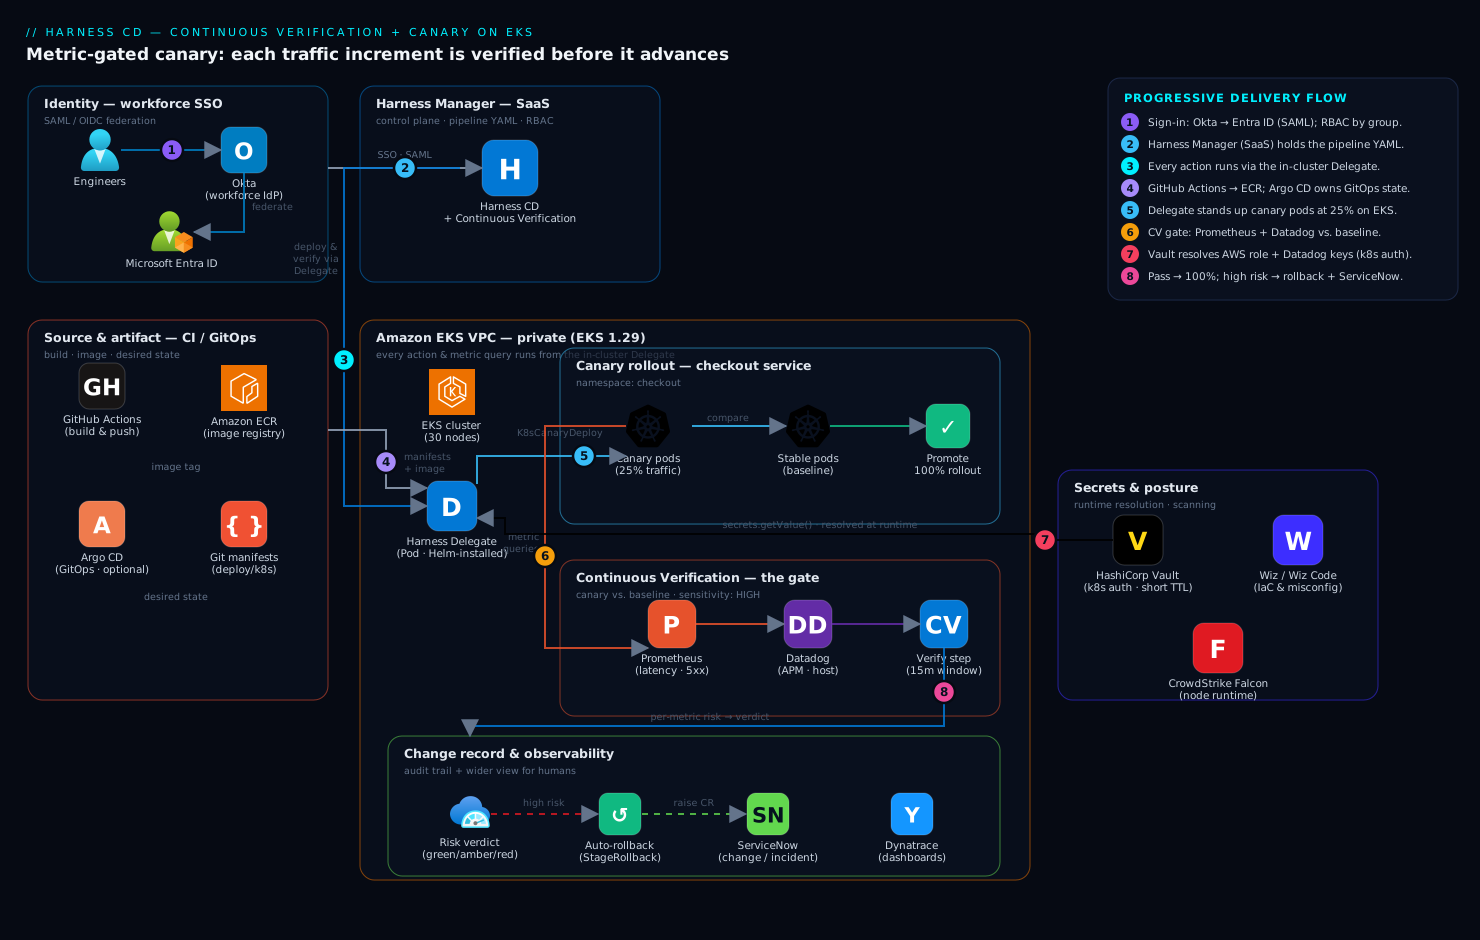
The diagram traces the pipeline as it runs, tool by tool. Read it left to right: an engineer signs in through Okta, federated to Microsoft Entra ID over SAML/OIDC, so Harness RBAC keys off the same groups as the rest of the estate — only platform-sre can approve a production promotion. The Harness Manager (SaaS control plane) holds the pipeline but never touches the cluster directly; every action runs through a Harness Delegate Pod inside the EKS VPC, which is what lets the metric queries hit Prometheus and Datadog over private networking.
Follow a release through it. GitHub Actions builds the image, pushes it to ECR, and bumps the tag in the Git manifest. The pipeline pulls its manifests from Git and resolves every secret — the AWS role, the Datadog keys — from HashiCorp Vault via the Vault Secret Manager, so nothing sensitive lives in the YAML. A ServiceNow change-approval stage opens a change request and blocks until approved (the audit artefact compliance wants). Then the delegate stands up canary pods (25% of replicas) alongside stable, and the Continuous Verification step queries Prometheus (in-cluster latency and error rate) and Datadog (APM traces and host metrics), isolating canary-tagged series from stable and running the analysis. A green verdict promotes to 100%; a high-risk verdict triggers automatic rollback and flips the ServiceNow record to an incident. Dynatrace (or Datadog dashboards) gives the wider view, and if you run GitOps, Argo CD owns the always-on infra apps while Harness orchestrates how the risky change rolls out and verifies. The image is built upstream; everything below it in the diagram is the delivery-and-verification layer on top.
Real-world scenario
Nimbus Pay runs a checkout API on a 30-node EKS 1.29 cluster in ap-south-1, deploying ~40 times a week. The stable Deployment runs 24 replicas of a .NET 8 service that fans out per checkout to a payment provider, a fraud-scoring service, and a Postgres inventory DB. Observability is kube-prometheus-stack plus Datadog APM; secrets live in Vault; SSO is Okta federated to Entra ID; changes flow through ServiceNow. Before this project, deploys were rolling updates gated only by readiness probes, and the last quarter had three Sev-2s of the same shape: green deploy, then a latency/error creep noticed 10–20 minutes later at full traffic.
The incident that triggered the project: a Friday deploy of build 2.11.4 introduced a subtle N+1 query — one extra Postgres round-trip per checkout on a code path that only fired for cart sizes above eight items. Readiness probes passed. At the 3pm volume ramp, p99 checkout latency climbed from 240 ms to 1.9 s and the payment-provider timeout rate hit 4% — but only for large carts, so the aggregate error rate looked “only” mildly elevated and no static alert fired hard enough. Twenty-two minutes in, a customer-success escalation (not the monitoring) surfaced it; because it was a rolling update, 2.11.4 was already on all 24 replicas, and kubectl rollout undo took another six minutes to propagate. Total customer-facing degradation: ~28 minutes, in a revenue window.
The team built exactly the pipeline in this guide. The checkout service was defined once (manifests from Git, image from ECR, tag as <+input>), a prod environment and an eks-prod infrastructure definition pinned the target, and a namespace-scoped delegate ran everything from inside the VPC. The canary stage stood up 25% canary pods (6 of 24) and a Verify step ran a Canary analysis for 15 minutes at MEDIUM sensitivity over four CV metrics: Prometheus 5xx rate and p99 latency (split on harness.io/track), and Datadog APM error rate and p95 duration. The failure strategy mapped Verification → StageRollback, and a ServiceNow change-approval stage sat ahead of the canary.
The payoff came six weeks later on build 2.14.1, which reintroduced a similar large-cart regression. This time the 6 canary pods took 25% of traffic, the p99-latency CV metric on the canary series diverged from the stable series within the window, CV scored it high-risk at minute 11, the Verify step failed, StageRollback fired, canary pods were deleted, stable was untouched, and the ServiceNow record flipped to an incident with the CV report attached. No human was paged, no customer noticed — the bad version peaked at 25% of traffic for eleven minutes on a subset of large-cart requests, then vanished. The engineer who wrote 2.14.1 saw a failed pipeline with a red p99 metric and a link to the exact query, fixed the N+1, and reshipped. Before/after:
| Aspect | Before (rolling, probes only) | After (canary + CV) |
|---|---|---|
| Bad version’s peak traffic share | 100% (all 24 replicas) | 25% (6 canary pods), for 11 min |
| Time to detect | ~22 min (via customer escalation) | 11 min (CV, in-window, automatic) |
| Time to roll back | +6 min (manual rollout undo) |
Seconds (StageRollback, canary delete) |
| Who was involved | On-call paged, incident bridge | No page; author saw a failed pipeline |
| Audit trail | Ad-hoc | ServiceNow incident + CV report attached |
| Customer impact | ~28 min degradation, revenue window | None observed |
The lesson the team wrote on the wall: “A readiness probe says the pod is up. Continuous Verification says the release is good. Ship on the second one.”
Advantages and disadvantages
Harness CD with CV is powerful, but it’s a control plane you adopt and operate — weigh it honestly.
| Advantages | Disadvantages |
|---|---|
| CV auto-rolls-back on real-metric regression — removes the human from the 2 a.m. decision | CV is only as good as the metrics/queries you register — garbage queries → garbage verdicts |
| First-class pipeline step with learned baselines — less to build than a hand-rolled Argo Rollouts + analysis stack | Managed platform lock-in; Self-Managed edition is heavy to operate |
| One control plane owns RBAC, secrets, approvals, and verification together | Another system to secure, upgrade, and govern (delegate is in-cluster) |
| Delegate runs queries from inside your network — reaches private Prometheus and Datadog egress cleanly | Delegate RBAC and egress are new attack surface + failure modes to manage |
| Pipeline-as-code makes a deploy a reviewable PR, versioned and revertible | YAML is verbose; the object graph has a learning curve |
| Canary gives graded exposure — a bad version peaks at 25%, not 100% | Canary needs canary/stable label separation in metrics; easy to get wrong |
| Native ServiceNow/Okta/Entra/Vault integrations — fits an enterprise estate | Sensitivity mis-tuning causes false rollbacks (HIGH) or missed regressions (LOW) |
| Commercial cost (per-service licensing) can exceed open-source alternatives | Requires a mature observability stack already in place to be worth it |
CV is the right choice when you deploy frequently to Kubernetes, a bad release costs real money per minute, you already run a solid Prometheus/Datadog stack, and you value an integrated control plane (RBAC + secrets + approvals + verification) over assembling open-source pieces. It is overkill for a low-traffic internal app deploying weekly, and premature if your metrics aren’t trustworthy yet — CV will just automate bad decisions. The open-source alternative, Argo Rollouts with an AnalysisTemplate (Set Up Argo Rollouts with Datadog Metric Analysis for Automated Canary Promotion), gives the same pattern without the commercial platform, at the cost of building and operating the glue yourself.
Hands-on lab
Build the pipeline end to end: install the delegate, wire secrets and identity, define service/environment/infra, register Prometheus and Datadog health sources, assemble the canary-with-CV pipeline as YAML, run the happy path, then break it on purpose to prove auto-rollback fires. Target is EKS 1.29; adapt namespaces/regions. Run from a workstation with kubectl, helm v3, and the Harness CLI.
Step 1 — Install and register the Delegate
Install one delegate per cluster with Helm and confirm it registers before building on top.
# Add the Harness Helm repo
helm repo add harness-delegate https://app.harness.io/storage/harness-download/delegate-helm-chart/
helm repo update

# Install the Delegate into a dedicated namespace.
# DELEGATE_TOKEN and the account/manager URLs come from
# Harness > Account Settings > Delegates > New Delegate (Helm).
helm upgrade --install harness-delegate harness-delegate/harness-delegate-ng \
  --namespace harness-delegate-ng --create-namespace \
  --set delegateName=eks-prod-delegate \
  --set accountId="$HARNESS_ACCOUNT_ID" \
  --set delegateToken="$DELEGATE_TOKEN" \
  --set managerEndpoint="https://app.harness.io" \
  --set delegateDockerImage="harness/delegate:25.05.85503" \
  --set replicas=2 --set upgrader.enabled=true
Verify it is healthy and connected:
kubectl -n harness-delegate-ng rollout status deploy/eks-prod-delegate
kubectl -n harness-delegate-ng get pods -l harness.io/name=eks-prod-delegate
# In the UI: Account Settings > Delegates — the row shows "Connected" (green).
Expected: two Pods Running and a green Connected row within a minute or two. Give the delegate’s ServiceAccount enough RBAC to apply manifests and patch Deployments in the target namespace — cluster-admin works for this lab; scope it to the app namespaces for production (see Security notes).
Step 2 — Wire Vault for secrets and Okta/Entra for SSO
Get identity and secrets out of the pipeline body first.
Secrets (HashiCorp Vault). In Account Settings > Connectors > Secret Managers, add a HashiCorp Vault connector. Authenticate the delegate to Vault with the Kubernetes auth method so no static token is stored:
# On the Vault side: enable k8s auth and bind the Delegate's ServiceAccount
vault auth enable kubernetes
vault write auth/kubernetes/role/harness-delegate \
  bound_service_account_names=eks-prod-delegate \
  bound_service_account_namespaces=harness-delegate-ng \
  policies=harness-cd-read ttl=20m

# Policy: read-only on the paths the pipeline needs
vault policy write harness-cd-read - <<'EOF'
path "secret/data/cd/datadog/*" { capabilities = ["read"] }
path "secret/data/cd/aws/*"     { capabilities = ["read"] }
EOF
Now the AWS role ARN, the Datadog DD_API_KEY, and DD_APP_KEY are referenced in pipeline/connector YAML as <+secrets.getValue("datadogApiKey")> and resolved by the delegate at runtime from Vault. Never inline a credential.
SSO (Okta → Entra ID → Harness). In Account Settings > Authentication, add a SAML provider pointed at Microsoft Entra ID. Because the workforce IdP is Okta, federate Okta into Entra (Entra treats Okta as an external identity source) so the SAML assertion Harness receives carries the user’s Entra group claims. Map those groups to Harness User Groups and bind roles — only platform-sre gets the role that can approve a production promotion — and turn on Enforce SAML login so local passwords can’t bypass SSO. (If you also front Kubernetes access with Okta, see Deploy Okta as a SAML/OIDC Identity Provider for Kubernetes kubectl OIDC Login.)
Step 3 — Create the Project, Service, and Environment
Use the Harness CLI so setup is reproducible. Authenticate:
harness login --api-key "$HARNESS_API_KEY" --account-id "$HARNESS_ACCOUNT_ID"
Service — the what to deploy. Save as service.yaml:
service:
  name: checkout
  identifier: checkout
  serviceDefinition:
    type: Kubernetes
    spec:
      manifests:
        - manifest:
            identifier: checkout_manifests
            type: K8sManifest
            spec:
              store:
                type: Github
                spec:
                  connectorRef: github_checkout   # GitHub Actions builds; this reads manifests
                  gitFetchType: Branch
                  branch: main
                  paths: [deploy/k8s]
              valuesPaths: [deploy/k8s/values.yaml]
      artifacts:
        primary:
          primaryArtifactRef: ecr_checkout
          sources:
            - identifier: ecr_checkout
              type: Ecr
              spec:
                connectorRef: aws_ecr            # role resolved from Vault
                region: ap-south-1
                imagePath: 480123456789.dkr.ecr.ap-south-1.amazonaws.com/checkout
                tag: <+input>                    # supply the build to ship at run time
Environment + Infrastructure — the where. Save as environment.yaml:
environment:
  name: prod
  identifier: prod
  type: Production
infrastructureDefinition:
  name: eks-prod
  identifier: eks_prod
  environmentRef: prod
  deploymentType: Kubernetes
  type: KubernetesDirect
  spec:
    connectorRef: eks_prod_k8s     # uses eks-prod-delegate
    namespace: checkout
    releaseName: release-<+INFRA_KEY_SHORT_ID>   # stable per env — Harness tracks release history
Apply both:
harness service     apply --file service.yaml
harness environment apply --file environment.yaml
Step 4 — Register the health sources: Prometheus and Datadog
CV needs to know which metrics decide health. In Project Setup > Monitored Services, create one bound to checkout + prod, then add two health sources.
Prometheus health source — error rate and latency from in-cluster Prometheus. Add a Prometheus connector first, pointed at the kube-prometheus-stack URL and set to run on the delegate (the URL is a private ClusterIP). Sanity-check the queries from the delegate’s vantage point:
# 5xx rate for the checkout service (run from a Pod in the delegate namespace):
curl -s "http://prometheus-operated.monitoring:9090/api/v1/query" \
  --data-urlencode 'query=sum(rate(http_requests_total{app="checkout",status=~"5.."}[5m])) by (harness_io_track)'

# p99 latency, split by canary/stable track:
curl -s "http://prometheus-operated.monitoring:9090/api/v1/query" \
  --data-urlencode 'query=histogram_quantile(0.99, sum(rate(http_request_duration_seconds_bucket{app="checkout"}[5m])) by (le, harness_io_track))'
The by (... harness_io_track) grouping is what lets CV separate canary from stable. In the health source, set the 5xx query’s risk profile to Errors and the latency query’s to Performance / Response Time, tag the deployment-marker label (harness.io/track), and choose Continuous Verification as the analysis type (not just SLO) so these metrics gate the pipeline.
Datadog health source — APM and host metrics. The Datadog connector reads DD_API_KEY/DD_APP_KEY from Vault. Register these as CV metrics:
# Example Datadog metric queries to register as CV metrics:
#   Latency (APM):     avg:trace.http.request.duration{service:checkout,env:prod} by {harness_io_track}
#   Error rate (APM):  sum:trace.http.request.errors{service:checkout,env:prod}.as_rate() by {harness_io_track}
#   Saturation (host): avg:kubernetes.cpu.usage.total{kube_deployment:checkout} by {pod}
Set each direction to Higher = higher risk and pick the Canary analysis method so Harness compares canary-tagged series against the stable baseline rather than a fixed threshold. The four CV metrics you now have:
| Metric | Source | Category | Direction | Analysis |
|---|---|---|---|---|
| 5xx rate | Prometheus | Errors | Higher = worse | Canary |
| p99 latency | Prometheus | Performance | Higher = worse | Canary |
| APM error rate | Datadog | Errors | Higher = worse | Canary |
| APM p95 duration | Datadog | Performance | Higher = worse | Canary |
Step 5 — Build the Canary pipeline with a CV step
Now the core. A canary stage runs Canary Deployment (stand up canary pods), Verify (the CV gate), then Canary Delete + Rolling promotion. Save as pipeline.yaml:
pipeline:
  name: checkout-canary-cv
  identifier: checkout_canary_cv
  projectIdentifier: payments
  orgIdentifier: default
  stages:
    - stage:
        name: Canary to prod
        identifier: canary_prod
        type: Deployment
        spec:
          deploymentType: Kubernetes
          service: { serviceRef: checkout }
          environment:
            environmentRef: prod
            infrastructureDefinitions: [{ identifier: eks_prod }]
          execution:
            steps:
              # 5.1 — stand up canary pods (25% of replica count)
              - step:
                  name: Canary Deployment
                  identifier: canaryDeployment
                  type: K8sCanaryDeploy
                  timeout: 10m
                  spec:
                    instanceSelection:
                      type: Percentage
                      spec: { percentage: 25 }
                    skipDryRun: false
              # 5.2 — THE GATE: Continuous Verification
              - step:
                  name: Continuous Verification
                  identifier: cv
                  type: Verify
                  timeout: 30m
                  spec:
                    type: Canary
                    monitoredService:
                      type: Default     # the checkout/prod Monitored Service from step 4
                    spec:
                      sensitivity: MEDIUM         # start MEDIUM; tighten to HIGH after a dozen deploys
                      duration: 15m               # analysis window (≥ 3–4× scrape interval)
                      deploymentTag: <+serviceConfig.artifacts.primary.tag>
                  failureStrategies:
                    - onFailure:
                        errors: [Verification]
                        action: { type: StageRollback }   # auto-rollback on bad metrics
              # 5.3 — promote to 100% only if CV passed
              - step:
                  name: Canary Delete
                  identifier: canaryDelete
                  type: K8sCanaryDelete
                  timeout: 10m
                  spec: {}
              - step:
                  name: Rolling Deployment
                  identifier: rolling
                  type: K8sRollingDeploy
                  timeout: 15m
                  spec: { skipDryRun: false }
          rollbackSteps:
            - step:
                name: Rolling Rollback
                identifier: rollingRollback
                type: K8sRollingRollback
                timeout: 15m
                spec: {}
The decisive lines are the Verify step and its failure strategy: type: Canary compares canary-tagged series against the stable baseline, sensitivity: MEDIUM sets the threshold, and onFailure → StageRollback removes the human from the 2 a.m. equation. Apply and trigger:
harness pipeline apply --file pipeline.yaml
harness pipeline execute --pipeline-id checkout_canary_cv \
  --inputs-yaml-file run-inputs.yaml     # supplies the image tag to deploy
Step 6 — Add the ServiceNow approval gate
Production changes need a paper trail and often a human checkpoint before the canary starts. Insert an Approval stage ahead of the canary that opens a ServiceNow change request and blocks until approved — on a CV-triggered rollback Harness updates the same record to an incident:
    - stage:
        name: Change Approval
        identifier: change_approval
        type: Approval
        spec:
          execution:
            steps:
              - step:
                  name: ServiceNow Change
                  identifier: snowChange
                  type: ServiceNowApproval
                  timeout: 1d
                  spec:
                    connectorRef: servicenow_prod
                    ticketType: change_request
                    approvalCriteria:
                      type: KeyValues
                      spec:
                        conditions:
                          - { key: state, operator: equals, value: Implement }
Put this stage first in stages (ahead of Canary to prod). For the ServiceNow-side automation that creates and transitions these records from CI/CD, see Automate ServiceNow Change Requests from a CI/CD Pipeline via the Change API.
Step 7 — Validate the happy path
Deploy a known-good tag and watch the canary come up and promote:
# Watch the canary pods appear (25% of replicas), tagged canary:
kubectl -n checkout get pods -l harness.io/track=canary -w
# Expect ~25% canary pods, then CV runs for 15m, then promotion to stable.
In the UI, the Continuous Verification step shows per-metric risk (green/amber/red) for every query, with the canary series overlaid on the stable baseline. Independently confirm what CV saw by re-running the same queries from step 4 for the canary window — they should line up with the reported risk. If they don’t, your deploymentTag / canary label filter is wrong and CV is analysing the wrong series.
Step 8 — Negative test: prove auto-rollback fires
The important one — the gate is worthless until you’ve seen it fail correctly. Deploy an image that injects latency or 5xx (a fault-injection build) and assert auto-rollback:
harness pipeline execute --pipeline-id checkout_canary_cv \
  --inputs-yaml-file run-inputs-faulty.yaml   # a tag that injects 5xx / latency

# Assert the rollback fired and stable was restored:
kubectl -n checkout get events --sort-by=.lastTimestamp | grep -i rollback
kubectl -n checkout rollout history deploy/checkout
kubectl -n checkout get pods -l harness.io/track=canary   # expect: no resources
The Verify step should score high-risk within the window, StageRollback should fire, canary pods should be deleted, and stable restored with zero canary pods remaining. The lab steps mapped to what each proves:
| Step | What you did | What it proves |
|---|---|---|
| 1 | Install + register delegate | The in-cluster worker that runs deploys and queries exists |
| 2 | Vault k8s auth + Okta/Entra SSO | Secrets and identity live outside the pipeline body |
| 3 | Service / env / infra def | The reusable object graph the pipeline references |
| 4 | Prometheus + Datadog health sources | CV knows which metrics decide health, split by track |
| 5 | Canary pipeline with Verify + failure strategy | The gate and the auto-rollback wiring |
| 6 | ServiceNow approval stage | The audit trail and human checkpoint |
| 7 | Happy-path run | The gate promotes a good build on evidence |
| 8 | Fault-injection run | The gate rolls back a bad build autonomously |
Step 9 — Teardown
# Remove the workload and its canary remnants
kubectl delete namespace checkout

# Remove the Delegate
helm uninstall harness-delegate -n harness-delegate-ng
kubectl delete namespace harness-delegate-ng

# In Vault: revoke the role.
vault delete auth/kubernetes/role/harness-delegate

# In Harness UI: delete the Pipeline, Monitored Service, Environment, Service,
# and the Prometheus/Datadog/Vault/ServiceNow connectors.
Common mistakes & troubleshooting
The failures below are the ones that bite in production. First the scannable table, then the reasoning for the entries that cost the most time.
| # | Symptom | Root cause | Confirm (exact cmd / path) | Fix |
|---|---|---|---|---|
| 1 | CV passes instantly, verdict green, no data plotted | Analysis window shorter than the scrape/aggregation interval → too few points → default-low | Verify step UI shows sparse/empty series; check Prometheus scrape interval | Set duration ≥ 3–4× scrape interval (15m floor); confirm queries return points |
| 2 | Real regression not caught; canary looks identical to stable | Canary and stable series not separated by label | Run the health query manually — no harness_io_track (or your label) in the series |
Stamp harness.io/track on pods; add by (...track) to the query; set the deployment marker in the health source |
| 3 | Verify step fails with a connection error, not a verdict | Delegate can’t reach Prometheus ClusterIP or api.datadoghq.com (NetworkPolicy / egress) |
curl the query from a Pod in the delegate namespace — connection refused/timeout |
Allow egress to the Prometheus URL and Datadog; run the Prometheus connector on the delegate |
| 4 | Good deploys get rolled back (false rollbacks) | Sensitivity too HIGH on a noisy service | Verify report shows amber/red on a metric that’s just noisy | Drop to MEDIUM/LOW; register fewer, cleaner metrics; widen the window |
| 5 | Bad deploys slip through green | Sensitivity too LOW, or wrong metrics/thresholds | Real regression visible in Grafana but CV scored green | Raise sensitivity to HIGH; fix the query; add the missing metric |
| 6 | Delegate shows “Not Connected” in UI | Wrong token/account URL, or delegate can’t reach app.harness.io |
kubectl -n harness-delegate-ng logs deploy/eks-prod-delegate |
Fix token/managerEndpoint; allow outbound 443 to Harness |
| 7 | Deploy fails: “forbidden” on kubectl apply |
Delegate ServiceAccount RBAC too narrow for the namespace | Delegate logs show a forbidden on Deployments/Secrets |
Grant the SA get/list/create/patch/delete on the workload kinds in the namespace |
| 8 | Secret resolves empty; step fails with a null credential | Vault k8s auth role/namespace mismatch, or wrong secret path | Delegate logs show Vault 403/permission denied | Fix bound_service_account_names/namespaces and the policy path |
| 9 | Canary promotes but stable never scales down / duplicates | releaseName not stable per env → Harness lost the release history |
Two ReplicaSets lingering; release ConfigMap churned | Set a stable releaseName (e.g. release-<+INFRA_KEY_SHORT_ID>) |
| 10 | Image tag prompt at run time is empty / deploy uses wrong build | tag: <+input> not supplied, or CI didn’t push the tag |
run-inputs.yaml missing the tag; ECR lacks the image |
Supply the tag in run inputs; confirm the CI push to ECR succeeded |
| 11 | Approval stage never unblocks | ServiceNow criteria never matches (wrong state value / field) |
ServiceNow ticket state ≠ Implement; check the field API name |
Correct the approvalCriteria key/value to the real ServiceNow state |
| 12 | CV analyses the wrong pods after a scale event | Service-instance identifier not set / autoscaler changed pod set mid-window | New pods appear mid-window; per-instance analysis skewed | Set the service-instance identifier; keep the window shorter than typical scale churn |
1. CV passes instantly with no data (the most dangerous failure — a false pass). CV reports low risk and promotes a bad build because the analysis window is shorter than your metric scrape/aggregation interval: with a 30-second scrape and a 60-second window, CV has two data points and defaults toward low risk. The Verify step’s charts show sparse or empty series. Fix: set duration to at least 3–4× the scrape interval (15 min floor), and always confirm each query returns points during the window before trusting a green.
2. Canary and stable series not separated. CV’s canary comparison isolates canary-tagged from stable-tagged series; if the harness.io/track (or your own) label doesn’t flow into the metric series, both versions blur into one and a real regression averages out to invisible. Run the health-source query by hand — no harness_io_track dimension means CV can’t split it. Fix: put the label on the pods, group the query by it (by (..., harness_io_track)), and name it in the health source’s deployment-marker / service-instance identifier.
3. Delegate can’t reach the metric backend. The queries run from the delegate; a NetworkPolicy or egress rule blocking the in-cluster Prometheus ClusterIP or api.datadoghq.com makes CV fail with a connection error, not a health verdict — which looks like an unhealthy deploy when it’s really a broken query path. curl the exact query from a Pod in the delegate namespace; a refused/timed-out connection is the smoking gun. Fix: allow the egress and run the Prometheus connector on the delegate (the ClusterIP is unreachable from the SaaS platform).
4 & 5. Sensitivity mis-tuned. HIGH on a noisy service fails good deploys (false rollbacks that erode trust in the gate); LOW on a critical path lets real regressions through. Correlate the CV verdict with Grafana for the same window — red on a noisy metric means too sensitive; green on a visible regression means not sensitive enough. Fix: start at MEDIUM, tune from a dozen real deploys, and prefer reducing/cleaning the metric set over cranking sensitivity.
Best practices
- Start sensitivity at MEDIUM and tune from real deploys. HIGH on day one causes false rollbacks that erode trust before the gate has earned any; watch a dozen canaries, then tighten or loosen with evidence.
- Register only the handful of metrics that genuinely decide health. Every extra CV metric adds noise, a false-rollback chance, and (for Datadog) a custom-metric bill. Error rate, latency, and one saturation metric usually suffice.
- Set the analysis window to at least 3–4× the scrape interval. Too short for your metric resolution produces a false pass — CV’s most dangerous verdict. 15 minutes is a safe floor for a 15–30s scrape.
- Make the canary/stable label flow all the way into the metrics. The
harness.io/tracklabel on pods is useless unless the query groups by it — verify the series carries the dimension before trusting a canary comparison. - Wire
onFailure → Verification → StageRollbackand mean it. UseManualInterventiononly as a temporary trust-building posture, then graduate to auto-rollback. - Keep the delegate RBAC least-privilege (app namespaces, not
cluster-admin) and resolve every credential from Vault at runtime — never an inline key, because it lands in Git history. - Pin the delegate image to an explicit version so an in-cluster control component doesn’t drift silently.
- Express pipelines as YAML in Git so a deployment change is a reviewed, revertible pull request, not clicks in a form.
- Match the strategy to the risk — canary for risky changes, blue-green for instant-rollback needs, rolling for low-risk — not habit.
- Reconcile CV’s verdict against Grafana for the first weeks by re-running the same queries for the canary window — this catches a mis-labelled series or wrong query early.
- Run at least two delegate replicas in production so one can restart without stalling an in-flight deploy or CV analysis.
Security notes
- Delegate RBAC is the security boundary. Scope the delegate’s ServiceAccount to the app namespaces it deploys to — get/list/create/patch/delete on the workload kinds it needs, nothing cluster-wide it doesn’t — and run it on a dedicated node pool.
cluster-adminis a lab convenience, not a production posture. - All credentials resolve from Vault at runtime via the Kubernetes auth method with short TTLs (e.g. 20 min), so nothing static sits in Harness or Git. Scope the Vault policy read-only to the exact paths the pipeline needs.
- Human access is gated by Okta → Entra ID SSO with group-mapped roles. Bind the approve-production capability to
platform-srespecifically, not a broad “developer” role, and enforce SAML login so local passwords can’t bypass SSO. - Pin the delegate image and control its upgrades — it’s a privileged in-cluster component, and a floating tag is drift you don’t control.
- Pair with posture and runtime controls. Scan the repo’s manifests/IaC (Integrate Wiz Code into GitHub Actions for IaC and Container Scanning Gates) so a misconfigured Deployment or over-broad RBAC is caught before it ships, and run a runtime sensor on the nodes (Deploy CrowdStrike Falcon Sensor to Linux Fleets and Kubernetes via Helm DaemonSet) for threats on canary and stable alike.
- Protect the CV query path — lock the Prometheus connector to the delegate and the Datadog egress to
api.datadoghq.com, and don’t expose in-cluster Prometheus beyond what the delegate needs. - Treat the ServiceNow integration as an audit control, not decoration — the auto-created change/incident record is the evidence a production change was approved and, on failure, rolled back; keep the CV report attached so the “why” is preserved.
The security controls that also improve resilience — they pull in the same direction here:
| Control | Mechanism | Secures against | Also prevents |
|---|---|---|---|
| Namespace-scoped delegate RBAC | Role/RoleBinding on the delegate SA | A compromised/buggy pipeline touching the whole cluster | Accidental cross-namespace deploys |
| Vault k8s auth, short TTL | auth/kubernetes role + read-only policy |
Static secrets in Git/Harness | Stale/leaked long-lived credentials |
| Okta→Entra SSO + group-mapped roles | SAML provider + enforced login | Unauthorised production promotions | Ex-employees retaining approval rights |
| Pinned delegate image | Explicit tag in Helm values | Unvetted control-plane upgrades | Surprise behaviour changes mid-incident |
| IaC/manifest scanning gate | Policy scan in CI | Shipping a misconfigured Deployment/RBAC | Config drift reaching prod |
Cost & sizing
The expensive failure mode is the one this pipeline prevents — a bad release reaching 100% of traffic and causing an outage — so CV pays for itself on the first auto-rollback. The cost levers: delegate compute is marginal (two replicas at ~1 vCPU / 2 GiB each on existing capacity, idle between deploys); canary pods are short-lived (~25% of replicas, deleted after promote/rollback); observability is the real driver — Datadog bills on custom metrics and APM host count, so register only the CV metrics that decide health and lean on in-cluster Prometheus (already-paid compute) for the high-cardinality latency/error queries; keep CV windows tight (a 4-hour window is no more correct than 15 min, just costlier in lead time and query spend); and Harness licensing is typically per-service, so cost scales with how many services you onboard.
A rough monthly picture for a mid-size platform:
| Cost driver | What you pay for | Rough magnitude | What it buys / watch-out |
|---|---|---|---|
| Harness CD license | Per active service | Commercial (contact/tiered) | The control plane; scales with # services onboarded |
| Delegate compute | 2× (~1 vCPU / 2 GiB) Pods | Negligible on existing nodes | Runs deploys + CV queries; idles between |
| Canary pods (transient) | ~25% extra replicas during window | Marginal, short-lived | Graded exposure; deleted after promote/rollback |
| Prometheus | Compute you already run | ~“free” (existing stack) | High-cardinality latency/error CV metrics |
| Datadog custom metrics + APM | Per custom metric + host | Can dominate if over-registered | Register only CV-deciding metrics; reserve for APM |
| NAT/egress for Datadog | Egress to api.datadoghq.com |
Small | The CV query path to SaaS Datadog |
The discipline that keeps the bill sane: fix the deploy-quality problem with a few trustworthy metrics rather than instrumenting everything — let Prometheus (already paid) carry the heavy queries and Datadog carry only what it’s uniquely good at.
Interview & exam questions
1. What is the difference between a canary and Continuous Verification, and why is a canary without CV described as “a slower way to ship a bad build to everyone”? A canary shifts a slice of traffic to the new version — the experiment. CV is the judgment layer: it queries your metrics during the canary window, compares the canary against the stable baseline, scores the risk, and promotes or rolls back. Without CV, the canary still promotes on a timer or a click regardless of whether the metrics are healthy, so a bad build eventually reaches everyone — just more slowly.
2. Explain the Harness object model for a deployment stage. A pipeline is an ordered set of stages; a deployment stage references a service (the what — manifests + artifact), an environment (the where — e.g. prod), and an infrastructure definition (the concrete target — cluster + namespace via a connector). Every action runs on a delegate inside your network. The split enables reuse (define the service once, deploy to many environments) and makes the delegate’s RBAC the real security boundary.
3. Why must the Delegate — not the SaaS control plane — run the CV metric queries? The Prometheus URL is a private in-cluster ClusterIP and Datadog is reached over your egress; the SaaS control plane has no network path to either. The delegate runs inside your cluster, so it can reach both. That’s also why the delegate’s egress and the Prometheus connector’s “run on delegate” setting matter — block them and CV fails with a connection error, not a verdict.
4. What are the three CV analysis types and when do you use each? Canary compares canary-tagged against stable-tagged series from the same deploy (best for a canary strategy; needs a label separating the two). Threshold/Rolling compares the new version against fixed min/max you set (for rolling or blue-green-pre-flip, where there’s no clean split). Baseline compares against a pinned prior good run (great for pre-prod load tests, dangerous if it goes stale).
5. How does sensitivity affect CV, and where should you start? Sensitivity (LOW/MEDIUM/HIGH) sets how large a deviation must be before CV flags a regression. HIGH catches subtle regressions but risks false rollbacks on noisy metrics; LOW tolerates more but can let real regressions through. Start at MEDIUM, watch a dozen real deploys, then tune with evidence — false rollbacks erode trust in the gate before it’s earned any.
6. A CV run passes instantly with a green verdict but no data is plotted. What happened and how do you fix it? The analysis window was shorter than the metric scrape/aggregation interval, so CV had too few points to compare and defaulted toward low risk — a false pass, the most dangerous verdict. Fix by setting duration to at least 3–4× the scrape interval (15 min floor) and confirming each health-source query actually returns points during the window.
7. A real regression sails through CV as green even though Grafana clearly shows it. Most likely cause? The canary and stable series aren’t separated by label, so both versions blur into one and the regression averages out to invisible. Confirm by running the health query manually — if there’s no harness.io/track (or your canary label) dimension, CV can’t split it. Fix by stamping the label on pods, grouping the query by it, and setting the deployment-marker/service-instance identifier in the health source.
8. What single piece of configuration turns a red CV verdict into an automatic rollback? The stage’s failure strategy: onFailure → errors: [Verification] → action: StageRollback. Without it, a red verdict just pauses the pipeline for a human; with it, Harness deletes the canary and restores stable autonomously — the “2 a.m. eliminator.”
9. Compare canary, blue-green, and rolling on traffic exposure, rollback speed, and cost. Canary: graded exposure, fast rollback (delete canary pods), small extra compute — best CV comparison (canary vs stable). Blue-green: 0% real traffic on green until the flip, instant rollback (flip selector back), ~2× compute during overlap — CV runs as a threshold/smoke on green pre-flip. Rolling: increasing exposure as pods roll, slow rollback, ~1× compute — serves mixed versions mid-roll, CV limited to threshold analysis.
10. Why express Harness pipelines as YAML in Git rather than in the UI? A pipeline-as-code becomes a reviewable, versioned, diffable, revertible pull request rather than form state that lives only in Harness — enabling code review of deployment changes, a Git audit trail, and clean rollback of a bad pipeline change. Harness’s Git Experience can make Git the source of truth.
11. How do secrets stay out of the pipeline body, and why does the delegate use Vault’s Kubernetes auth method? Every credential is referenced as <+secrets.getValue(...)> backed by a Vault Secret Manager connector, resolved at runtime on the delegate. Kubernetes auth means the delegate authenticates to Vault using its ServiceAccount token (bound to a Vault role) with a short TTL, so there’s no static Vault token stored anywhere — a leaked-token risk removed.
12. What is the purpose of the ServiceNow approval stage, and what happens to the record on a CV rollback? It opens a change request and blocks the pipeline until the change is approved (a human/ITSM checkpoint before production), producing the audit artefact compliance wants. On a CV-triggered rollback, Harness updates the same record — typically flipping it to an incident with the CV report attached — so the “approved, then auto-rolled-back, here’s why” story is captured end to end.
These map to platform-engineering and progressive-delivery competency areas rather than a single vendor cert. A compact theme map for revision:
| Question theme | Competency area |
|---|---|
| Canary vs CV; strategies | Progressive delivery / deployment strategies |
| Object model; pipeline-as-code | CD platform design; GitOps-adjacent IaC |
| Analysis type / sensitivity / window | Metric-based release gating; SRE |
| Delegate networking + RBAC | Kubernetes security; in-cluster agents |
| Vault secrets; Okta/Entra SSO; ServiceNow | Enterprise IAM, secrets, and change management |
Quick check
- A Verify step returns a green verdict in under a minute with almost no data plotted, on a service whose Prometheus scrapes every 30 seconds. What went wrong and what’s the fix?
- Your canary metric charts show the canary and stable lines as a single indistinguishable series. Name the root cause and the one field that fixes it.
- Which single YAML mapping turns a high-risk CV verdict into an automatic rollback rather than a paused pipeline?
- You need instant rollback and cannot tolerate mixed-version state during a deploy. Which deployment strategy, and which CV analysis type does it imply?
- The Verify step fails with a connection error rather than a health verdict. Where do you look first, and what’s the most likely cause?
Answers
- The analysis window was shorter than the scrape interval (a 60-second window on a 30-second scrape gives CV ~2 points), so CV defaulted toward low risk — a false pass. Fix: set
durationto at least 3–4× the scrape interval (15 min floor) and confirm each query returns points during the window. - The canary and stable series aren’t separated by label — the
harness.io/tracklabel isn’t flowing into the metric series. Fix by setting the deployment-marker / service-instance identifier in the health source (and grouping the queryby (..., harness_io_track)) so CV can isolate canary from stable. onFailure → errors: [Verification] → action: StageRollbackon the stage’s failure strategy. Without it a red verdict only pauses for a human.- Blue-green — it flips the service selector atomically (instant rollback, no mixed versions), at ~2× compute during overlap. It implies a Threshold analysis (or smoke test) on the green environment before the flip, since there’s no stable-vs-canary split to compare.
- Look at the delegate’s reachability to the metric backend —
curlthe exact Prometheus/Datadog query from a Pod in the delegate namespace. The likely cause is a NetworkPolicy or egress rule blocking the in-cluster Prometheus ClusterIP orapi.datadoghq.com(or the Prometheus connector not set to run on the delegate).
Glossary
- Pipeline — an ordered set of stages; in Harness, the runnable unit, ideally stored as YAML in Git.
- Stage — one phase of a pipeline (Deployment, Approval, Custom). The canary-with-CV logic is a Deployment stage.
- Service — the what to deploy: manifest source(s) + artifact source (registry + image + tag). Defined once, reused across environments.
- Environment — the where:
dev/staging/prod, with a type (Production/PreProduction) that gates policy and RBAC. - Infrastructure Definition — the concrete target under an environment: deployment type, cluster connector, namespace, and a stable
releaseName. - Connector — a typed, credentialed link to an external system (Kubernetes, ECR, Prometheus, Datadog, Vault, ServiceNow); credentials come from the Secret Manager, never inline.
- Delegate — a worker process (a Pod here) inside your network that runs every deploy and every CV metric query and reports back to Harness.
- Monitored Service — the CV object binding a service+environment to its health sources.
- Health Source — a metric provider (Prometheus, Datadog, …) plus the CV metrics registered from it, each with a risk category and direction.
- Continuous Verification (Verify step) — the pipeline gate that runs the metric analysis during the deployment window and emits a risk verdict.
- Analysis type — the CV comparison method: Canary (canary vs stable), Threshold/Rolling (vs fixed min/max), Baseline (vs a pinned prior run).
- Sensitivity — LOW/MEDIUM/HIGH; how large a deviation must be before CV flags a regression. Start MEDIUM.
- Risk score — CV’s per-metric and overall verdict (green/amber/red) derived from the deviation between the analysed series and its baseline.
- Analysis window (
duration) — how long CV observes before deciding; set ≥ 3–4× the scrape interval. - Deployment marker / service-instance identifier — the label that separates canary from stable (and names the instance) so CV can split the series.
- Failure strategy — what the stage does when a step fails;
Verification → StageRollbackis what makes rollback automatic. - Deployment strategy — how the new version replaces the old: Canary (graded slice), Blue-Green (parallel env + flip), Rolling (batch replace).
- Pipeline-as-code — expressing the pipeline (and services/envs/connectors) as YAML in Git, making a deployment change a reviewable pull request.
<+input>/<+expression>— Harness runtime input (supplied at run, e.g. the image tag) / expression (resolved during execution, e.g.<+secrets.getValue(...)>).
Next steps
You can now build a canary-with-CV pipeline that promotes on evidence and rolls back autonomously. Build outward:
- Next: Set Up Argo Rollouts with Datadog Metric Analysis for Automated Canary Promotion — the open-source take on the same canary-plus-metric-analysis pattern, to compare against Harness CV.
- Related: Deploy Argo CD on Kubernetes with OIDC SSO, RBAC, and ApplicationSets for Multi-Cluster GitOps — the GitOps layer that coexists with this pipeline (Argo owns always-on apps; Harness orchestrates risky rollouts).
- Related: Automate ServiceNow Change Requests from a CI/CD Pipeline via the Change API — the ITSM automation behind the approval gate and the auto-created incident on rollback.
- Related: Set Up External Secrets Operator to Sync Vault and AWS Secrets into Kubernetes — get secrets into the workload cleanly alongside the delegate’s Vault integration.
- Related: Configure Dynatrace SLOs, Davis AI Anomaly Detection, and Management Zones — the wider observability and anomaly-detection view that complements CV’s per-deploy verdict.
- Related: Integrate PagerDuty Event Orchestration with Prometheus Alertmanager and Runbooks — where the alerts go for the failures CV doesn’t catch (infra, dependency outages).