A fintech’s platform team ships to a 60-node EKS cluster and has the usual pre-deploy controls dialled in — image scanning in CI, admission policies, network policies — but the CISO keeps asking the one question none of it answers: if an attacker is already inside a running container right now, what tells us? Every pre-deploy gate is blind the instant a pod starts. The wake-up call was a pen-test finding where a tester popped a shell in a payments pod through a deserialization bug, read a mounted service-account token, and pivoted laterally — and nothing alerted, because nothing was watching the kernel. Admission control checked the image; it had nothing to say about what the process did once it was running. The network policy allowed the egress the exfil rode out on. This is the runtime blind spot, and closing it is the job of a runtime security sensor.
This guide stands up that control: Falco, the CNCF runtime security project that watches every system call on every node through an in-kernel probe and turns suspicious syscall sequences into structured alerts within seconds — a shell spawned in a container, a read of /etc/shadow, a write below a read-only path, an outbound connect to a non-allowlisted IP, a container escaping to the host mount namespace. Falco is a detection control, not a prevention one: it tells you an attacker is acting, fast, so a human or an automation can respond. Paired with it is Falcosidekick, a small stateless service whose entire job is fan-out — it receives each Falco alert once and forwards it, in parallel and filtered by priority, to the places humans and machines actually look: Slack for the on-call, Alertmanager for correlation with your existing paging, Microsoft Sentinel for SIEM retention and hunting, Falcosidekick-UI for a live wall of events, and a webhook to your response layer. By the end you will understand the drivers well enough to pick the right one, write and tune real rules without drowning the on-call in noise, enrich detections with Kubernetes pod context, route them intelligently, size the deployment against syscall drops, wire an automated response with Falco Talon, and — in a copy-pasteable lab — trip a live detection and watch it surface end to end.
This is the Advanced treatment. It assumes you can drive kubectl, helm, and a cluster with privileged workloads; it does not assume you have run Falco before. The centrepiece is the hands-on lab, but the sections before it exist so that when the lab fires an alert you know exactly why, which driver saw it, which rule matched, and where it went.
What problem this solves
The entire modern Kubernetes supply-chain security stack — image scanning, SBOMs, admission control, signed images, network policies — operates before or around the workload, never inside it at runtime. That is a deliberate and correct design: shift left, catch problems cheaply. But it has an inherent horizon. The instant a container starts, every one of those controls has already had its say and gone quiet. A scanned, signed, admission-approved image with a zero-day in a dependency is still a scanned, signed, admission-approved image the moment an attacker exploits it. Network policy allows the connections the app legitimately needs — which is exactly the path a compromised app uses. RBAC governs the Kubernetes API, not the process reading a mounted secret off the filesystem.
What breaks without a runtime sensor is detection latency. The pen-test scenario above is the canonical one: an attacker gets code execution in a pod (deserialization bug, SSRF chained to a metadata endpoint, a leaked credential), then does the things attackers do — spawn a shell to look around, read the service-account token at /var/run/secrets/kubernetes.io/serviceaccount/token, enumerate the filesystem, reach out to a C2 host, try to write a cron entry or a new binary, attempt to break out of the container’s namespaces. None of that touches an admission webhook or a network policy denial. Without something reading the kernel’s syscall stream, the first signal you get is when the damage is done — a breach notification, an anomalous cloud bill, data on a paste site. The gap between compromise and detection is measured in weeks in the industry; a runtime sensor collapses it to seconds for the behaviours it recognises.
Who hits this: everyone running Kubernetes at any scale where “an attacker is already inside” is a threat you must be able to see, not just prevent. It bites hardest on regulated workloads (PCI-DSS explicitly wants file-integrity monitoring and intrusion detection; runtime detection satisfies both on containers), multi-tenant clusters (one tenant’s compromise must not silently become everyone’s), and teams whose EDR was built for VMs and does not express container/pod context natively. The failure mode of not having it is invisible until the incident; the failure mode of having it untuned is the on-call muting the channel within a day. This guide addresses both — stand it up, then make it trustworthy.
To frame the field before the deep dive, here is the runtime-security problem laid out as the questions Falco answers and the layer each belongs to:
| Question at runtime | Pre-deploy control that is blind to it | What Falco watches | Example rule |
|---|---|---|---|
| Did someone spawn a shell in a container? | Image scan, admission | execve of a shell binary in a container context |
Terminal shell in container |
| Did a process read a sensitive file? | Network policy, RBAC | open/openat of /etc/shadow, SA token |
Read sensitive file untrusted |
| Did a container write to a read-only path? | Pod Security admission (set the flag, doesn’t watch) | write/openat below /bin, /etc, /usr |
Write below binary dir |
| Did something connect outbound to a bad IP? | Network policy (allows legit egress) | connect with a non-allowlisted fd.sip |
Outbound to C2 / unexpected egress |
| Did a container try to escape to the host? | Admission (blocks privileged; escape can still be attempted) | setns, host mount, nsenter, symlink tricks |
Container escape / namespace change |
| Did someone modify a binary or config? | Signed images (build time only) | write to executables, /etc, package DBs |
File-integrity / binary modified |
| Was the K8s API misused? | RBAC (allows, doesn’t alert) | K8s audit events via the audit plugin | Create privileged pod, attach to pod |
Learning objectives
By the end of this article you can:
- Choose the correct Falco driver for a given node OS and kernel — legacy kernel module, legacy eBPF probe, or modern eBPF (CO-RE) — and explain the trade-offs, failure modes, and how to confirm which one actually loaded.
- Read and write Falco rules: understand the syscall event model, author
rule/macro/listobjects, buildconditionexpressions overevt.*/fd.*/proc.*/k8s.*fields, setpriorityandtags, and addexceptionswithout forking the vendor rules. - Tune noise the right way — append exceptions, raise or lower priorities, use
override/append, and drive tuning from real alert volume rather than guesswork — so the on-call trusts the channel. - Enrich alerts with Kubernetes context via the metadata plugin and detect API-level abuse via the k8s audit plugin, wiring both through
falcoctl-managed plugins. - Deploy Falco and Falcosidekick with Helm, configure per-sink minimum priorities so Slack, Alertmanager, Sentinel and the webhook each get the right signal-to-noise, and stand up Falcosidekick-UI.
- Diagnose and size for performance: read
syscall_event_drops, tune the ring buffer and buffered outputs, cap CPU/memory, and understand what a drop actually costs you. - Wire an automated response with Falco Talon — terminate, isolate, or label a pod on a
criticaldetection — and reason about when response should be automatic versus human-gated. - Run a full end-to-end lab that installs the stack, trips a live detection, and traces it from syscall to Slack, with a clean teardown.
Prerequisites & where this fits
You should be comfortable with the following before starting:
- A Kubernetes cluster, v1.27+, where you can run a privileged DaemonSet (EKS, AKS, GKE, k3s, kind, or self-managed all work). Examples assume EKS but call out cloud-specific deltas. For the lab, kind or a single-node k3s is enough and free.
- Worker-node kernels with eBPF / CO-RE support — Linux 5.8+ is the comfortable floor for the modern eBPF driver; Amazon Linux 2023, Ubuntu 22.04+, Bottlerocket, Flatcar, and GKE Container-Optimized OS all qualify. Modern eBPF needs no kernel headers and no compiled module.
kubectl(matching the cluster minor version),helmv3.12+, andjqon your workstation.- Basic familiarity with Linux syscalls (
execve,open,connect,setns) — you do not need to be a kernel engineer, but knowing that a shell is anexecveand a file read is anopenmakes the rules read like English. - For the routing sections: a Slack incoming-webhook URL, and optionally an Alertmanager endpoint, a Microsoft Sentinel (Log Analytics) workspace ID + shared key, and a secret store. The lab works with Slack alone (or with the built-in UI and no external sink at all).
Where this fits: runtime detection is the last layer of a defence-in-depth Kubernetes stack and complements — never replaces — the earlier ones. Upstream of it sit image scanning and registry controls (Deploy Harbor Registry on Kubernetes with Trivy Scanning, Replication & Signing) and admission-time verification (Software Supply Chain: SBOM Consumption, VEX & Admission Verification). Alongside it, an EDR does host-level prevention — on these nodes that is often CrowdStrike Falcon (Deploy the CrowdStrike Falcon Sensor on Linux & Kubernetes as a DaemonSet and CrowdStrike Falcon Runtime Protection for EKS & Fargate); Falco adds open, Kubernetes-native, rule-transparent syscall visibility that a VM-oriented EDR does not natively express. For network-flow context that pairs with syscall context, Cilium Hubble Network-Flow Observability & Service Map is the companion eBPF tool. The alerts land in the same routing plane as the rest of your platform: Alertmanager Routing Trees, Inhibition & Deduplication, Integrate PagerDuty Event Orchestration with Alertmanager & Runbooks, and for long-term hunting KQL Threat Hunting with MITRE ATT&CK & UEBA Notebooks.
A quick map of who owns what during a runtime detection, so you route the alert to the right responder:
| Layer | What lives here | Who usually owns it | What Falco tells them |
|---|---|---|---|
| Node kernel | The syscall stream, eBPF probe | Platform / SRE | Driver health, drops, sensor tampering |
| Pod / container | The workload behaviour | App team + Security | The specific suspicious action + pod context |
| K8s API | RBAC, audit log | Platform + Security | API-level abuse (privileged pod, exec, attach) |
| Routing (Falcosidekick) | Fan-out, filtering | Platform | Which sink got which priority |
| SOC / IR | Triage, response | Security operations | Critical detections, ServiceNow ticket, Talon action |
Core concepts
Six mental models make everything that follows obvious. Read these once; the rest of the article is their consequences.
Falco watches syscalls, and a syscall is the truth. Almost everything a process does that matters for security is a system call — the boundary where user-space code asks the kernel to do something privileged: open a file (open/openat), start a program (execve/clone), make a network connection (connect/socket), change namespaces (setns/unshare), or write data (write). An attacker can obfuscate their binary, encode their payload, and rename their tools, but to act they must call the kernel, and the syscall arguments are the ground truth. Falco subscribes to this stream via an in-kernel driver, decodes each event into a rich structure with typed fields, and evaluates it against rules. This is why runtime detection is fundamentally different from log analysis: it sees the action itself, not a log the attacker could suppress.
The driver is how Falco gets into the kernel — and there are three. Falco cannot read syscalls from user space alone; it needs code running in the kernel. Historically that was a kernel module (a .ko compiled and inserted, giving full access but requiring matching kernel headers and carrying the operational weight of loadable modules). The legacy eBPF probe does the same work as an eBPF program (safer, sandboxed by the kernel verifier, still compiled per-kernel via driverkit). The modern eBPF probe — the current default and recommendation — is a single CO-RE (Compile Once, Run Everywhere) eBPF object embedded in the Falco binary that relocates itself against the running kernel’s BTF (BPF Type Format) information, so it needs no headers, no compilation, and no per-node build. Picking the driver is the first real decision and the number-one source of a CrashLooping Falco pod.
Rules are conditions over event fields, composed from macros and lists. A Falco rule is a named object with a condition (a boolean expression), an output (a templated string), a priority, and tags. Conditions reference fields — evt.type=execve, proc.name, fd.name, container.image.repository, k8s.ns.name — combined with and/or/not, in (...), startswith, contains, pmatch, and comparisons. To keep conditions readable and reusable, Falco has macros (named condition fragments you reference by name) and lists (named sets of values you use with in). The shipped ruleset is built almost entirely from a library of macros and lists, which is why you tune by overriding those building blocks rather than rewriting rules.
Priority is both a severity and a routing key. Every rule has a priority from a fixed ladder — EMERGENCY, ALERT, CRITICAL, ERROR, WARNING, NOTICE, INFORMATIONAL, DEBUG. Falco has a global priority floor (it only evaluates and emits rules at or above it), and every downstream sink (Slack, Sentinel, the webhook) has its own minimum-priority filter. So priority does double duty: it tells a human how bad the event is, and it decides which destinations the alert reaches. Getting priorities right on your rules is the lever that controls the entire noise budget.
Enrichment turns “a syscall happened” into “which pod did it”. A raw syscall event knows about a process and a container ID, but not that the container is pod checkout-7d9f in namespace payments owned by Deployment checkout. Falco fills that gap with plugins and a metadata connection to the Kubernetes API: the metadata enrichment resolves container.id to pod name, namespace, labels, and owner, so %k8s.pod.name and %k8s.ns.name are available in outputs and conditions. A second, distinct capability is the k8s audit plugin, which is a separate event source — it reads the Kubernetes audit log (API-server activity like “someone created a privileged pod”) rather than node syscalls, letting one Falco deployment detect both host-level and control-plane-level abuse.
Falcosidekick is a router, not a brain. Falco emits alerts to a single HTTP output; Falcosidekick receives them and fans out. It holds no state, makes no detection decisions, and adds no rules — it takes each JSON alert and, based on the alert’s priority and your per-sink configuration, forwards copies to every enabled destination in parallel. Because delivery is Falco → Falcosidekick → sinks, adding or removing a destination is a Falcosidekick config change, not a fleet-wide Falco reconfiguration. This separation is the whole reason the topology scales: the expensive part (syscall inspection) runs once per node and stays simple; the cheap part (routing) runs centrally and absorbs all the integration complexity.
The vocabulary in one table
Pin down every moving part before the deep sections. The glossary repeats these for lookup; this is the mental model side by side:
| Concept | One-line definition | Where it lives | Why it matters |
|---|---|---|---|
| Driver | In-kernel code feeding syscalls to Falco | Loaded per node | Wrong driver → CrashLoop / no events |
| Modern eBPF | CO-RE eBPF probe, no headers/build | Embedded in Falco binary | The recommended default driver |
| Rule | Named condition + output + priority | Rules YAML | The unit of detection |
| Macro | Reusable named condition fragment | Rules YAML | Keeps conditions readable / tunable |
| List | Named set of values for in (...) |
Rules YAML | Enumerable allow/deny sets |
| Condition | Boolean expression over event fields | Inside a rule | What must be true to alert |
| Field | A typed attribute of an event (proc.name) |
Event decoding | The vocabulary of conditions |
| Priority | Severity + routing key (CRITICAL etc.) |
Per rule + global floor | Controls noise and destinations |
| Exception | Structured allowlist attached to a rule | Inside a rule | Tune without forking vendor rules |
| Plugin | Loadable event source or field extractor | falcoctl-managed |
K8s audit, metadata enrichment |
| Falcosidekick | Stateless fan-out router for alerts | Deployment (2 replicas) | Sends alerts to Slack/SIEM/etc. |
| Falco Talon | Response engine that acts on alerts | Deployment | Terminate/isolate/label pods |
| Syscall drop | An event Falco couldn’t keep up with | Ring buffer overflow | A dropped event is a missed detection |
The drivers: kernel module vs eBPF probe vs modern eBPF
This is the first decision and the first place things go wrong, so it gets the depth it deserves. Falco needs code in the kernel to see syscalls; the three ways to get it there differ in how they are built, what they require of the node, and how they fail.
How each driver works
Kernel module (kmod) is the original mechanism: a loadable kernel module (falco.ko) inserted with insmod. It runs in full kernel context with complete access to syscall data. Because a kernel module must match the exact running kernel version, it is either shipped as a prebuilt artifact for known kernels or compiled on the node against installed kernel headers. A module crash can panic the node, and on managed node pools you frequently do not control headers — which is why the kernel module is the least recommended option on cloud Kubernetes today.
Legacy eBPF (ebpf) does the same syscall capture but as an eBPF program instead of a module. eBPF programs run in a kernel sandbox validated by the verifier, so a bug cannot panic the kernel — a major safety improvement. Historically this driver still had to be compiled per kernel (via driverkit, producing a .o per kernel version), so it inherited some of the module’s per-kernel-build friction, though without the headers-in-production requirement when prebuilt probes exist.
Modern eBPF (modern_ebpf) is the current default and recommendation. It is a single CO-RE eBPF object embedded directly in the Falco binary. CO-RE means the object carries relocation information and, at load time, relocates its field offsets against the running kernel’s BTF data (exposed at /sys/kernel/btf/vmlinux on modern kernels). The result: one artifact runs on any sufficiently modern kernel with no headers, no driverkit, no per-node compilation, and no separate download step. This is what makes Falco trivial to run across a heterogeneous fleet — the same DaemonSet image works on every supported node.
Driver comparison
| Dimension | kmod (kernel module) |
ebpf (legacy probe) |
modern_ebpf (CO-RE) |
|---|---|---|---|
| Kernel code type | Loadable .ko module |
eBPF program (compiled per kernel) | CO-RE eBPF (single object) |
| Needs kernel headers | Yes (or prebuilt module) | No (or prebuilt probe) | No |
| Per-kernel build | Yes | Yes (via driverkit) |
No — one object for all |
| Minimum kernel | Broad (older kernels OK) | ~4.14+ | ~5.8+ (needs BTF) |
Requires BTF (/sys/kernel/btf/vmlinux) |
No | No | Yes |
| Safety on bug | Can panic the node | Verifier-sandboxed | Verifier-sandboxed |
| Best on | Legacy self-managed nodes with headers | Older kernels lacking BTF | Managed/modern cloud nodes |
| Operational weight | High (module lifecycle) | Medium (probe build/cache) | Low (embedded, zero build) |
| Falco recommendation (current) | Discouraged | Fallback for old kernels | Default / recommended |
Choosing the driver
The decision is almost entirely about the node kernel:
| If your nodes are… | Kernel typically | Choose | Because |
|---|---|---|---|
| Amazon Linux 2023 / Bottlerocket | 6.1+ | modern_ebpf |
BTF present, no headers to manage |
| Ubuntu 22.04+ / Flatcar / COS (recent) | 5.15+ / 6.x | modern_ebpf |
BTF present, CO-RE relocates cleanly |
| Amazon Linux 2 (older AMIs) | 5.10 (varies) | modern_ebpf if BTF exists, else ebpf |
Check /sys/kernel/btf/vmlinux first |
| Very old / hardened distro, no BTF | < 5.8 or BTF stripped | ebpf (prebuilt) |
Legacy probe does not need BTF |
| Self-managed with controlled headers | any | kmod only if you must |
Full access but heaviest ops |
| GKE / AKS default node images | 5.15+ | modern_ebpf |
BTF present on current images |
The practical rule: default to modern_ebpf; verify BTF exists on a node; only fall back to ebpf if BTF is genuinely absent; avoid kmod on managed clusters. Confirm BTF from a node or a debug pod before you deploy:
# BTF present? (modern_ebpf requires this file)
ls -l /sys/kernel/btf/vmlinux && echo "BTF OK — modern_ebpf will work"

# From inside a privileged debug pod on the target node:
kubectl debug node/<node-name> -it --image=busybox -- \
  ls -l /host/sys/kernel/btf/vmlinux
Set the driver in Helm values (this single key is the whole decision):
# values.yaml — driver selection is one key
driver:
  kind: modern_ebpf     # one of: modern_ebpf | ebpf | kmod
What each driver costs and its failure signature
Knowing the failure signature saves the most incident time — a Falco pod can be Running while the probe silently failed, giving you a sensor that sees nothing.
| Driver | Typical CPU overhead per node | Failure signature in logs | First remediation |
|---|---|---|---|
modern_ebpf |
Low–moderate (syscall-volume dependent) | “Unable to load BPF probe” / BTF errors / CrashLoop | Confirm BTF; else fall back to ebpf |
ebpf |
Moderate | “Can’t open BPF probe” / probe download failure | Ensure prebuilt probe available / driverkit |
kmod |
Moderate | “insmod failed” / “module verification failed” | Install matching headers or switch to eBPF |
A subtle but critical point: there is no drop in security coverage across the three drivers — they all capture the same syscall set and feed the same rules engine. The choice is purely operational (build model, kernel requirements, safety). So there is never a reason to fight with the kernel module for “better detection”; pick the one that runs cleanly on your nodes.
The rules engine in depth
The rules engine is where Falco becomes your detector rather than a generic one. Master four object types — rules, macros, lists, and exceptions — and the field vocabulary they draw on, and you can express essentially any syscall-observable behaviour.
The event and field model
Every event Falco evaluates is a decoded syscall (or, for the audit plugin, a Kubernetes audit event). Fields are grouped by prefix, and conditions are boolean expressions over them. The high-value field families:
| Field family | Examples | What it describes |
|---|---|---|
evt.* |
evt.type, evt.dir, evt.arg.*, evt.time |
The syscall itself — type, direction (> enter / < exit), arguments |
proc.* |
proc.name, proc.cmdline, proc.pname, proc.exepath, proc.tty |
The process that made the call and its ancestry |
fd.* |
fd.name, fd.sip, fd.sport, fd.directory, fd.type |
The file/socket the call touched |
user.* / group.* |
user.name, user.uid, user.loginuid |
Identity behind the process |
container.* |
container.id, container.image.repository, container.privileged |
The container context |
k8s.* (enriched) |
k8s.ns.name, k8s.pod.name, k8s.pod.label.* |
Kubernetes metadata (needs enrichment) |
ka.* (audit plugin) |
ka.verb, ka.target.resource, ka.user.name |
Kubernetes API audit fields |
Common operators inside conditions, with the gotcha that trips newcomers:
| Operator | Meaning | Example | Gotcha |
|---|---|---|---|
and / or / not |
Boolean logic | evt.type=open and not proc.name=nginx |
not binds tightly — parenthesise |
= / != |
Equality | k8s.ns.name = "payments" |
String compare; quote values with spaces |
in (a, b) |
Membership | proc.name in (bash, sh, zsh) |
Values are a list; pairs well with a list |
pmatch (...) |
Path-prefix match | fd.name pmatch (/etc, /bin) |
Efficient path matching; use over many startswith |
startswith / endswith / contains |
Substring | fd.name startswith /proc |
contains is slower; prefer anchored forms |
exists |
Field is present | fd.sip exists |
Guards against null-field false matches |
glob |
Glob pattern | fd.name glob "/home/*/.ssh/*" |
Handy for user-home patterns |
Rules, macros, and lists
A rule is the alerting unit. A minimal, real rule:
- rule: Read sensitive file untrusted
  desc: An attempt to read any sensitive file (e.g. shadow, SA token) by a non-trusted program
  condition: >
    open_read and sensitive_files and proc_name_exists
    and not proc.name in (known_shadow_readers)
    and not container.image.repository in (allowed_sensitive_readers)
  output: >
    Sensitive file opened for reading by non-trusted program
    (user=%user.name user_loginuid=%user.loginuid program=%proc.name
     file=%fd.name container=%container.name image=%container.image.repository
     pod=%k8s.pod.name ns=%k8s.ns.name)
  priority: WARNING
  tags: [filesystem, mitre_credential_access, T1552]
Every field in that rule earns its place: desc documents intent, condition combines macros (open_read, sensitive_files, proc_name_exists) with an inline exclusion, output is a template where %field placeholders are substituted at alert time, priority sets severity/routing, and tags carry classification (including MITRE ATT&CK technique IDs) that Falcosidekick can route on.
A macro is a named condition fragment — the reusable building block that makes the rule above readable:
- macro: open_read
  condition: (evt.type in (open,openat,openat2) and evt.is_open_read=true and fd.typechar='f')

- macro: sensitive_files
  condition: >
    fd.name pmatch (/etc/shadow, /etc/sudoers, /etc/pam.conf)
    or fd.directory in (/etc/sudoers.d, /etc/pam.d)
    or fd.name startswith /var/run/secrets/kubernetes.io/serviceaccount
A list is a named set of values used with in:
- list: shell_binaries
  items: [ash, bash, csh, ksh, sh, tcsh, zsh, dash]

- list: allowed_sensitive_readers
  items: [registry.kloudvin.io/sre/backup-agent]
The payoff of this composition is tunability: because the shipped rules are built from a library of macros and lists, you tune the whole ruleset by overriding a macro or extending a list once, rather than editing dozens of rules. Extend the shell-binary list, and every rule that references it updates.
Priorities and what they mean
The eight-rung priority ladder, highest to lowest, with how each should map to routing:
| Priority | Numeric sense | Use it for | Typical routing |
|---|---|---|---|
EMERGENCY |
Highest | System unusable (rare in Falco rules) | Page + auto-response |
ALERT |
Very high | Immediate action required | Page + SIEM + Talon |
CRITICAL |
High | Active intrusion behaviour | Slack + SIEM + webhook/Talon |
ERROR |
Elevated | Strong-signal suspicious action | Slack + SIEM |
WARNING |
Notable | Suspicious but not conclusive | Slack (tuned) + SIEM |
NOTICE |
Informational-plus | Policy-relevant but low signal | SIEM only |
INFORMATIONAL |
Low | Baseline activity | SIEM (sampled) or drop |
DEBUG |
Lowest | Rule development only | Never to prod sinks |
Falco’s global priority setting is a floor: rules below it are not even evaluated for output, which is a coarse performance and noise lever. The finer lever is per-sink minimumpriority in Falcosidekick (covered below). The design principle: set the global floor low enough that the SIEM sees everything worth retaining, and let each human-facing sink filter up from there.
Exceptions — the modern way to allowlist
Editing shipped rules in place is the cardinal sin (a chart upgrade overwrites your edits). Falco provides two clean mechanisms to adjust vendor rules without forking them: the classic append and the structured exceptions/override.
The exceptions field attaches structured, named allowlists to a rule. Rather than bolting and not (...) onto a condition, you declare exception fields and provide value tuples:
# Append an exception to a shipped rule without editing it
- rule: Terminal shell in container
  exceptions:
    - name: trusted_debug_images
      fields: [container.image.repository, proc.name]
      comps: [in, in]
      values:
        - [[registry.kloudvin.io/sre/debug], [bash, sh]]
        - [[registry.kloudvin.io/sre/toolbox], [sh]]
This says: do not fire this rule when the image is one of our debug images and the process is a shell — expressed as data, not condition surgery. Exceptions are self-documenting, greppable, and survive upgrades because they add to the shipped rule rather than replacing it.
The override mechanism (newer, YAML-schema-versioned rules) lets you replace or extend specific parts of a rule — its condition, priority, output, or exceptions — with explicit replace/append semantics:
# Raise a shipped rule's priority and append a namespace guard (override syntax)
- rule: Read sensitive file untrusted
  priority: CRITICAL
  condition: and not k8s.ns.name in (kube-system, monitoring)
  override:
    priority: replace
    condition: append
The tuning-mechanism decision table:
| Mechanism | Syntax | Use when | Upgrade-safe? |
|---|---|---|---|
append: true |
Legacy per-rule append of condition/exceptions | Simple “and not X” additions | Yes (separate file) |
exceptions |
Structured named allowlists on a rule | Multi-field allowlists you want documented | Yes |
override |
Explicit replace/append per field |
Changing priority/output/condition of a shipped rule | Yes (schema-versioned) |
Custom rule |
A brand-new rule you own | Bespoke detections | Yes (it is yours) |
| Editing shipped rules in place | (don’t) | Never | No — clobbered on upgrade |
Rule-authoring reference
The full anatomy of a rule object, field by field:
| Rule field | Required? | Purpose | Notes / gotcha |
|---|---|---|---|
rule |
Yes | The rule’s unique name | Must be unique; re-declaring with append/override targets it |
desc |
Yes (new rules) | Human description of intent | Shows in docs and some outputs |
condition |
Yes | Boolean expression to match | Compose from macros; parenthesise not |
output |
Yes | Templated alert string | %field placeholders; keep it grep-friendly |
priority |
Yes | Severity + routing key | One of the eight; drives sink filtering |
tags |
Recommended | Classification (MITRE, domain) | Falcosidekick can route on tags |
source |
No (defaults syscall) |
Event source | k8s_audit for audit-plugin rules |
enabled |
No (default true) | Turn a rule off | Set false to disable a shipped rule cleanly |
exceptions |
No | Structured allowlists | Preferred over inline and not |
warn_evttypes |
No | Suppress evttype warnings | Rarely needed |
skip-if-unknown-filter |
No | Tolerate unknown fields | Useful when a field needs a plugin |
The default ruleset and writing custom rules
Falco ships a maintained default ruleset (falco_rules.yaml) plus incubating/sandbox rule collections, distributed and versioned as rulesfiles through falcoctl. Understanding what is in the box — and what is deliberately noisy — is the starting point for tuning.
What the default ruleset covers
The shipped rules cluster into recognisable detection families. A representative (not exhaustive) map, with the behaviour each catches and its out-of-the-box noise level:
| Default rule (representative) | Detects | Default priority | Typical noise |
|---|---|---|---|
| Terminal shell in container | execve of a shell in a container |
NOTICE/WARNING | High (CI, debug) |
| Read sensitive file untrusted | Reading shadow/SA-token/sudoers | WARNING | Medium |
| Write below binary dir | Writes under /bin, /sbin, /usr/bin |
ERROR | Low |
| Write below etc | Writes under /etc |
ERROR/WARNING | Medium (config tools) |
| Launch privileged container | A privileged container starts | INFO/NOTICE | Medium (some infra) |
| Change thread namespace | setns (container escape signal) |
NOTICE | Medium |
| Run shell untrusted | Parent-not-shell spawns a shell | DEBUG/NOTICE | High |
| Contact K8s API server from container | Pod talks to the API server IP | NOTICE | High (many apps do) |
| Unexpected outbound connection | Egress not matching an allowlist | NOTICE | Very high (needs tuning) |
| Sudo potential privilege escalation | sudo/setuid patterns |
NOTICE | Medium |
| Clear log activities | Truncating/removing log files | WARNING | Low |
| Create files below dev | Writing under /dev |
ERROR | Low |
| Modify binary dirs | Renames/links in binary dirs | ERROR | Low |
| Non-sudo setuid | setuid to root by non-sudo |
NOTICE | Medium |
The pattern is clear: the low-noise rules (writing to binary dirs, clearing logs) are safe to leave loud; the high-noise rules (shells, API contact, generic egress) are the ones that demand tuning against your actual workload before they page anyone.
A worked custom rule, end to end
Bespoke rules are where Falco earns its keep — encoding your threat model. Here is a complete custom rulesfile that (a) tunes two shipped rules via exceptions, (b) raises one priority, and © adds a bespoke detection, all upgrade-safe:
# custom-rules.yaml — delivered via the chart's customRules map (kept in Git, no secrets)
customRules:
  kloudvin-tuning.yaml: |-
    # ---- Lists we own (extend the built-in vocabulary) ----
    - list: trusted_debug_images
      items: [registry.kloudvin.io/sre/debug, registry.kloudvin.io/sre/toolbox]

    - list: payments_egress_allowlist
      items: [10.0.0.0/8, 172.16.0.0/12, 192.168.0.0/16]

    # ---- Macro: known-good CI runner that legitimately exec's into pods ----
    - macro: trusted_ci_runner
      condition: (proc.pname in (runner, buildkite-agent) and container.image.repository startswith registry.kloudvin.io/ci)

    # ---- Tune shipped rule via structured exception (upgrade-safe) ----
    - rule: Terminal shell in container
      exceptions:
        - name: sre_debug_and_ci
          fields: [container.image.repository]
          comps: [in]
          values:
            - [trusted_debug_images]

    # ---- Raise priority of SA-token reads outside system namespaces ----
    - rule: Read sensitive file untrusted
      priority: CRITICAL
      condition: and not k8s.ns.name in (kube-system, monitoring, falco)
      override:
        priority: replace
        condition: append

    # ---- Bespoke: outbound from a payments pod to a public (non-RFC1918) IP ----
    - rule: Payments pod egress to public IP
      desc: A pod in the payments namespace connected outbound to a non-private address
      condition: >
        evt.type in (connect) and evt.dir = < and k8s.ns.name = "payments"
        and fd.sip exists
        and not fd.net in (payments_egress_allowlist)
      output: >
        Payments egress to public IP
        (pod=%k8s.pod.name dest=%fd.sip:%fd.sport proc=%proc.cmdline
         image=%container.image.repository ns=%k8s.ns.name)
      priority: CRITICAL
      tags: [network, payments, mitre_exfiltration, T1041]

    # ---- Bespoke: a package manager running in a running container (drift) ----
    - rule: Package manager launched in container
      desc: apt/yum/apk running at runtime — images should be immutable
      condition: >
        spawned_process and container
        and proc.name in (apt, apt-get, yum, dnf, apk, pip, npm)
        and not trusted_ci_runner
      output: >
        Package management executed in a running container
        (proc=%proc.cmdline image=%container.image.repository pod=%k8s.pod.name ns=%k8s.ns.name)
      priority: WARNING
      tags: [process, drift, mitre_execution, T1072]
The reasoning behind each block matters as much as the syntax. The trusted_debug_images list is data your team can PR without touching detection logic. The Terminal shell in container exception silences the single noisiest default without disabling it — a shell in an untrusted image still fires. The priority bump on SA-token reads is a business decision (in payments, reading a token is a bigger deal) expressed declaratively. The two bespoke rules encode threat-model specifics no generic ruleset could know: your payments namespace’s egress allowlist, and your policy that runtime package installs are drift. Every one of these survives helm upgrade because none edits a shipped rule in place.
The custom-rule design checklist
Before shipping a rule, run it against these questions — each maps to a class of mistake:
| Question | Why it matters | If “no” |
|---|---|---|
Does the condition anchor evt.type? |
Unanchored conditions match too many events (perf + noise) | Add the specific syscall(s) |
Is evt.dir set for network/exit-side data? |
fd.sip etc. are only populated on the exit direction |
Add evt.dir = < |
| Does it exclude known-good actors explicitly? | Otherwise it pages on legitimate behaviour | Add an exceptions block |
| Is the priority proportional to the signal? | Over-priority floods paging; under-priority hides it | Recalibrate against the ladder |
| Are output fields grep- and route-friendly? | Responders parse the output | Include pod/ns/image/proc |
| Are MITRE tags attached? | Enables ATT&CK-based routing and hunting | Add mitre_* / technique IDs |
Did you test it with -M/replay before prod? |
Untested rules cause 3am surprises | Validate against a capture |
Kubernetes context: audit events and metadata enrichment (plugins)
A syscall event on its own says “container a1b2c3 opened /etc/shadow.” To respond you need “pod checkout-7d9f in namespace payments, owned by Deployment checkout, on node ip-10-0-3-14.” Two distinct Falco capabilities close that gap, and it is worth being precise about which does what because they are commonly conflated.
Metadata enrichment — resolving container to pod
Falco resolves container IDs to rich Kubernetes metadata by talking to the API server (via the node’s kubelet/API), populating the k8s.* fields — k8s.ns.name, k8s.pod.name, k8s.pod.label.*, and owner references. This is what makes %k8s.pod.name appear in outputs and lets conditions filter by k8s.ns.name. In current Falco this enrichment is handled through the k8smeta plugin paired with a small in-cluster collector (k8s-metacollector), which watches the API and pushes pod metadata to each Falco pod efficiently, avoiding every node hammering the API server independently.
Enable it in Helm:
# values.yaml — Kubernetes metadata enrichment
collectors:
  kubernetes:
    enabled: true          # deploys k8s-metacollector and wires the k8smeta plugin
The enrichment fields you gain, and where they come from:
| Field | Example value | Populated by | Used for |
|---|---|---|---|
k8s.ns.name |
payments |
Metadata enrichment | Namespace-scoped rules/exceptions |
k8s.pod.name |
checkout-7d9f-abc12 |
Metadata enrichment | Identifying the exact pod in an alert |
k8s.pod.label.app |
checkout |
Metadata enrichment | Routing by workload label |
k8s.pod.uid |
3f1c… |
Metadata enrichment | Correlating across events |
container.image.repository |
registry.kloudvin.io/checkout |
Container context (no plugin) | Image-based allowlists |
container.id |
a1b2c3d4 |
Container context (no plugin) | Correlating to runtime |
The k8s audit plugin — a second event source
Entirely separate from enrichment, the k8saudit plugin makes Falco consume the Kubernetes API-server audit log as a new event source (k8s_audit), alongside syscalls. This detects control-plane abuse that never produces a node syscall Falco would see: someone creating a privileged pod, attaching to a running pod, creating a ClusterRoleBinding to cluster-admin, or reading every Secret in a namespace. These are RBAC-allowed actions (so RBAC won’t stop them) that are nonetheless suspicious, and only the audit log reveals them.
Wiring it has two halves: configure the API server to emit audit events to a webhook (or file) and configure the plugin to read them. On managed control planes (EKS/AKS/GKE) you typically enable audit logging to the cloud’s log service and forward, or use the dynamic webhook backend; on self-managed clusters you set --audit-webhook-config-file on the API server pointing at the Falco service.
# values.yaml — load the k8saudit plugin as an event source
falcoctl:
  config:
    artifact:
      install:
        refs: [k8saudit-rules:0, k8saudit:0, json:0]   # rules + plugin + json field extractor

falco:
  plugins:
    - name: k8saudit
      library_path: libk8saudit.so
      init_config: ""
      open_params: "http://:9765/k8s-audit"     # Falco listens for audit webhook posts
    - name: json
      library_path: libjson.so
  load_plugins: [k8saudit, json]

  # A dedicated rules source for audit events
  rules_files:
    - /etc/falco/k8s_audit_rules.yaml
Audit-source rules use ka.* fields and declare source: k8s_audit:
- rule: Attach or exec to a pod
  desc: An attach or exec to a running pod via the K8s API
  condition: ka.verb in (create) and ka.target.resource=pods and ka.target.subresource in (exec, attach)
  output: >
    Attach/exec to pod (user=%ka.user.name pod=%ka.target.name ns=%ka.target.namespace
     action=%ka.target.subresource)
  priority: NOTICE
  source: k8s_audit
  tags: [k8s_audit, mitre_execution, T1609]
Syscall source vs audit source — the distinction that matters
| Aspect | Syscall source (default) | k8s_audit source (plugin) |
|---|---|---|
| What it reads | Node kernel syscalls via the driver | Kubernetes API-server audit log |
| Detects | In-container behaviour (shell, file read, egress) | Control-plane abuse (privileged pod, exec, RBAC) |
| Fields | evt.*, proc.*, fd.*, container.*, k8s.* |
ka.* |
| Where it runs | Every node (DaemonSet) | Wherever it receives the audit stream |
| Enable via | Driver (always on) | k8saudit plugin + API-server audit config |
Rule source: |
syscall (default) |
k8s_audit |
| Failure if misconfigured | No syscall events (driver issue) | No audit events (API-server not forwarding) |
The metadata-vs-audit distinction in one line: metadata enrichment makes your syscall alerts legible (which pod?); the audit plugin gives you a whole new category of alerts (what happened at the API?). Most deployments want both — enrichment always, and the audit plugin wherever you can feed it the audit log.
Falcosidekick: routing alerts to Slack, Alertmanager, SIEM and the UI
Falco emits every alert to one HTTP endpoint; Falcosidekick turns that single stream into the right messages in the right places. It supports dozens of outputs — chat (Slack, Teams, Mattermost), alerting (Alertmanager, PagerDuty, Opsgenie), SIEM/log (Elasticsearch, Loki, Microsoft Sentinel, Splunk, AWS CloudWatch, GCP), object stores, message queues, and response engines (Falco Talon) — each with an independent minimumpriority filter and its own credentials.
Per-sink priority: the noise dial
The single most important Falcosidekick concept is that each output filters independently, so you send the right volume to each audience. The mental model:
| Sink | minimumpriority |
Volume | Why this level |
|---|---|---|---|
| Slack (on-call channel) | warning |
Low | Humans page-fatigue fast; only actionable events |
| Alertmanager | error |
Low-medium | Feeds existing paging/inhibition trees |
| Microsoft Sentinel / SIEM | notice or "" |
High | Retention + hunting; volume is fine, humans don’t read live |
| Falcosidekick-UI | "" (all) |
Highest | A live wall; the point is to see everything |
| Webhook → response/SOC bridge | critical |
Tiny | Each one may open a ticket or trigger automation |
| Falco Talon (response) | critical |
Tiny | Automated action must be high-confidence only |
The rule of thumb: the SIEM and the UI drink from the firehose; humans and automation sip. Set the global Falco priority floor to notice (so debug/info never even leave the node), send everything to the SIEM, and let each human/automation sink filter up from there.
Configuring the sinks
A complete, secrets-free Falcosidekick config covering the main sinks (secrets arrive via envFrom from a Secret, never inline):
# values.yaml (Falcosidekick section) — routing only, no credentials
falcosidekick:
  enabled: true
  replicaCount: 2
  config:
    debug: false
    customfields: "cluster:prod-eks-payments,env:prod"   # tag every alert
    templatedfields: ""
    # ---- Slack: page humans on warning+ only ----
    slack:
      minimumpriority: "warning"
      messageformat: "Falco *{{ .Rule }}* on `{{ .Hostname }}` ({{ .Priority }})"
      outputformat: "all"
    # ---- Alertmanager: feed the existing paging tree at error+ ----
    alertmanager:
      hostport: "http://alertmanager.monitoring:9093"
      minimumpriority: "error"
      expireafter: 3600
      extralabels: "team:secops,source:falco"
    # ---- Microsoft Sentinel (Log Analytics): everything, for hunting/retention ----
    azuresentinel:
      minimumpriority: ""            # send EVERYTHING to the SIEM
    # ---- Loki: mirror to the log store the SRE team already runs ----
    loki:
      hostport: "http://loki.monitoring:3100"
      minimumpriority: "notice"
      tenant: "secops"
    # ---- Generic webhook to the SOC/response bridge: criticals only ----
    webhook:
      address: "https://soc-bridge.internal.kloudvin.io/falco"
      minimumpriority: "critical"
      mutualtls: false
  # pull Slack URL, Sentinel id/key, webhook auth header, etc. from the Secret
  webui:
    enabled: true
    replicaCount: 1
    redis:
      enabled: true                 # UI stores recent events in a bundled Redis
The secrets ride in separately, so the routing file above can live in Git untouched:
# values-secrets.yaml — a pointer to a Secret synced from your secret store
falcosidekick:
  extraEnvFrom:
    - secretRef:
        name: falcosidekick-secrets
Create the Secret from your secret store. In production, an operator like the External Secrets Operator (Set Up the External Secrets Operator with Vault & AWS Secrets on Kubernetes) or a central Vault broker (HashiCorp Vault as a Central Secrets Broker Across Multi-Cloud) owns this Secret so rotation propagates automatically. The imperative bring-up (fine for the lab and for seeing what is in the box):
kubectl -n falco create secret generic falcosidekick-secrets \
  --from-literal=SLACK_WEBHOOKURL="$SLACK_WEBHOOK" \
  --from-literal=AZURESENTINEL_WORKSPACEID="$SENTINEL_WSID" \
  --from-literal=AZURESENTINEL_SHAREDKEY="$SENTINEL_KEY" \
  --from-literal=WEBHOOK_CUSTOMHEADERS="Authorization:Bearer $WEBHOOK_TOKEN"
The environment-variable names are exactly the keys Falcosidekick reads (SLACK_WEBHOOKURL, AZURESENTINEL_WORKSPACEID, etc.), so envFrom maps them straight in with no inline secret.
Falcosidekick output reference
The high-value outputs and what each is for (Falcosidekick supports many more):
| Output | Category | Typical minimumpriority |
Notes |
|---|---|---|---|
| Slack / Mattermost / Teams | Chat | warning+ |
Human on-call; format the message |
| Alertmanager | Alerting | error+ |
Integrates with inhibition/routing trees |
| PagerDuty / Opsgenie | Paging | critical |
For true page-worthy events only |
| Microsoft Sentinel | SIEM | ""/notice |
Log Analytics Data Collector API |
| Elasticsearch / Splunk / Loki | Log/SIEM | notice+ |
Retention + search |
| AWS CloudWatch / S3 / SQS | Cloud/queue | varies | Archival, downstream processing |
| Prometheus (metrics) | Metrics | n/a | Exposes falcosidekick_* counters |
| Falco Talon | Response | critical |
Triggers automated remediation |
| Webhook | Generic | critical |
Your bridge to any custom system |
| Falcosidekick-UI | UI | "" |
Live event wall (bundled Redis) |
Falcosidekick-UI and its own telemetry
Falcosidekick-UI is a small web app (backed by a bundled Redis) showing a live, filterable stream of recent alerts with counts by rule, priority, namespace, and pod — invaluable during an incident and for demoing what the sensor sees. Expose it via port-forward for the lab; in production put it behind your ingress + SSO, never public. Falcosidekick itself exports Prometheus metrics (falcosidekick_outputs_total{destination=...,status=...}), which are how you prove delivery — a non-zero error count on a destination means that sink is failing silently.
# See per-output delivery counters (proof that routing works)
kubectl -n falco exec deploy/falco-falcosidekick -- \
  wget -qO- http://localhost:2801/metrics | grep falcosidekick_outputs_total
Tuning noise, performance and syscall drops
A runtime sensor that pages on legitimate behaviour gets muted, and a muted sensor detects nothing — so tuning is not optional polish, it is the difference between a working control and shelfware. Separately, a sensor that drops syscalls under load has literal blind spots. Both are engineering problems with concrete levers.
Tuning noise the right way
The disciplined loop: measure which rules fire, decide legitimate vs suspicious, encode exceptions, re-measure. Never tune from intuition — tune from your cluster’s actual alert distribution.
# What's actually firing, ranked — read this before writing a single exception
kubectl -n falco logs ds/falco -c falco --since=24h \
  | grep -oE 'Falco rule|rule=[^ ]+' | sort | uniq -c | sort -rn | head -20

# Or, if using JSON output, count by rule name cleanly:
kubectl -n falco logs ds/falco -c falco --since=24h \
  | jq -r 'select(.rule) | .rule' 2>/dev/null | sort | uniq -c | sort -rn | head -20
The tuning decision table — for each noisy rule, the right lever:
| Situation | Wrong move | Right move |
|---|---|---|
| CI runner exec’s into pods, firing “Terminal shell” | Disable the rule | exceptions for the CI image/process |
| A sidecar reads a sensitive file by design | Lower the rule’s priority globally | Exception scoped to that image + path |
| “Unexpected outbound” fires on every app | Mute the channel | Build an egress allowlist; scope the rule |
| A rule is genuinely irrelevant to you | Comment out a shipped file | enabled: false on that rule |
| Whole class of noise from one namespace | Broad and not on many rules |
One macro (trusted_namespaces) reused |
| Priority too high, over-paging | Raise Slack’s floor to hide it | Recalibrate the rule’s priority |
Performance and syscall drops
Falco processes every syscall on the node in the hot path; if events arrive faster than it can consume them, the kernel ring buffer overflows and Falco drops events. A dropped event is a missed detection — the one syscall you cared about may be the one dropped — so drops are a security problem, not just a performance metric. Falco tracks them and can be configured to alert on them.
# Falco reports drops in its own logs / metrics — watch this number
kubectl -n falco logs ds/falco -c falco | grep -i "syscall event drop"

# Falco exposes internal metrics (enable in config) including drop counters
kubectl -n falco exec ds/falco -c falco -- \
  wget -qO- http://localhost:8765/metrics 2>/dev/null | grep -iE 'drop|scap'
What causes drops and how to address each:
| Drop cause | Signature | Mitigation | Trade-off |
|---|---|---|---|
| Very high syscall volume (chatty node) | Rising n_drops under load |
Larger ring buffer (syscall_buf_size_preset) |
More kernel memory per node |
| Falco CPU-starved | Falco at its CPU limit | Raise CPU limit; reduce enabled rules | More node CPU for the sensor |
| Expensive conditions | High per-event eval cost | Anchor evt.type; avoid broad contains |
Rule-authoring discipline |
| Output backpressure | Slow HTTP output blocks | buffered_outputs: true; async output |
Slight alert latency |
| Too many low-value rules | Evaluating noise you drop anyway | Raise global priority floor |
Coarser detection |
The relevant performance knobs in Falco’s config, with sane starting points:
| Setting | What it controls | Default-ish | Tune to |
|---|---|---|---|
priority (global floor) |
Lowest priority evaluated | debug/info |
notice in prod (skip chatter) |
syscall_buf_size_preset |
Per-CPU ring buffer size | preset default | Larger on high-volume nodes |
buffered_outputs |
Buffer output writes | false | true to absorb output spikes |
syscall_event_drops.actions |
What to do on drops | [log, alert] |
Keep alert — you want to know |
syscall_event_drops.rate / max_burst |
Throttle drop alerts | small | Avoid drop-alert storms |
metrics.enabled |
Expose internal metrics | false | true — you need drop/scap visibility |
base_syscalls.custom_set |
Restrict captured syscalls | full set | Narrow set to cut volume (advanced) |
An advanced but high-leverage technique: Falco can be told to capture only a subset of syscalls relevant to the loaded rules (base_syscalls), dramatically cutting event volume on hot nodes at the cost of narrowing what future rules can see. Use it when a specific node class is drop-prone and its workload’s syscall profile is well understood.
Resource sizing
Concrete starting points for the DaemonSet and the router, to be refined against your metrics:
# values.yaml — resource requests/limits (per Falco pod, i.e. per node)
resources:
  requests:
    cpu: 200m
    memory: 512Mi
  limits:
    cpu: "1"
    memory: 1Gi

falcosidekick:
  resources:
    requests: { cpu: 100m, memory: 128Mi }
    limits:   { cpu: 500m, memory: 256Mi }
| Component | CPU request/limit (starting) | Memory request/limit | Scales with |
|---|---|---|---|
| Falco pod (per node) | 200m / 1000m | 512Mi / 1Gi | Node syscall volume |
| Falcosidekick | 100m / 500m | 128Mi / 256Mi | Alert rate (not node count) |
| k8s-metacollector | 100m / 300m | 128Mi / 256Mi | Cluster object count/churn |
| Falcosidekick-UI + Redis | 100m / 300m | 128Mi / 512Mi | Retained event window |
Response actions with Falco Talon
Falco detects; Falco Talon responds. Talon is a dedicated response engine (a companion project) that receives Falco alerts (via Falcosidekick’s Talon output) and executes configured actions on the offending workload — terminate the pod, cordon the node, apply a Kubernetes NetworkPolicy to isolate the pod, add a quarantine label, capture a syscall trace for forensics, or call a webhook — gated by rules that match on the Falco rule name, priority, namespace, or tags. It turns “we detected an intrusion” into “we contained it in the same second,” for the narrow set of detections confident enough to automate.
When to automate response
The core judgement: automated response is powerful and dangerous, so it must be reserved for high-confidence, high-severity, low-false-positive detections. A decision table:
| Detection confidence | Blast radius of action | Automate? | Example |
|---|---|---|---|
| Very high (bespoke, tuned, critical) | Kill one pod (recreatable) | Yes | Payments egress to C2 → kill pod |
| Very high | Isolate pod (NetworkPolicy) | Yes | Reverse shell detected → cut network |
| High | Label for triage (no disruption) | Yes | Suspicious exec → quarantine=true label |
| Medium | Anything disruptive | No — page a human | Generic “sensitive file read” |
| Low / noisy | Any action | Never | Untuned “unexpected outbound” |
The guiding principle: automate the safe, reversible action on the confident, severe detection; page a human for everything else. Killing a stateless pod that a Deployment will recreate is safe; cordoning a node hosting stateful workloads is not — match the action’s blast radius to your certainty.
Talon actions and rules
Talon’s actions and their typical use:
| Talon action | What it does | Good for | Caution |
|---|---|---|---|
kubernetes:terminate |
Deletes the offending pod | Compromised stateless pod | Data-loss on stateful pods |
kubernetes:labelize |
Adds/updates a label | Triage/quarantine without disruption | Downstream must act on the label |
kubernetes:networkpolicy |
Applies an isolating NetworkPolicy | Cut a pod’s network to contain exfil | Needs a CNI that enforces policy |
kubernetes:cordon |
Cordons the node | Node-level compromise | Disrupts everything on the node |
kubernetes:exec |
Runs a command in the pod | Custom forensics/containment | Powerful — scope tightly |
kubernetes:download |
Pulls a file for forensics | Evidence capture | Storage + handling of evidence |
webhook |
Calls an external system | Ticketing, SOAR, EDR pivot | Depends on the endpoint |
A Talon rules file wiring two safe automations — isolate on a reverse shell, kill on payments-egress-to-C2:
# talon-rules.yaml — match Falco alerts, run a scoped action
- action: Isolate suspicious pod
  actionner: kubernetes:networkpolicy
  parameters:
    allow_cidr: []           # deny all egress/ingress except explicitly allowed
- action: Terminate on payments exfil
  actionner: kubernetes:terminate
  parameters:
    grace_period_seconds: 5

- rule: Contain reverse shell
  match:
    rules: ["Reverse shell", "Terminal shell in container"]
    priority: critical
    tags: [mitre_execution]
  actions:
    - Isolate suspicious pod
- rule: Kill payments exfil
  match:
    rules: ["Payments pod egress to public IP"]
    priority: critical
  actions:
    - Terminate on payments exfil
And the Falcosidekick side that forwards criticals to Talon:
# values.yaml — route critical alerts to Talon for response
falcosidekick:
  config:
    talon:
      address: "http://falco-talon.falco:2803"
      minimumpriority: "critical"     # only criticals ever trigger automation
The delivery chain becomes Falco (detect) → Falcosidekick (route) → Talon (respond), with the same per-sink priority discipline ensuring only high-confidence criticals ever reach the action layer. Talon needs its own RBAC (a ServiceAccount permitted to delete pods, create NetworkPolicies, label, cordon) — grant it exactly those verbs and no more, because a response engine with broad cluster write is itself a juicy target.
Architecture at a glance
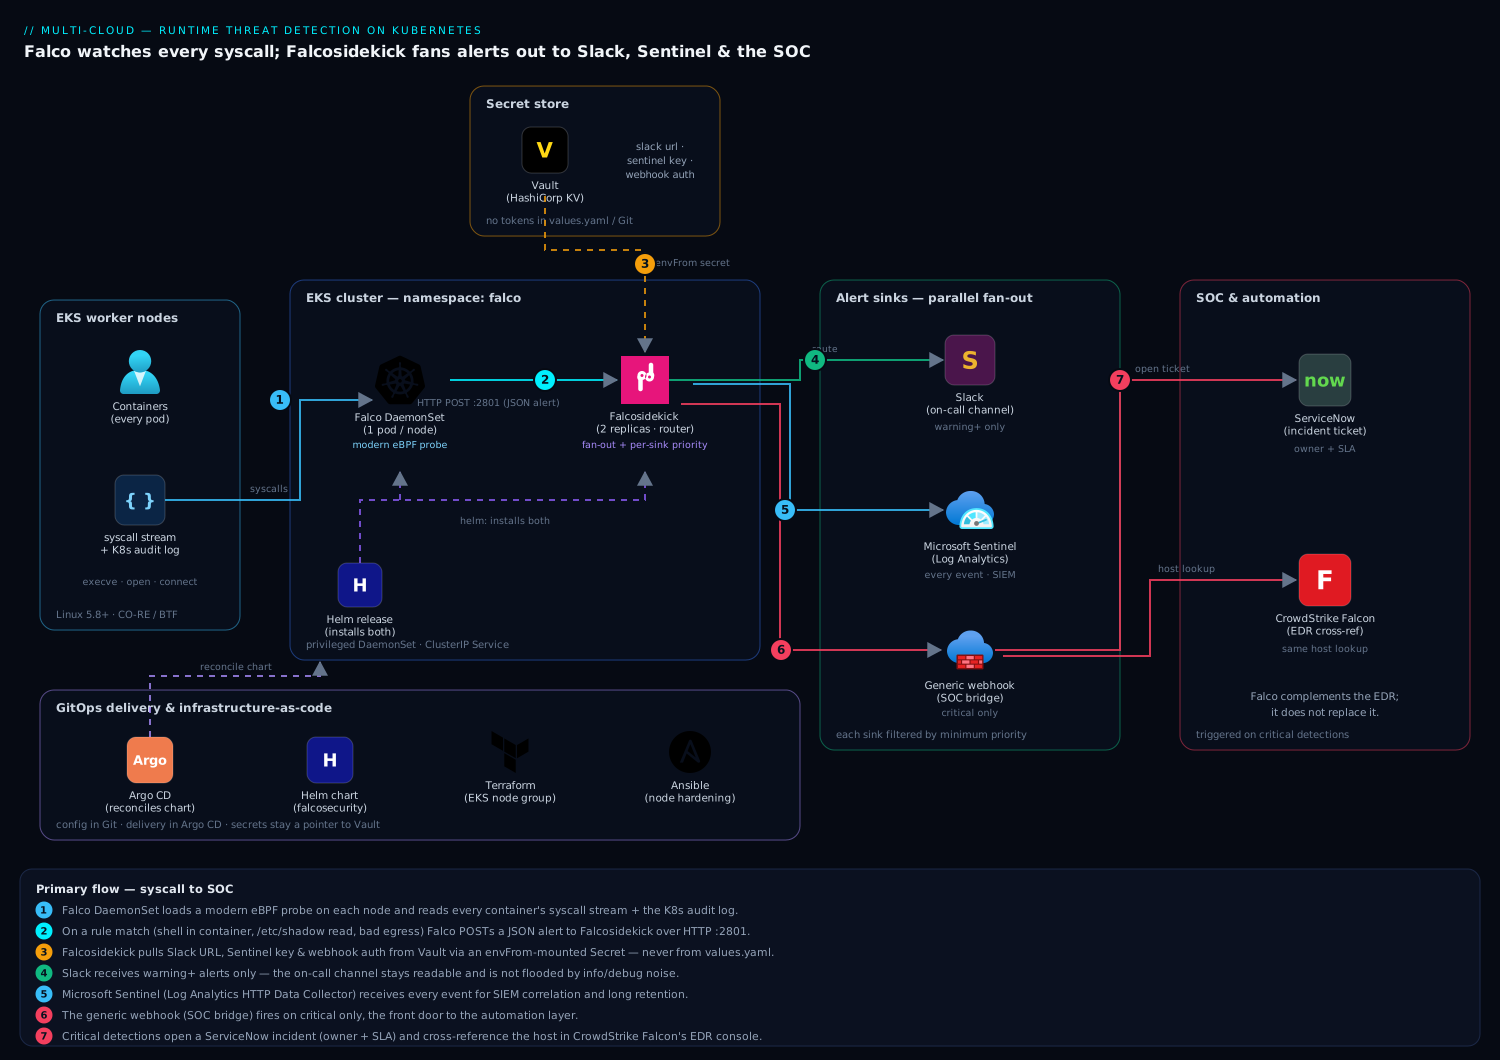
The topology is deliberately simple, which is the point of a runtime sensor: it must be cheap enough to run on every node. Falco runs as a privileged DaemonSet — one pod per worker node, each loading a modern eBPF probe into the kernel and subscribing to the syscall stream for every container on that node, plus (optionally) the Kubernetes audit log as a second event source through the k8saudit plugin. Alongside, an in-cluster k8s-metacollector watches the API server once and pushes pod metadata to every Falco pod, so alerts carry k8s.pod.name/k8s.ns.name without each node hammering the API. When a syscall sequence matches a rule — a shell spawned in a container, a read of /etc/shadow, an outbound connect to a non-allowlisted IP, a write below a read-only path — Falco emits a structured JSON alert.
Those alerts do not go to stdout and die. Each Falco pod is configured with an HTTP output pointing at Falcosidekick, a small stateless Deployment (2 replicas behind a ClusterIP Service) whose entire job is fan-out and routing. Falcosidekick receives every alert once and, based on priority and rule tags, forwards it in parallel to multiple sinks: Slack (formatted, gated to warning+), Alertmanager (error+, into the existing paging tree), Microsoft Sentinel (everything, for SIEM correlation and long retention), Falcosidekick-UI (everything, a live wall backed by Redis), and a generic webhook / Falco Talon (critical only, triggering automated containment and a ServiceNow ticket). Secrets for the sinks are pulled from a secret store into the Falcosidekick pod, never committed. Because delivery is Falco → Falcosidekick → sinks, adding or removing a destination is a Falcosidekick config change, not a fleet-wide Falco reconfiguration.
Read the diagram left to right: the node kernel feeds syscalls up through the modern eBPF probe into the Falco DaemonSet pod, which evaluates rules (enriched with pod metadata), and emits matched alerts over HTTP to the central Falcosidekick router, which fans them to the human, SIEM, UI, and response destinations — each filtered to its own priority floor.
Real-world scenario
Meridian Pay runs a card-processing platform on a 60-node EKS cluster (Amazon Linux 2023 nodes, kernel 6.1, EKS v1.29) across three availability zones in ap-south-1. The platform team is six engineers; the security team is three. Pre-deploy controls were mature — Harbor with Trivy gates in CI, Kyverno admission policies, Cilium network policies — but a red-team engagement produced the finding that changed priorities: a tester exploited an unpatched deserialization CVE in a payments microservice, got a shell in the pod, read the mounted service-account token, used it to list Secrets in the payments namespace, and staged a token for a mock exfil to an external IP. Time from initial exploit to the red team declaring “we own the namespace”: 11 minutes. Alerts generated by the existing stack: zero. Every control had done its job at deploy time and gone silent; nothing watched the running process.
The team deployed Falco with the modern eBPF driver (BTF present on AL2023, so no headers to manage), enrichment on, the k8saudit plugin fed from EKS control-plane audit logs, and Falcosidekick routing to Slack (warning+), their existing Alertmanager (error+), Microsoft Sentinel (everything), and — after two weeks of tuning — Falco Talon for two critical bespoke rules. The first week was noisy exactly as predicted: the default “Terminal shell in container” and “Contact K8s API server” rules fired hundreds of times a day from their CI runners and legitimately API-chatty services. Rather than mute, they ran the alert-distribution query, found the top five noisy rules accounted for ~95% of volume, and wrote scoped exceptions (CI image allowlist for shells, a trusted_namespaces macro for known API talkers). Volume to Slack dropped from ~600/day to ~15/day — all of them worth a look.
Then they encoded the red-team’s exact path as bespoke critical rules: (1) a read of the SA token in payments by a process that is not the app’s known main process → CRITICAL; (2) outbound connect from a payments pod to a non-RFC1918 IP → CRITICAL, wired to Talon’s kubernetes:networkpolicy isolate action. They re-ran the red-team scenario in staging. This time: the shell spawned → Slack alert in ~2 seconds; the token read → CRITICAL in Slack and Sentinel, and a ServiceNow incident opened via the webhook; the mock exfil connect → CRITICAL that Talon caught, and within ~1 second an isolating NetworkPolicy cut the pod’s egress, the exfil connection died, and the pod was labelled quarantine=true. The red team’s “11 minutes to own the namespace” became “isolated and ticketed in under 3 seconds from the first suspicious syscall.”
The numbers that justified the spend: Falco and Falcosidekick are open-source, so licensing was zero; node overhead measured at ~180m CPU / ~380Mi per Falco pod under their syscall volume (well within the 200m/512Mi requests); Sentinel ingestion for the tuned stream ran about ₹9,000/month (they briefly saw ₹40,000/month before tuning, driven almost entirely by the five noisy rules they later excepted — a vivid demonstration that untuned Falco is a cost problem as much as a noise problem). The lesson the security lead put on the wall: “Prevention decides what may run. Detection is the only thing that tells you what actually happened. We had all of the first and none of the second.”
The scenario as a before/after, because the delta is the whole argument:
| Dimension | Before Falco | After Falco (tuned) |
|---|---|---|
| Time to detect in-pod shell | Never (no signal) | ~2 seconds |
| Time to detect SA-token read | Never | ~2 seconds (CRITICAL) |
| Time to contain mock exfil | Never (manual, post-incident) | <3 seconds (Talon isolate) |
| Alerts on the red-team path | 0 | 3 (shell, token, egress) |
| Slack volume (untuned → tuned) | n/a | ~600/day → ~15/day |
| SIEM ingestion cost | n/a | ₹40k/mo → ₹9k/mo after tuning |
| Node overhead per sensor | n/a | ~180m CPU / ~380Mi |
Advantages and disadvantages
Runtime detection is a genuine capability with real costs; weigh it honestly rather than treating it as a checkbox.
| Advantages (why runtime detection helps) | Disadvantages (why it bites) |
|---|---|
| Sees the action itself (syscalls) — attackers can obfuscate binaries but must call the kernel | Detection, not prevention — it tells you fast, it does not stop the syscall by itself |
| Closes the post-deploy blind spot no pre-deploy control covers | Adds a privileged DaemonSet to every node — a large, sensitive attack surface to secure |
| Open-source (CNCF), transparent rules you can read/audit/write | Untuned, it floods the on-call within a day and the channel gets muted — the classic failure |
| One artifact (modern eBPF) runs across a heterogeneous fleet, no per-node build | Requires modern kernels/BTF for the best driver; old nodes force the legacy probe |
| Kubernetes-aware context (pod, namespace, labels) an EDR often lacks | Syscall drops under load are silent blind spots you must actively monitor |
| Fan-out routing (Falcosidekick) integrates with any SIEM/chat/pager | SIEM ingestion of every event is a real per-GB cost that must be tuned |
| Automated response (Talon) contains high-confidence intrusions in seconds | Automated response is dangerous if wired to noisy/low-confidence rules |
| Complements EDR/network policy rather than replacing them | Overlapping tools (Falco + EDR + Tetragon) can duplicate effort if not scoped |
Runtime detection is right for essentially any production Kubernetes cluster where “an attacker is inside a running container” is a threat you must see, and mandatory where compliance demands intrusion detection or file-integrity monitoring on containers. It is over-engineering only for throwaway dev clusters with no sensitive data. The disadvantages are all manageable — modern kernels remove the driver pain, disciplined tuning removes the noise and most of the cost, and conservative Talon rules remove the automation risk — but each requires the deliberate work this article lays out. The one non-negotiable: budget for the tuning. An untuned Falco is worse than none, because it teaches the on-call to ignore the sensor.
Hands-on lab
This is the centrepiece. You will stand up Falco + Falcosidekick + the UI on a throwaway cluster, confirm the eBPF driver actually loaded, wire a Slack sink (optional — the UI works with no external sink), trip a real detection, trace it from syscall to sink, add and tune a custom rule, and tear it all down. Everything is free-tier-friendly; a local kind or single-node k3s cluster is enough. Commands assume Bash.
Step 0 — Prerequisites and a cluster
You need kubectl, helm v3.12+, and a cluster on a modern kernel. A local kind cluster is simplest:
# Option A: kind (Docker required). kind nodes inherit the host kernel.
kind create cluster --name falco-lab

# Confirm the node kernel supports modern eBPF (BTF must exist)
docker exec falco-lab-control-plane ls -l /sys/kernel/btf/vmlinux \
  && echo "BTF present — modern_ebpf will load"

kubectl get nodes -o wide
Expected: one node Ready; the ls prints the vmlinux file (if it does not, your host kernel is older than 5.8 or has BTF stripped — the lab will fall back to the ebpf driver, noted in Step 3).
Step 1 — Create the namespace with the right Pod Security label
Falco needs a privileged DaemonSet, so its namespace must permit that under Pod Security Admission:
kubectl create namespace falco
kubectl label namespace falco \
  pod-security.kubernetes.io/enforce=privileged \
  security.kloudvin.io/component=runtime-sensor
Expected: namespace/falco created, then namespace/falco labeled. Without the privileged label, restricted-mode PSA blocks the DaemonSet and Falco pods never schedule.
Step 2 — Add the Helm repo and write values
Falco and Falcosidekick ship from one chart, so a single release installs both (plus the UI):
helm repo add falcosecurity https://falcosecurity.github.io/charts
helm repo update
helm search repo falcosecurity/falco --versions | head -5
Write the routing values (no secrets in this file). For the lab we send warning+ to Slack if you have a webhook, and everything to the UI:
cat > /tmp/falco-values.yaml <<'YAML'
driver:
  kind: modern_ebpf              # CO-RE eBPF; no kernel headers, no module build

collectors:
  kubernetes:
    enabled: true                # pod/namespace/label enrichment via k8s-metacollector

falco:
  json_output: true              # structured alerts — required for clean routing
  json_include_output_property: true
  priority: notice               # global floor; sinks filter further
  http_output:
    enabled: true
    url: "http://falco-falcosidekick:2801/"   # in-cluster Falcosidekick Service

falcosidekick:
  enabled: true
  replicaCount: 1                # 1 is fine for a lab; use 2+ in prod
  webui:
    enabled: true
    redis:
      enabled: true
  config:
    debug: false
    customfields: "cluster:falco-lab,env:lab"
    slack:
      minimumpriority: "warning"
      messageformat: "Falco *{{ .Rule }}* on `{{ .Hostname }}` ({{ .Priority }})"
YAML
If you have a Slack incoming-webhook URL, create the Secret and reference it; otherwise skip this and rely on the UI:
# OPTIONAL — only if you have a Slack webhook URL
kubectl -n falco create secret generic falcosidekick-secrets \
  --from-literal=SLACK_WEBHOOKURL="https://hooks.slack.com/services/XXX/YYY/ZZZ"

cat > /tmp/falco-secrets.yaml <<'YAML'
falcosidekick:
  extraEnvFrom:
    - secretRef:
        name: falcosidekick-secrets
YAML
Step 3 — Install and verify the DaemonSet landed
# Install Falco + Falcosidekick + UI. Add "-f /tmp/falco-secrets.yaml" if you made the Slack Secret.
helm install falco falcosecurity/falco \
  --namespace falco \
  -f /tmp/falco-values.yaml \
  --wait --timeout 5m

kubectl -n falco get daemonset,deploy,pods -o wide
kubectl -n falco rollout status daemonset/falco
Expected: falco pods equal to your node count (for kind, one), all Running; a falco-falcosidekick Deployment; a falco-falcosidekick-ui Deployment and its Redis; and a falco-k8s-metacollector. If a Falco pod is CrashLoopBackOff, jump to Common mistakes — it is almost always the driver.
Step 4 — Confirm the eBPF driver actually loaded
A Falco pod can be Running while the probe silently failed — then you have a sensor that sees nothing. Confirm the engine explicitly:
# Look for the driver/engine line and confirmation the syscall source is open
kubectl -n falco logs ds/falco -c falco | grep -iE "modern|ebpf|driver|engine|source|Starting" | head

# Version and the loaded event sources from inside the pod
kubectl -n falco exec ds/falco -c falco -- falco --version
Expected: a healthy modern-eBPF start prints lines like Loading rules from..., Starting health webserver, and confirmation that the modern bpf engine is the event source with the syscall source open. If instead you see BTF errors or a probe-load failure, re-run with --set driver.kind=ebpf (the legacy probe does not need BTF):
helm upgrade falco falcosecurity/falco -n falco --reuse-values --set driver.kind=ebpf
Step 5 — Open the UI (live event wall)
Port-forward the UI so you can watch detections arrive in real time:
kubectl -n falco port-forward svc/falco-falcosidekick-ui 2802:2802 >/tmp/ui-pf.log 2>&1 &
echo "Open http://localhost:2802  (default UI login is admin/admin — change in prod)"
Expected: the Falcosidekick-UI dashboard loads at http://localhost:2802, initially with few or no events. Leave it open for the next step.
Step 6 — Deploy a target pod and trip a detection
Run an innocuous pod to be the “victim,” then trip the canonical detection — a shell spawned inside a running container reading a sensitive file:
kubectl create deployment victim --image=nginx --replicas=1
kubectl rollout status deployment/victim

# THE DETECTION: exec a shell into the running pod and read a sensitive file
TARGET=$(kubectl get pod -l app=victim -o jsonpath='{.items[0].metadata.name}')
kubectl exec -it "$TARGET" -- /bin/sh -c "cat /etc/shadow; id; uname -a"
Within a second or two Falco sees the execve of the shell and the open of /etc/shadow and emits alerts.
Step 7 — Trace the alert from syscall to sink
Prove the whole chain end to end:
# 1) Falco saw the syscall — the alert is in the node pod's log
kubectl -n falco logs ds/falco -c falco | grep -iE "shell in a container|sensitive file" | tail -3

# 2) Falcosidekick received and routed it
kubectl -n falco logs deploy/falco-falcosidekick | tail -10

# 3) Per-output delivery counters prove routing (non-zero sends)
kubectl -n falco exec deploy/falco-falcosidekick -- \
  wget -qO- http://localhost:2801/metrics | grep falcosidekick_outputs_total
Expected: the Falco log shows a JSON alert for “Terminal shell in container” (and likely “Read sensitive file untrusted”) naming the victim pod; Falcosidekick’s log shows it received the event; the metrics show a non-zero counter for the webui output (and slack if you wired it). In the UI (http://localhost:2802) the events appear live with pod, namespace, priority, and rule. If you wired Slack, a formatted message lands in your channel. Seeing the same event in the log, the router metrics, and the UI is the proof that detection and routing are correct.
Step 8 — Add and tune a custom rule
Add a bespoke rule and an exception, then confirm the tuning takes effect. Create a custom-rules values fragment:
cat > /tmp/falco-custom-rules.yaml <<'YAML'
customRules:
  lab-rules.yaml: |-
    - list: trusted_debug_images
      items: [registry.kloudvin.io/sre/debug]

    # Silence "Terminal shell" ONLY for our debug image (exception, not disable)
    - rule: Terminal shell in container
      exceptions:
        - name: sre_debug
          fields: [container.image.repository]
          comps: [in]
          values:
            - [trusted_debug_images]

    # Bespoke: a package manager running at runtime is drift → WARNING
    - rule: Package manager launched in container
      desc: apt/yum/apk running at runtime — images should be immutable
      condition: >
        spawned_process and container
        and proc.name in (apt, apt-get, yum, dnf, apk)
      output: >
        Package management in a running container
        (proc=%proc.cmdline image=%container.image.repository pod=%k8s.pod.name ns=%k8s.ns.name)
      priority: WARNING
      tags: [process, drift, mitre_execution]
YAML

helm upgrade falco falcosecurity/falco -n falco --reuse-values -f /tmp/falco-custom-rules.yaml
kubectl -n falco rollout status daemonset/falco
Now trip the new rule and confirm it fires:
# Trigger the bespoke "Package manager launched in container" rule
kubectl exec -it "$TARGET" -- /bin/sh -c "apt-get --version || apk --version"

kubectl -n falco logs ds/falco -c falco | grep -i "Package management in a running container" | tail -1
Expected: a new alert for “Package management in a running container” naming the victim pod — proof your custom rule loaded and matched. The exception on “Terminal shell” would now suppress that rule only for the registry.kloudvin.io/sre/debug image, while still firing for any other image (as it did in Step 6).
Step 9 — Validation checklist
| Step | What you did | What it proves |
|---|---|---|
| 3 | Installed the chart, DaemonSet landed | Falco runs one sensor per node |
| 4 | Confirmed the modern-eBPF engine loaded | The probe is actually attached (not silently failed) |
| 5–6 | Deployed a victim, exec’d a shell | The canonical detection path works |
| 7 | Traced log → router metrics → UI | Detection and routing are wired correctly |
| 8 | Added a custom rule + exception, re-tripped | You can extend and tune the ruleset upgrade-safely |
Step 10 — Teardown
Falco’s footprint is a single Helm release; removal is clean and complete (the eBPF probe detaches when the pod stops — nothing persists in the kernel):
# Stop the port-forward
kill %1 2>/dev/null || true

# Remove the release, the app, the secret, and the namespace
helm uninstall falco --namespace falco
kubectl delete deployment victim --ignore-not-found
kubectl -n falco delete secret falcosidekick-secrets --ignore-not-found
kubectl delete namespace falco

# If you used kind, delete the whole cluster
kind delete cluster --name falco-lab
Expected: the release uninstalls, the namespace terminates, and (for kind) the cluster is gone. No kernel state remains. Cost note: the entire lab runs locally on kind at zero cloud cost; on a managed cluster it is a single DaemonSet for the duration — pennies.
Common mistakes & troubleshooting
The failure modes you will actually hit, as a scannable playbook first, then the confirm-and-fix detail for the ones that bite hardest.
| # | Symptom | Root cause | Confirm (exact cmd) | Fix |
|---|---|---|---|---|
| 1 | Falco pod CrashLoopBackOff on start |
Driver can’t load — modern_ebpf on a node with no BTF | kubectl -n falco logs ds/falco -c falco shows BTF/probe error; ls /sys/kernel/btf/vmlinux missing |
Use supported AMI, or --set driver.kind=ebpf |
| 2 | Pod Running but zero alerts ever |
Probe silently failed to attach, or wrong driver | kubectl -n falco logs ds/falco -c falco | grep -i engine — no “modern bpf” line |
Re-verify driver; check kernel; try ebpf |
| 3 | Alerts in Falco log but never reach a sink | Falcosidekick not receiving | Check falco.http_output.url = http://falco-falcosidekick:2801/ (slash + port); falco.json_output: true |
Fix URL/port; ensure JSON output on |
| 4 | Slack floods; channel becomes unreadable | slack.minimumpriority empty/too low |
kubectl -n falco get cm falco-falcosidekick -o yaml | grep -A2 slack |
Set to warning/error; firehose to SIEM only |
| 5 | Chart upgrade wiped my tuning | Edited shipped rules in place | Your changes gone after helm upgrade |
Use customRules + exceptions/override; never fork |
| 6 | Privileged DaemonSet won’t schedule | Namespace not labelled privileged (PSA) | kubectl get ns falco -o jsonpath='{.metadata.labels}' no enforce=privileged |
Label the namespace privileged (Step 1) |
| 7 | k8s.pod.name empty in alerts |
Metadata enrichment off / metacollector down | kubectl -n falco get pods | grep metacollector; collectors.kubernetes.enabled |
Enable enrichment; check metacollector logs |
| 8 | No k8s_audit events despite the plugin |
API server not forwarding the audit log | Falco log has no k8s_audit source events |
Configure API-server audit webhook/backend to Falco |
| 9 | Rising syscall event drops in logs |
Node syscall volume exceeds ring buffer/CPU | kubectl -n falco logs ds/falco -c falco | grep -i drop |
Larger syscall_buf_size_preset; raise CPU; buffered_outputs |
| 10 | Sentinel/SIEM table stays empty | Bad shared key or node clock skew >15 min | Falcosidekick falcosidekick_outputs_total{...status="error"} for the sink |
Re-pull key from secret store; NTP-sync nodes; allow 5–10 min lag |
| 11 | Talon takes no action on criticals | Falcosidekick talon output/priority misconfigured, or Talon RBAC |
Check falcosidekick.config.talon.address/minimumpriority; Talon logs forbidden |
Fix address/floor; grant Talon SA the needed verbs |
| 12 | A rule never fires though behaviour occurs | Condition missing evt.dir/evt.type anchor, or needs a plugin field |
Test rule against a capture (-e capture.scap -M) |
Anchor evt.type; add evt.dir = < for network/exit fields |
| 13 | Falco CPU pinned on a specific node | Chatty workload (build agent, heavy I/O) | kubectl top pod -n falco; that node’s Falco at limit |
Raise CPU limit; narrow base_syscalls; except noisy rules |
| 14 | UI shows nothing / login fails | UI Redis down, or port-forward to wrong svc | kubectl -n falco get pods | grep ui; forward svc/...-ui:2802 |
Restart UI/Redis; default login admin/admin (change it) |
The expanded reasoning for the entries that cost the most incident time:
1. Falco pod CrashLoops on the driver. The number-one issue. With driver.kind: modern_ebpf the node kernel needs CO-RE/BTF; very old or hardened kernels (pre-5.8, BTF stripped) lack it. Confirm: kubectl -n falco logs ds/falco -c falco shows a BPF probe/BTF load error, and ls /sys/kernel/btf/vmlinux on the node returns “No such file.” Fix: move to a supported AMI (Amazon Linux 2023, Bottlerocket, Ubuntu 22.04+), or fall back to the legacy probe with --set driver.kind=ebpf. Avoid kmod on managed nodes — it needs headers you usually don’t control.
2. Pod Running but zero alerts. The insidious one: a sensor that sees nothing looks healthy. Confirm: the Falco log lacks the “modern bpf” engine/source-open line; falco --list-events inside the pod is empty or errors. Fix: the driver didn’t truly attach — verify the kernel and driver kind, and watch for a subtle mismatch where modern_ebpf half-loaded. This is why Step 4 of the lab exists: never trust Running as proof of coverage.
3. Alerts fire in Falco but never reach a sink. Falcosidekick isn’t receiving them. Confirm: the Falco log has alerts but Falcosidekick’s log is quiet. Fix: falco.http_output.url must exactly match the Falcosidekick Service DNS — http://falco-falcosidekick:2801/ — the trailing slash and port both matter, and falco.json_output: true must be set because Falcosidekick expects JSON.
5. Chart upgrade wiped my tuning. You edited shipped rules in place instead of using customRules with exceptions/override. Fix: all tuning lives in your own customRules file that appends to or overrides shipped rules; never fork the vendor ruleset. This single habit is the difference between a maintainable Falco and one you dread upgrading.
9. Syscall drops. A dropped syscall is a missed detection, so this is a security bug wearing a performance costume. Confirm: grep -i drop in the Falco log shows a rising n_drops. Fix: enlarge the per-CPU ring buffer (syscall_buf_size_preset), raise Falco’s CPU limit, enable buffered_outputs, prune expensive/low-value rules, and consider narrowing base_syscalls on the hot node class. Keep syscall_event_drops.actions including alert so drops page you rather than passing silently.
10. SIEM table stays empty. The Log Analytics Data Collector API drops silently on a bad shared key or node clock skew > 15 minutes. Confirm: Falcosidekick’s falcosidekick_outputs_total{destination="azuresentinel",status="error"} is non-zero. Fix: re-pull AZURESENTINEL_SHAREDKEY from your secret store, ensure nodes are NTP-synced, and allow 5–10 minutes for first ingestion (the API batches).
Best practices
- Default to the modern eBPF driver; verify BTF before you deploy. It is one artifact for the whole fleet with no per-node build. Only fall back to the legacy
ebpfprobe on genuinely old/BTF-less kernels, and avoidkmodon managed clusters. - Never edit shipped rules in place. All tuning goes in your own
customRulesfile viaexceptions,override, or new rules, sohelm upgradepicks up new detections without clobbering your work. - Tune from the alert distribution, not intuition. Rank what actually fires over 24h, except the legitimate top offenders (scoped to image/namespace/process), and re-measure. Do this before you route anything to humans.
- Set per-sink minimum priorities deliberately. SIEM and the UI take everything; Slack gets
warning+; Alertmanagererror+; automation/pagingcriticalonly. The SIEM drinks the firehose so humans don’t have to. - Enable Kubernetes metadata enrichment always. An alert without
k8s.pod.name/k8s.ns.nameis far harder to action; the metacollector makes enrichment cheap and API-safe. - Feed the k8s audit plugin wherever you can. Control-plane abuse (privileged pod, exec/attach, RBAC changes) is invisible to syscall rules and is exactly what post-exploitation looks like.
- Monitor syscall drops as a security signal. Keep
metrics.enabledon, alert on drops, and size the ring buffer/CPU so hot nodes don’t develop blind spots. - Reserve automated response for high-confidence, reversible actions. Talon should isolate/kill stateless pods on tuned critical bespoke rules; page a human for anything medium-confidence or disruptive.
- Keep all sink credentials out of Git. Slack token, SIEM key, webhook auth live in a secret store synced to a Secret and mounted via
envFrom; the routing values (safe) live in Git for GitOps. - Deliver via GitOps in production. Commit routing values to the platform repo and let Argo CD reconcile the release; don’t
helm installby hand where Argo will fight you. - Add MITRE tags to custom rules. Technique IDs enable ATT&CK-based routing, hunting, and coverage mapping across your detections.
- Lock down Falco itself. It runs privileged by necessity — restrict who can
execinto thefalconamespace via RBAC, and forward Falco’s own health/delivery logs to the SIEM so tampering with the sensor is itself an alert. - Layer, don’t duplicate blindly. Falco complements EDR and network policy; if you also run Tetragon or a commercial runtime tool, scope each to what it does best rather than running three overlapping rulesets.
Security notes
Falco is a detection control — the runtime tripwire — and its own security posture matters because it is privileged on every node.
- The DaemonSet is a high-value target. Falco runs privileged with host PID and eBPF capabilities; an attacker who compromises it can blind the sensor. Restrict
exec/pods/execin thefalconamespace via RBAC to a tiny group, and treat any unexpected access to it as an incident. Forward Falco’s own audit/health logs to the SIEM so a tampering attempt is itself detectable. - Least-privilege for Falcosidekick and Talon. Falcosidekick needs only its sink credentials (from a secret store, never inline). Talon needs a ServiceAccount permitted to exactly the verbs its actions use (
delete pods,create networkpolicies,patch podsfor labels,patch nodesfor cordon) — nothing more; a response engine with broad cluster write is itself dangerous. - Secrets never in
values.yaml. The routing values live in Git; the Slack token, SIEM shared key, and webhook auth header come from Vault/External Secrets into a Secret mounted viaenvFrom. A leaked SIEM key is an exfil channel; a leaked Slack webhook is a spoofing/DoS vector. - Detection complements EDR and network policy. On these nodes CrowdStrike Falcon (or similar) does host-level prevention and its own behavioural detection; Falco adds Kubernetes-aware, container-context syscall visibility a VM-oriented EDR doesn’t natively express. The webhook path lets a Falco
criticalcross-reference the same host in the EDR console — the two are layered, not competing. - Protect the audit stream. If you feed the k8s audit log to Falco over a webhook, secure that channel (mTLS or an in-cluster-only address); the audit log reveals your control-plane activity and is sensitive.
- Secure the UI. Falcosidekick-UI shows every detection (a map of your security posture and where you are weak). Never expose it publicly; put it behind ingress + SSO and change the default credentials. The lab’s
admin/adminport-forward is for the lab only. - Route criticals to a ticket with an owner. A
criticaldetection should open a ServiceNow (or equivalent) incident automatically via the webhook, so a real intrusion produces a ticket with an owner and an SLA — not a Slack message that scrolls away. This closes the loop from detection to accountable response.
The security controls that also make Falco itself resilient — secure and reliable pull together here:
| Control | Mechanism | Secures against | Also prevents |
|---|---|---|---|
RBAC on falco namespace exec |
Kubernetes RBAC | Attacker blinding the sensor | Accidental sensor disruption |
| Least-privilege Talon SA | Scoped ServiceAccount | Response engine abused for cluster write | Over-broad automated actions |
Secrets from a store via envFrom |
External Secrets / Vault | Leaked SIEM key / Slack token in Git | Rotation breaking the sink |
| SIEM forwarding of Falco’s own logs | Falcosidekick → SIEM | Silent sensor tampering | Missed delivery failures |
| mTLS on the audit webhook | TLS + client cert | Audit-log interception/spoofing | Malformed-input crashes |
| UI behind SSO + ingress | Auth proxy | Public exposure of the posture map | Default-credential access |
Cost & sizing
Falco and Falcosidekick are open-source (CNCF), so licensing is zero — the real cost is node overhead and SIEM ingestion, and the second one surprises teams.
- Node overhead is small but non-trivial because it is per node. Budget roughly 150–250m CPU and 256–512Mi for the Falco pod under normal syscall volume, set
resources.requests/limitsaccordingly, and watch chatty nodes (build agents, heavy file I/O) that spike Falco CPU or cause drops. On a 60-node cluster that is ~9–15 vCPU and ~15–30 GiB spread across the fleet — real, but a fraction of what the workloads use. - SIEM ingestion is the line item that surprises. Sending every event to Sentinel/Splunk/Elastic is correct for correlation and hunting, but you pay per GB. The Meridian scenario’s ₹40k→₹9k/month swing came entirely from tuning five noisy rules — untuned Falco is a cost problem as much as a noise one. Use Falco’s global
priorityfloor (notice) and Falcosidekick’s per-sinkminimumpriorityto keepdebug/infochatter out of the SIEM while capturingnoticeand above. - The practical routing split for cost: Slack at
warning+ (low volume, free), SIEM atnotice+ (moderate, metered — the main cost dial), the automation webhook/Talon atcriticalonly (tiny, but each may open a ticket or trigger an action). Tune the rules before you tune the budget — most SIEM cost on an untuned Falco is noise from a handful of chatty rules you should have excepted anyway.
The cost drivers and how to control each:
| Cost driver | What you pay for | Rough scale | How to control |
|---|---|---|---|
| Falco node overhead | CPU/memory per Falco pod | ~150–250m CPU, 256–512Mi × nodes | Right-size requests; narrow base_syscalls on hot nodes |
| Falcosidekick + UI | Small central Deployment(s) + Redis | ~0.2–0.5 vCPU total | Scales with alert rate, not node count |
| SIEM ingestion | Per-GB event ingestion | The dominant variable cost | Tune rules; minimumpriority; global floor notice |
| Metacollector | Cluster metadata watching | ~0.1–0.3 vCPU | Scales with object churn |
| Talon actions | Negligible compute | tiny | N/A |
| Ticketing (per critical) | ServiceNow incident volume | small | Keep webhook at critical only |
Sizing rules of thumb, and what each buys:
| If you have… | Do this | Because |
|---|---|---|
| A chatty node class that drops syscalls | Larger ring buffer + higher CPU limit there | Drops are missed detections |
| A high SIEM bill | Raise minimumpriority to notice; except top noisy rules |
Ingestion is the main variable cost |
| A large fleet (100+ nodes) | Keep enrichment via metacollector (not per-node API polls) | Avoids API-server load |
| Bursty alert volume | buffered_outputs: true on Falco |
Absorbs spikes without dropping |
| Only need it in one namespace’s blast radius | Still run fleet-wide, scope rules to the namespace | The sensor must be everywhere; the rules focus |
Interview & exam questions
1. What does Falco actually observe, and why does that make it hard to evade? Falco subscribes to the kernel’s system-call stream via an in-kernel driver. An attacker can obfuscate binaries and encode payloads, but to act (open a file, spawn a process, make a connection) they must call the kernel, and the syscall arguments are ground truth. This is why runtime detection sees the action itself rather than a log the attacker could suppress.
2. Compare Falco’s three drivers. The kernel module (kmod) is a loadable .ko with full access but needs matching headers and can panic the node — discouraged on managed clusters. The legacy eBPF probe (ebpf) is verifier-sandboxed (safe) but historically compiled per-kernel. Modern eBPF (modern_ebpf) is a single CO-RE object embedded in the binary that relocates against the kernel’s BTF at load — no headers, no per-node build, needs kernel ~5.8+. All three capture the same syscalls, so the choice is operational, not about detection quality; default to modern eBPF.
3. How do you tune a noisy Falco rule without breaking chart upgrades? Never edit the shipped rule in place. Instead, in your own customRules file, attach a structured exceptions block (named allowlists over fields like container.image.repository and proc.name), or use override with explicit replace/append semantics to change condition/priority, or set enabled: false to disable a rule cleanly. Because these add to the shipped rules, helm upgrade picks up new detections without clobbering your tuning.
4. What is the difference between Falco’s metadata enrichment and its k8s audit plugin? Metadata enrichment resolves a container ID to Kubernetes context (k8s.pod.name, k8s.ns.name, labels) so syscall alerts are legible — it does not add new events. The k8saudit plugin is a separate event source that consumes the Kubernetes API-server audit log, detecting control-plane abuse (privileged pod creation, exec/attach, RBAC changes) that never produces a node syscall. Enrichment makes existing alerts richer; the audit plugin adds a whole new category.
5. Explain Falco priorities and how they interact with Falcosidekick. Rules carry a priority from an eight-rung ladder (EMERGENCY…DEBUG). Falco has a global priority floor (rules below it aren’t emitted), and Falcosidekick applies an independent minimumpriority per sink. So priority is both severity and routing key: set the global floor low so the SIEM sees everything worth keeping, and let each human/automation sink filter up — Slack at warning+, paging/automation at critical only.
6. Why is an untuned Falco worse than no Falco? Untuned, high-noise default rules (shells, API contact, generic egress) fire hundreds of times a day on legitimate behaviour; the on-call mutes the channel, and a muted sensor detects nothing. It also inflates SIEM ingestion cost dramatically. The failure mode is social and financial, not technical — which is why budgeting for tuning is non-negotiable.
7. What is a syscall drop and why is it a security problem? When syscalls arrive faster than Falco can consume them, the kernel ring buffer overflows and events are dropped — and the dropped event might be the one you cared about, so a drop is a missed detection, not just a metric. Confirm via Falco’s drop counters/logs; mitigate with a larger ring buffer, more CPU, buffered outputs, fewer/cheaper rules, or a narrowed base_syscalls set. Keep drop alerting on.
8. When should Falco Talon take automated action, and when not? Automate only high-confidence, high-severity, reversible actions — isolating (NetworkPolicy) or killing a stateless pod on a tuned critical bespoke rule. Page a human for medium-confidence detections and for disruptive actions (cordoning a node with stateful workloads). Match the action’s blast radius to your certainty; a noisy rule wired to a destructive action is an outage generator.
9. A Falco pod is Running but you never see alerts. What’s happening and how do you confirm? The probe likely failed to attach silently (wrong driver for the kernel, or modern_ebpf on a BTF-less node). Confirm by checking the Falco log for the engine/source-open line (grep -i "modern bpf") and that falco --list-events inside the pod returns events. Fix by verifying the kernel/driver and, if BTF is absent, falling back to the legacy ebpf driver. Never treat Running as proof of coverage.
10. How does Falco complement (not replace) an EDR like CrowdStrike Falcon and a CNI network policy? Network policy governs allowed connections (and the compromised app rides the allowed path); an EDR does host-level prevention but often lacks native pod/namespace context. Falco adds Kubernetes-aware, container-context syscall visibility with transparent, writable rules, detecting the behaviour after a control was bypassed. They layer: prevention (policy/admission), host prevention+detection (EDR), and container-aware detection+response (Falco/Talon).
11. What must be true about a custom Falco network rule for fd.sip to be populated? Network-address fields like fd.sip/fd.sport are only populated on the exit direction of the syscall, so the condition must include evt.dir = < (and anchor evt.type in (connect)), plus an fd.sip exists guard to avoid null-field false matches. Omitting evt.dir is the classic reason a network rule “never fires.”
12. Why does the topology put fan-out in Falcosidekick rather than in Falco? Separating detection (per-node, must stay cheap and simple) from routing (central, absorbs all integration complexity) means adding/removing a destination is a Falcosidekick config change, not a fleet-wide Falco reconfiguration. The expensive part runs once per node; the cheap part runs centrally and holds no state, so it scales and is easy to change.
These map to the Certified Kubernetes Security Specialist (CKS) — runtime security, behavioural analytics, Falco, syscall/seccomp/audit — and to cloud security certs where runtime detection and SIEM integration appear. A compact mapping:
| Question theme | Primary cert | Objective area |
|---|---|---|
| Falco drivers, syscalls, runtime detection | CKS | Runtime security / monitoring |
| Rules, macros, exceptions, tuning | CKS | Behavioural analytics with Falco |
| K8s audit logging as a source | CKS | Cluster hardening / audit |
| Routing to SIEM, hunting | Cloud security (e.g. AZ-500 / SC-200) | Detection & response, SIEM |
| Automated response / containment | Advanced security ops | Incident response automation |
Quick check
- You’re deploying Falco on Amazon Linux 2023 nodes (kernel 6.1). Which driver do you pick, and what single file do you check first to confirm it will load?
- A default rule (“Terminal shell in container”) fires hundreds of times a day from your CI runners. What is the right fix, and what is the wrong one?
- Your custom rule for outbound connections to a bad IP never fires even though the connection happens. Name the two condition elements most likely missing.
- What is the difference between Falco’s metadata enrichment and the k8s audit plugin, in one sentence each?
- You send
criticalalerts to Falco Talon to auto-terminate pods. On which kind of pod is that safe, and on which is it dangerous?
Answers
- Pick
modern_ebpf— AL2023 kernels have BTF, so the CO-RE probe loads with no headers or per-node build. Check/sys/kernel/btf/vmlinuxexists on the node first; if it does, modern eBPF will attach. - The right fix is a scoped
exceptionsblock (allowlisting the CI image/process on that rule) in your owncustomRulesfile, so the rule still fires for untrusted images. The wrong fixes are disabling the rule entirely, editing the shipped rule in place (clobbered on upgrade), or muting the Slack channel. - Most likely missing: an
evt.dir = <(network-address fields likefd.sipare only populated on the exit direction) and a specificevt.type in (connect)anchor (plus anfd.sip existsguard). Unanchored/enter-direction conditions are the classic “never fires” cause. - Metadata enrichment resolves a container ID to Kubernetes context (
k8s.pod.name,k8s.ns.name, labels) so syscall alerts are legible — it adds no new events. The k8s audit plugin is a separate event source consuming the API-server audit log, detecting control-plane abuse (privileged pods, exec/attach, RBAC changes) that produces no node syscall. - Safe on a stateless pod a Deployment will recreate (killing it just triggers a reschedule). Dangerous on a stateful pod (data loss) or when the action is node-level (cordoning disrupts everything on the node). Match the action’s blast radius to your detection confidence, and reserve automation for tuned
criticalrules.
Glossary
- Falco — the CNCF runtime security project that reads kernel syscalls (and other sources via plugins), evaluates them against rules, and emits structured alerts on suspicious behaviour.
- Driver — the in-kernel code that feeds syscalls to Falco: kernel module (
kmod), legacy eBPF probe (ebpf), or modern eBPF (modern_ebpf). - Modern eBPF (CO-RE) — a single Compile-Once-Run-Everywhere eBPF object embedded in Falco that relocates against the kernel’s BTF at load; needs no headers, no per-node build, kernel ~5.8+. The recommended driver.
- BTF (BPF Type Format) — kernel type information (at
/sys/kernel/btf/vmlinux) that CO-RE eBPF uses to relocate field offsets; required by the modern eBPF driver. - Syscall (system call) — the boundary where a process asks the kernel to do something privileged (
execve,open,connect,setns,write); the ground truth Falco observes. - Rule — a named Falco object with a
condition, templatedoutput,priority, andtags; the unit of detection. - Macro — a named, reusable condition fragment referenced inside rule conditions to keep them readable and tunable.
- List — a named set of values used with the
in (...)operator (e.g.shell_binaries). - Condition — the boolean expression over event fields (
evt.*,proc.*,fd.*,container.*,k8s.*) that decides whether a rule fires. - Priority — a rule’s severity on an eight-rung ladder (
EMERGENCY…DEBUG); doubles as a routing key via minimum-priority filters. - Exception /
override— structured, upgrade-safe mechanisms to allowlist or modify shipped rules without editing them in place. - Plugin — a loadable Falco extension providing a new event source (e.g.
k8saudit) or field extraction (e.g.json,k8smeta), managed viafalcoctl. - Metadata enrichment — resolving container IDs to Kubernetes pod/namespace/label context (via the
k8smetaplugin +k8s-metacollector) so alerts carryk8s.*fields. - k8s audit plugin (
k8saudit) — a plugin that consumes the Kubernetes API-server audit log as a separate event source, detecting control-plane abuse. - Falcosidekick — a stateless service that receives Falco’s single alert stream and fans it out, filtered per sink, to Slack/Alertmanager/SIEM/UI/webhook/Talon.
- Falcosidekick-UI — a web dashboard (backed by Redis) showing a live, filterable stream of recent Falco alerts.
- Falco Talon — a response engine that acts on Falco alerts — terminate, isolate (NetworkPolicy), label, cordon, or webhook — gated by match rules.
- Syscall drop — an event Falco could not consume in time (ring-buffer overflow); a dropped event is a missed detection.
falcoctl— the Falco companion CLI/controller that installs and updates rulesfiles and plugins from OCI artifacts.- DaemonSet — the Kubernetes object that runs one Falco pod per node, giving per-node syscall coverage.
Next steps
You can now stand up Falco + Falcosidekick, pick the right driver, write and tune rules, enrich with Kubernetes context, route intelligently, size for drops, and wire automated response. Build outward:
- Layer the EDR: Deploy the CrowdStrike Falcon Sensor on Linux & Kubernetes as a DaemonSet and CrowdStrike Falcon Runtime Protection for EKS & Fargate — the host-level prevention Falco complements.
- Add network context: Cilium Hubble Network-Flow Observability & Service Map — the eBPF network view that pairs with Falco’s syscall view.
- Route it well: Alertmanager Routing Trees, Inhibition & Deduplication and Integrate PagerDuty Event Orchestration with Alertmanager & Runbooks — where Falco criticals join your paging plane.
- Hunt over the retained events: KQL Threat Hunting with MITRE ATT&CK & UEBA Notebooks — turn the SIEM stream into proactive hunts.
- Close the supply chain around it: Deploy Harbor Registry on Kubernetes with Trivy Scanning, Replication & Signing and Software Supply Chain: SBOM Consumption, VEX & Admission Verification — the pre-deploy layers Falco backstops.
- Get the secrets right: Set Up the External Secrets Operator with Vault & AWS Secrets on Kubernetes — so the Slack/SIEM/webhook credentials are never in Git.