In a nutshell
Imagine a parcel that crosses three carriers on its way to you: an airline, a long-haul truck, and a local courier. Each carrier scans the same tracking number at every hand-off and adds a timestamped event. The tracking website then stitches all those scans into one timeline, so you can see the parcel sat in a warehouse for nine hours even though no single carrier would ever tell you that. Distributed tracing is that tracking number for a web request. As one request fans out across API Gateway, a Lambda, and a handful of services on your EKS cluster, each hop records what it did and how long it took, all tagged with the same trace ID — and X-Ray assembles them into one picture called the service map.
Here is the twist this lesson is really about. AWS’s tracking website — X-Ray — only understands its own barcode format, called a segment. Your applications, by modern convention, emit a different, open format called OpenTelemetry (OTLP). So on EKS you do not ship OpenTelemetry straight to X-Ray. You run a small translator in the middle — the ADOT Collector (AWS Distro for OpenTelemetry) — which takes OTLP in and converts each span into an X-Ray segment on the way out. Get the translation, the credentials, and the trace-header propagation right and one request draws one connected map; get any single piece wrong and you get a map with holes, orphaned traces, or a sampling bill that surprises you.
Level: Advanced · Time: ~32 min
Before you start, it helps to know:
- Basic Kubernetes on EKS — pods, Deployments, DaemonSets, ConfigMaps, ServiceAccounts.
- How IAM roles and policies grant permissions — see IAM fundamentals; on EKS the role is attached to a pod via IRSA or Pod Identity.
- Where metrics and logs already live on AWS — the CloudWatch and CloudTrail deep dive. Tracing is the third pillar next to those two.
- That Lambda and API Gateway can trace themselves once you flip on “Active Tracing” — you do not instrument those edges by hand.
After this lesson you will be able to:
- Explain the X-Ray data model (segment, subsegment, trace, service map) and how it maps onto OpenTelemetry spans.
- Deploy the ADOT Collector as a DaemonSet on EKS, wire OTLP in and the
awsxrayexporter out, and bind it to an IAM role with IRSA. - Make one request draw one connected trace across ALB, API Gateway, Lambda, and EKS by propagating the
X-Amzn-Trace-Idheader. - Write centralized sampling rules (reservoir + fixed rate) that keep the traces that matter without blowing your budget.
- Triage from the service map to the exact failing traces using annotations, filter expressions, and trace groups.
- Correlate a trace with its logs and metrics in CloudWatch, and decide when to reach for Application Signals or Transaction Search instead.
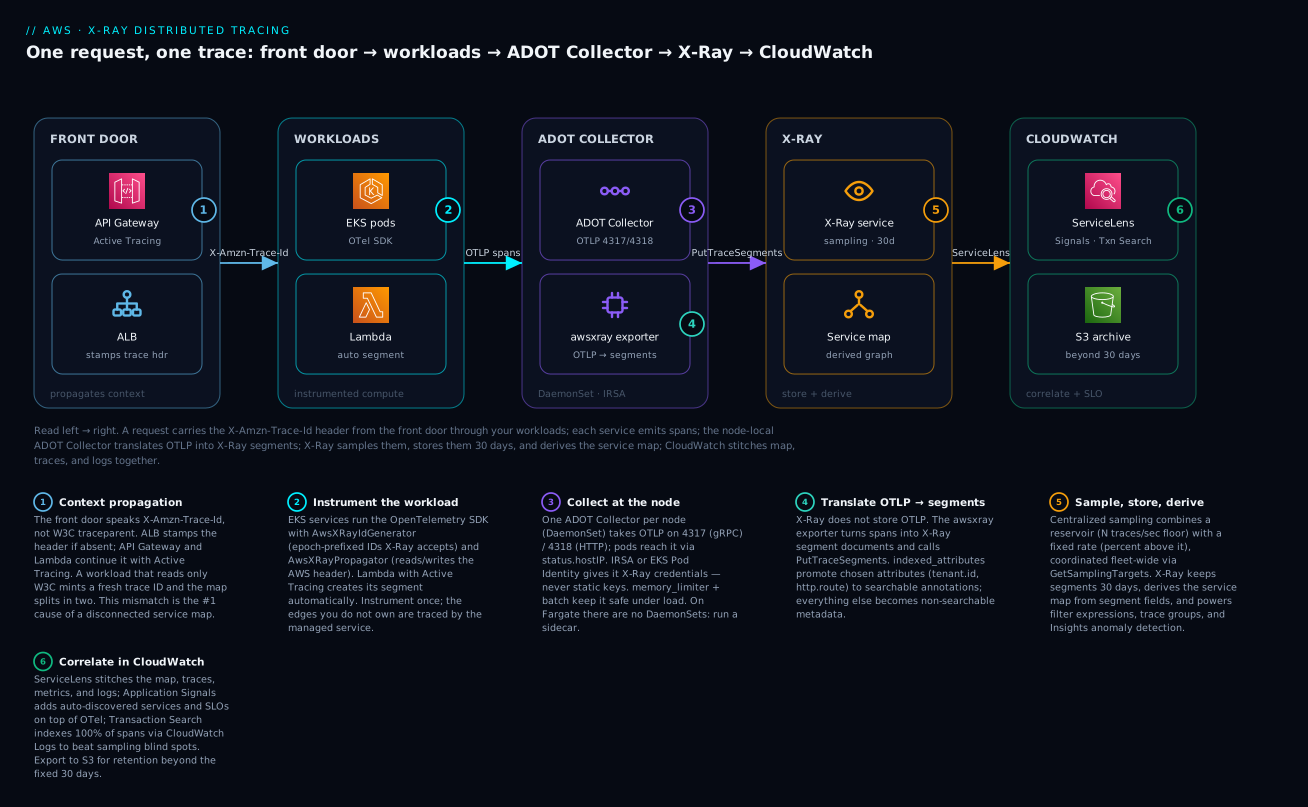
The diagram traces one request left to right: the front door propagates the X-Amzn-Trace-Id header into your instrumented workloads, each service emits OTLP spans to the node-local ADOT Collector, the awsxray exporter translates them into segments and calls PutTraceSegments, X-Ray samples and stores them for 30 days while deriving the service map, and CloudWatch (ServiceLens, Application Signals, Transaction Search) stitches the map, traces, and logs into one view.
Why tracing, and why it is the odd pillar out
Observability is usually taught as three pillars: metrics (how much / how fast, aggregated), logs (what happened, per event), and traces (the path of one request across services). Metrics tell you the checkout p99 latency doubled at 10:30. Logs tell you this one request threw a NullPointerException. Only a trace answers the question that actually ends the incident: for this slow request, which of the seven services it touched was the slow one, and what did it call? On a monolith you did not need traces — a single stack trace told the whole story. The moment a request crosses a network boundary, the stack trace stops at the boundary and the trace picks up where it left off.
The reason tracing feels harder to adopt than metrics or logs is that it demands agreement across services. A metric is emitted by one service in isolation. A trace only exists if every service on the path agrees to (a) carry the same trace ID forward in a header both sides understand, and (b) report its slice to the same backend. Most “my tracing doesn’t work” problems are one of those two agreements quietly broken — which is exactly why this lesson spends so much time on header propagation and on the Collector that unifies the reporting.
The pipeline in one breath
Before the detailed sections, hold this shape in your head — every later section is one box in this chain:
- Propagate. The front door (ALB / API Gateway / Lambda) puts a trace ID into the
X-Amzn-Trace-Idheader and passes it along. - Instrument. Each of your services reads that header, opens its own segment/span, records downstream calls as subsegments, and passes the header onward.
- Collect. Your EKS services send spans as OTLP to a node-local ADOT Collector instead of talking to X-Ray directly.
- Translate + export. The Collector’s
awsxrayexporter converts spans into X-Ray segments and writes them withPutTraceSegments. - Sample. Centralized rules decide which traces are actually kept, coordinated across the whole fleet so you neither miss the rare error nor pay for every heartbeat.
- Read. X-Ray derives the service map and lets you filter to specific traces; CloudWatch correlates those traces with logs and metrics and raises SLO alarms.
Everything below is a deeper look at one of those six boxes. Keep the chain in view and no single section can get lost.
X-Ray is the only tracing backend on AWS that the managed services themselves understand. ALB stamps a trace header, API Gateway continues it, Lambda creates a segment automatically, and the X-Ray service map draws the whole call graph without you instrumenting the edges. The catch is that X-Ray speaks its own segment document format, not OTLP — so on EKS you do not point your OpenTelemetry SDKs at X-Ray directly. You run the AWS Distro for OpenTelemetry (ADOT) Collector, take OTLP in, and let the awsxray exporter translate spans into segments. Get the IAM, the sampling, and the header propagation right and you get one service graph spanning Lambda, API Gateway, and your EKS workloads; get any one wrong and you get orphaned segments, blown sampling budgets, or a map with holes where the managed services should be.
1. X-Ray’s data model: segments, subsegments, traces, and the service graph
X-Ray does not store OpenTelemetry spans. It stores segments. A segment is the work a single service did for one request — roughly an OTel server span plus everything local to that service. Inside it, subsegments record downstream calls: an outbound HTTP request, a DynamoDB query, an SQS publish. An OTel client span maps to a subsegment.
A trace is the set of all segments and subsegments that share one trace ID, and here is the first hard constraint: X-Ray trace IDs are not W3C trace IDs. An X-Ray trace ID has a fixed format — 1-{8 hex of epoch seconds}-{24 hex random} — for example 1-67c0a1f2-5e1b2a3c4d5e6f7081920a3b. The first segment’s start time is literally encoded in the ID, which is why X-Ray can shard and expire traces cheaply. The awsxray exporter and the AWS X-Ray ID generator reformat between the 32-hex W3C ID and this layout so the epoch-second prefix is preserved.
The service graph (the service map) is derived, not stored separately. X-Ray reads segment fields — name, origin, namespace, error/fault/throttle flags, subsegment name and namespace=aws — and aggregates them into nodes and edges with rolled-up latency and error statistics. You do not draw the map; you emit correctly shaped segments and the map falls out.
| Concept | X-Ray term | OpenTelemetry equivalent |
|---|---|---|
| Work done by one service | Segment | SERVER/CONSUMER span (root of a service’s local tree) |
| A downstream call within that service | Subsegment | CLIENT/PRODUCER span |
| Whole request across services | Trace | Trace (set of spans sharing trace ID) |
| Searchable key-value (indexed) | Annotation | Span attribute promoted via indexed_attributes |
| Non-searchable key-value | Metadata | Span attribute (not indexed) |
| Aggregated call graph | Service map / service graph | Derived from spans server-side |
The annotation-versus-metadata split is load-bearing for triage. Annotations are indexed and filterable in the console and via filter expressions (annotation.tenant = "acme"). Metadata is attached to the trace but not indexed — readable on a trace you already found, but not searchable. The exporter only promotes the attributes you name to annotations, so choose them deliberately (section 6).
2. Deploying the ADOT Collector on EKS
The ADOT Collector is AWS’s supported, security-patched build of the upstream OpenTelemetry Collector with the AWS components (awsxray, awsemf, awsxrayreceiver) compiled in, from the public ECR repo public.ecr.aws/aws-observability/aws-otel-collector. Two deployment shapes exist; the choice is about where the receiver lives.
- DaemonSet (gateway-per-node). One Collector per node; pods send OTLP to the node-local Collector over the host IP. Fewer Collectors, efficient batching, the right default for EKS at scale. This is what we build here.
- Sidecar. One Collector container per pod — strong isolation and per-workload config, but multiplies Collector count and overhead. Reserve it for workloads with bespoke pipelines.
First, the receiver pipeline. Take OTLP on the standard ports and export to X-Ray:
# adot-collector-config (ConfigMap data)
receivers:
  otlp:
    protocols:
      grpc:
        endpoint: 0.0.0.0:4317
      http:
        endpoint: 0.0.0.0:4318

processors:
  batch/traces:
    timeout: 1s
    send_batch_size: 50          # X-Ray PutTraceSegments takes batches; keep them modest
  memory_limiter:
    check_interval: 1s
    limit_percentage: 75
    spike_limit_percentage: 20

exporters:
  awsxray:
    region: eu-west-1
    indexed_attributes:          # which span attributes become searchable annotations
      - tenant.id
      - http.route
      - deployment.environment

service:
  pipelines:
    traces:
      receivers: [otlp]
      processors: [memory_limiter, batch/traces]
      exporters: [awsxray]
  telemetry:
    metrics:
      level: detailed
      address: 0.0.0.0:8888
The DaemonSet exposes the OTLP ports on the host so pods can reach their node-local Collector via the Kubernetes Downward API (status.hostIP):
apiVersion: apps/v1
kind: DaemonSet
metadata:
  name: adot-collector
  namespace: observability
spec:
  selector:
    matchLabels: { app: adot-collector }
  template:
    metadata:
      labels: { app: adot-collector }
    spec:
      serviceAccountName: adot-collector   # IRSA-bound, see section 3
      containers:
        - name: aws-otel-collector
          image: public.ecr.aws/aws-observability/aws-otel-collector:v0.43.0
          args: ["--config=/conf/otel-config.yaml"]
          ports:
            - { name: otlp-grpc, containerPort: 4317, hostPort: 4317 }
            - { name: otlp-http, containerPort: 4318, hostPort: 4318 }
          resources:
            requests: { cpu: 200m, memory: 256Mi }
            limits:   { cpu: "1",  memory: 512Mi }
          volumeMounts:
            - { name: config, mountPath: /conf }
      volumes:
        - name: config
          configMap:
            name: adot-collector-config
            items: [{ key: otel-config.yaml, path: otel-config.yaml }]
Applications point their OTLP exporter at the node IP, injected as an env var:
# in the application Deployment's pod spec
env:
  - name: HOST_IP
    valueFrom:
      fieldRef: { fieldPath: status.hostIP }
  - name: OTEL_EXPORTER_OTLP_ENDPOINT
    value: "http://$(HOST_IP):4318"
3. OTLP-to-X-Ray export, IAM permissions, and the awsxray exporter
The awsxray exporter calls the X-Ray API directly, so it needs credentials, and on EKS the correct mechanism is IRSA (IAM Roles for Service Accounts) or EKS Pod Identity — never long-lived keys in the pod. The Collector’s service account is bound to an IAM role granting exactly the X-Ray write and sampling-read actions. The managed policy AWSXRayDaemonWriteAccess is the standard grant; the underlying actions are worth seeing explicitly so you know what the exporter actually exercises:
{
  "Version": "2012-10-17",
  "Statement": [
    {
      "Effect": "Allow",
      "Action": [
        "xray:PutTraceSegments",
        "xray:PutTelemetryRecords",
        "xray:GetSamplingRules",
        "xray:GetSamplingTargets",
        "xray:GetSamplingStatisticSummaries"
      ],
      "Resource": "*"
    }
  ]
}
PutTraceSegments is the write path — every batch of translated segments goes through it. The three Sampling* actions let the Collector pull centralized sampling rules from X-Ray (section 4); omit them and the Collector silently falls back to its local rule. X-Ray API actions do not support resource-level scoping, so Resource: "*" is expected — scope access through the role trust policy and the IRSA binding instead.
Bind the role to the service account with IRSA (eksctl does the OIDC plumbing in one command):
eksctl create iamserviceaccount \
  --cluster my-eks \
  --namespace observability \
  --name adot-collector \
  --attach-policy-arn arn:aws:iam::aws:policy/AWSXRayDaemonWriteAccess \
  --approve --region eu-west-1
A subtle but critical detail: the awsxray exporter expects the spans it receives to carry an X-Ray-compatible trace ID. If your SDK mints standard random W3C IDs whose first 4 bytes are not a valid recent epoch timestamp, X-Ray rejects the segment because the trace ID’s time prefix sits in the distant past. The fix is the AWS X-Ray ID generator in your SDK, so root trace IDs carry the correct epoch prefix:
# Python SDK: use the X-Ray ID generator + propagator so IDs are X-Ray-shaped
from opentelemetry.sdk.trace import TracerProvider
from opentelemetry.sdk.extension.aws.trace import AwsXRayIdGenerator
from opentelemetry.propagate import set_global_textmap
from opentelemetry.propagators.aws import AwsXRayPropagator

provider = TracerProvider(id_generator=AwsXRayIdGenerator())
set_global_textmap(AwsXRayPropagator())
The AwsXRayPropagator reads and writes the X-Amzn-Trace-Id header — the format ALB, API Gateway, and Lambda all speak — so your EKS services stitch into segments those managed services started. Without it your services emit W3C traceparent only, the AWS edges propagate X-Amzn-Trace-Id, the two never join, and the map shows your mesh disconnected from the front door.
4. Centralized sampling rules and reservoir/fixed-rate configuration
X-Ray sampling is not a single percentage. Each rule combines a reservoir — a fixed number of traces kept per second, a sample floor even at low traffic — with a fixed rate, a percentage of everything above the reservoir. The reservoir guarantees you always have some traces from a quiet endpoint; the fixed rate scales sampling with volume on a busy one.
Define rules centrally so every Collector and SDK in the account shares one policy. That is the point of the GetSamplingRules/GetSamplingTargets API: the Collector polls X-Ray, the service hands each Collector its slice of the reservoir, and the budget is coordinated across the fleet instead of each instance keeping its own reservoir locally.
# Terraform: a default rule plus a high-priority rule for the checkout route
resource "aws_xray_sampling_rule" "default" {
  rule_name      = "Default"
  priority       = 10000          # highest number = lowest precedence
  reservoir_size = 1              # 1 trace/sec floor
  fixed_rate     = 0.05           # then 5% of the rest
  host           = "*"
  http_method    = "*"
  url_path       = "*"
  service_name   = "*"
  service_type   = "*"
  resource_arn   = "*"
  version        = 1
}

resource "aws_xray_sampling_rule" "checkout" {
  rule_name      = "checkout-high-fidelity"
  priority       = 100            # lower number = evaluated first
  reservoir_size = 5              # always keep 5 checkout traces/sec
  fixed_rate     = 0.20           # plus 20% above the reservoir
  host           = "*"
  http_method    = "POST"
  url_path       = "/checkout*"
  service_name   = "*"
  service_type   = "*"
  resource_arn   = "*"
  version        = 1
}
Rules are evaluated by priority ascending — the lowest priority number that matches wins, so put specific high-fidelity rules at low numbers and the catch-all Default at the maximum. Tell the Collector to use centralized (remote) sampling rather than its local rule:
# in the application SDK environment, or the Collector if it samples
env:
  - name: OTEL_TRACES_SAMPLER
    value: xray                   # delegate to X-Ray centralized rules
The reservoir is per-rule and per-second, coordinated by the service across all reporters. With a reservoir of 5 and three Collectors, X-Ray allocates the 5/sec budget across the three so the aggregate floor is 5, not 15. This is exactly why the
GetSamplingTargetsIAM action matters: without it, each Collector keeps its own local reservoir and you over-sample by the number of reporters.
5. Propagating X-Ray trace headers across ALB, API Gateway, and Lambda
The managed services use X-Amzn-Trace-Id, not W3C traceparent. The header looks like:
X-Amzn-Trace-Id: Root=1-67c0a1f2-5e1b2a3c4d5e6f7081920a3b;Parent=53995c3f42cd8ad8;Sampled=1
Root is the X-Ray trace ID, Parent is the upstream segment/subsegment ID, and Sampled is the decision bit (0, 1, or absent meaning “decide downstream”). Each AWS edge handles it differently, and the behaviour tells you where the trace starts:
- ALB. With X-Ray enabled, the ALB injects
X-Amzn-Trace-Idif absent and propagates it if present. It does not appear as a segment, but it sets the root ID your first service inherits. - API Gateway. Enable Active Tracing on the stage. API Gateway then creates its own segment (it shows up as a service-map node) and passes the trace context to the integration — Lambda, an HTTP backend, or a VPC link to your EKS ALB.
- Lambda. With Active Tracing on the function, Lambda creates the function’s segment automatically and exposes the header to your code via the
_X_AMZN_TRACE_IDenvironment variable. In-function instrumentation adds subsegments under it.
Enabling the edges is a one-liner each:
# API Gateway stage: turn on Active Tracing (emits an API Gateway segment)
aws apigateway update-stage \
  --rest-api-id abc123 --stage-name prod \
  --patch-operations op=replace,path=/tracingEnabled,value=true

# Lambda: turn on Active Tracing (Lambda creates the function segment)
aws lambda update-function-configuration \
  --function-name checkout-handler \
  --tracing-config Mode=Active
What ties it together on EKS is the AwsXRayPropagator from section 3. When a request flows API Gateway -> EKS service, API Gateway sends X-Amzn-Trace-Id; the propagator extracts Root as the trace ID and Parent as the parent span, so your service’s segment attaches under the API Gateway node. Configure only W3C propagation and that extraction never happens — you get two disconnected traces for one request, the classic “the map shows API Gateway, then nothing” symptom.
6. Reading the service map, annotations, and trace groups for triage
The service map is the triage entrypoint. Each node is a service (or an AWS resource like a DynamoDB table); each edge carries a response-time distribution and counts of OK / error (4xx) / fault (5xx) / throttle (429). A node ringed in red is signalling faults, and the ring fill encodes the error-class proportions, so you see at a glance whether a node is throwing 5xx or being throttled.
To go from “this edge is red” to “these traces,” you filter. X-Ray filter expressions query the indexed fields:
service("checkout-api") AND fault = true
annotation.tenant = "acme" AND responsetime > 2
http.url CONTAINS "/v2/orders" AND error = true
This is where the indexed_attributes from section 2 pay off — only those attributes are searchable as annotation.<key>. A common principal-level move is to promote tenant.id so you can answer “show me the failing traces for this one customer” during an incident, which metadata cannot do.
Trace groups persist a filter expression as a named, monitored group. X-Ray continuously evaluates it, emits CloudWatch metrics for its matching trace volume and fault rate, and lets you alarm on them. Create a group for the flows that matter:
aws xray create-group \
  --group-name checkout-faults \
  --filter-expression 'service("checkout-api") AND fault = true'
Once the group exists, you can pin its sub-map in the console and CloudWatch publishes ApproximateTraceCount, ErrorRate, FaultRate, and ThrottleRate dimensioned by GroupName — turning an ad hoc filter into an SLO signal you can alert on.
7. Correlating X-Ray traces with CloudWatch Logs and metrics
A trace tells you where a request slowed; the logs from that exact span tell you why. The link is the trace ID, and the discipline is to emit it in structured logs in a field X-Ray and CloudWatch both recognise. Emit the X-Ray-format trace ID (with the 1- prefix) as a field named AWS.XRayTraceId; CloudWatch Logs Insights and the X-Ray console both use it to jump from a trace to its logs and back:
{
  "timestamp": "2026-06-08T10:32:11Z",
  "level": "error",
  "msg": "inventory reserve failed",
  "tenant.id": "acme",
  "AWS.XRayTraceId": "1-67c0a1f2-5e1b2a3c4d5e6f7081920a3b"
}
With that field present, pivot from an incident trace to every log line for the same request:
fields @timestamp, level, msg, `tenant.id`
| filter `AWS.XRayTraceId` = "1-67c0a1f2-5e1b2a3c4d5e6f7081920a3b"
| sort @timestamp asc
For metrics, X-Ray’s derived series (latency percentiles and fault rate per node, plus the trace-group metrics from section 6) live in CloudWatch dimensioned by service or group. So you build one dashboard showing service-graph fault rate, trace-group fault count, and the application’s RED metrics side by side — three pillars correlated by service name and trace ID, which is the whole point of doing this on AWS rather than bolting on a separate stack.
8. Cost controls and trace retention strategy
X-Ray pricing has two meters: traces recorded (segments and subsegments written via PutTraceSegments) and traces retrieved/scanned (segments read by the console, filter queries, and GetTraceSummaries). The dominant control on the write side is sampling — so the reservoir-plus-fixed-rate rules in section 4 are not just a fidelity dial, they are your primary cost lever. Drop the Default fixed rate from 5% to 1% and you cut recorded-trace cost on the noisy majority by 5x; keep the checkout reservoir high so the flows that matter stay fully visible.
Retention is fixed. X-Ray traces are retained for 30 days, with no configurable period — you cannot pay to keep them longer or shorten it to save money. So if you need trace data beyond 30 days (audit, capacity planning, regression baselines), export it. Two patterns:
- Periodic export via the API. A scheduled job calls
GetTraceSummariesto find traces of interest andBatchGetTracesto pull the full segment documents, then writes them to S3 under a lifecycle policy — keeping only the long-term traces you actually need, cheaply. - OTLP fan-out at the Collector. The data already flows through ADOT, so add a second exporter and a copy of every sampled trace lands in a backend whose retention you control. The X-Ray copy stays the 30-day operational view; the durable copy is yours.
# fan out: X-Ray for operations, a second backend for long-term retention
exporters:
  awsxray:
    region: eu-west-1
  otlp/longterm:
    endpoint: traces-archive.internal:4317

service:
  pipelines:
    traces:
      receivers: [otlp]
      processors: [memory_limiter, batch/traces]
      exporters: [awsxray, otlp/longterm]
The governance point: sampling controls recorded cost, uncontrolled console querying controls retrieved cost. A team that scripts GetTraceSummaries polls every few seconds across a wide window can run up the retrieval meter as fast as ingestion — so budget both, and prefer trace groups (server-side metrics) over repeated broad scans.
Enterprise scenario
A retail platform team ran checkout on EKS behind API Gateway, with two Lambda functions for payment callbacks. Active Tracing was on for API Gateway and both Lambdas, the EKS services were instrumented with the OpenTelemetry SDK, and an ADOT DaemonSet ran the awsxray exporter. The service map showed API Gateway and the two Lambdas as a clean connected graph — and a completely separate disconnected cluster for the EKS services. One request was producing two traces. During a payment incident, the on-call could see the API Gateway node throwing faults but could not follow the trace into the EKS service that actually failed: the trace ended at the gateway.
The constraint was that the front door (ALB, API Gateway, Lambda) speaks X-Amzn-Trace-Id, but the EKS services had only the default W3C TraceContext propagator. The gateway’s Root trace ID was never extracted, so each EKS service minted a fresh trace ID. Root cause and fix were one line each — the propagator:
# EKS services: extract X-Amzn-Trace-Id so segments attach under the API Gateway node
from opentelemetry.propagate import set_global_textmap
from opentelemetry.propagators.aws import AwsXRayPropagator
from opentelemetry.sdk.extension.aws.trace import AwsXRayIdGenerator
from opentelemetry.sdk.trace import TracerProvider

set_global_textmap(AwsXRayPropagator())
provider = TracerProvider(id_generator=AwsXRayIdGenerator())
After the change, the map collapsed into one connected graph — API Gateway -> EKS checkout-api -> payment Lambda — with the EKS segments parented under the gateway. They also promoted tenant.id to indexed_attributes so triage could filter annotation.tenant = "acme" AND fault = true and pull only the affected customer’s broken traces. The runbook line: on AWS, a disconnected service map is almost never a sampling problem — it is a propagator mismatch between X-Amzn-Trace-Id and W3C, and the only proof it is fixed is seeing the edge actually drawn between the managed service and your workload.
Going deeper
Three ways to get spans into X-Ray — and why AWS now steers you to OpenTelemetry
There is more than one road from your code to a segment, and knowing which you are on explains a lot of otherwise-baffling behaviour.
| Path | What runs | Wire format | Status today |
|---|---|---|---|
| X-Ray SDK + X-Ray daemon | The language-specific X-Ray SDK instruments your code; the daemon buffers segments and calls PutTraceSegments |
X-Ray segments over UDP :2000 to the daemon | Supported but maintenance mode; not the direction for new work |
| OTel SDK + ADOT Collector | OpenTelemetry SDK (or auto-instrumentation) emits OTLP; the ADOT Collector awsxray exporter translates |
OTLP (gRPC 4317 / HTTP 4318) to the Collector | Recommended for new services — this lesson’s path |
| Managed active tracing | The service instruments itself (Lambda, API Gateway) — no code from you | Service writes segments directly | Always on once you flip the switch; composes with either path above |
The strategic message from AWS is explicit: OpenTelemetry is the go-forward instrumentation, and the X-Ray SDKs are in maintenance. ADOT is AWS’s supported, security-patched build of the upstream Collector with the AWS exporters compiled in. You get the vendor-neutral SDK (so the same instrumentation can also feed Prometheus, or a third-party APM, or a long-term store) while awsxray keeps the native X-Ray service map working. The awsxrayreceiver closes the loop the other way: it accepts the old daemon’s UDP segment format, so a Collector can stand in for the daemon during a migration and you retire the daemon without touching the legacy SDK code yet.
How centralized sampling actually works under the hood
Section 4 said the reservoir is coordinated fleet-wide. The mechanism is worth seeing because it explains the IAM actions and a cold-start quirk.
Each reporter (SDK or Collector) that samples locally does three things on a loop:
- On startup it has no allocation yet, so it is allowed to borrow — take 1 trace/second from each rule’s reservoir — until the service answers. This is why a freshly-deployed pod already produces a few traces before any rules “load”.
- It periodically calls
GetSamplingRulesto learn the current rules (priority, reservoir, fixed rate, matchers). - Every ~10 seconds it calls
GetSamplingTargets, reporting how many requests it saw and sampled. X-Ray does the fleet-wide math and hands each reporter its share of the reservoir plus an adjusted rate. Three Collectors under a reservoir of 5 each get roughly 5/3, so the aggregate floor is 5, not 15.
That server round-trip is the whole reason xray:GetSamplingTargets and xray:GetSamplingStatisticSummaries are in the IAM policy. Drop them and every reporter silently falls back to keeping its own local reservoir — you over-sample by the number of reporters and wonder why the bill scales with pod count.
One more wrinkle on EKS: if you set OTEL_TRACES_SAMPLER=xray in your application (so the SDK, not the Collector, makes the X-Ray-aware decision), the SDK needs to reach the X-Ray sampling API — but you do not want to give every app pod X-Ray credentials. The Collector solves this with the awsproxy extension, which listens locally (default :2000) and forwards the sampling calls using the Collector’s own IRSA role:
extensions:
  awsproxy:
    endpoint: 0.0.0.0:2000   # SDKs point their X-Ray remote sampler here
service:
  extensions: [awsproxy]
  pipelines:
    traces:
      receivers: [otlp]
      processors: [memory_limiter, batch/traces]
      exporters: [awsxray]
Then the app’s sampler URL points at the node-local Collector (http://$(HOST_IP):2000), and only the Collector’s service account holds the Sampling* permissions. Credentials stay in one place.
Propagate both header formats, not one
Section 5 framed it as “X-Ray header vs W3C” — but in a mixed estate you often need both, because some callers are AWS-managed (X-Amzn-Trace-Id) and some are third parties or newer services speaking W3C traceparent. Configure a composite propagator so each service reads and writes whichever header arrives:
# app pod env — honour AWS, W3C, and baggage headers on the way in and out
OTEL_PROPAGATORS=xray,tracecontext,baggage
With the composite set, a request that enters from API Gateway (X-Amzn-Trace-Id) and one that enters from a partner’s W3C-instrumented gateway both attach to the correct parent, and your service emits both headers downstream. The failure mode the Enterprise scenario describes — a split map — is simply this list reduced to tracecontext only, so the AWS Root ID is never read.
EKS realities: IRSA vs Pod Identity, and the Fargate exception
IRSA (the OIDC-based binding eksctl set up in section 3) has been the standard for years, but it carries per-cluster OIDC-provider plumbing and a trust policy that names the cluster’s issuer. EKS Pod Identity (GA since late 2023) is the newer, simpler mechanism: install the eks-pod-identity-agent add-on once, then create a plain association between a namespace/service-account and a role — no OIDC provider, and the same role can be reused across clusters.
# newer alternative to the eksctl IRSA command in section 3
aws eks create-pod-identity-association \
  --cluster-name my-eks \
  --namespace observability \
  --service-account adot-collector \
  --role-arn arn:aws:iam::123456789012:role/adot-collector-xray \
  --region eu-west-1
The trap that catches teams: EKS on Fargate has no DaemonSets. Fargate gives each pod its own micro-VM, so there is no “node” to run one Collector-per-node on. On Fargate you must run the Collector as a sidecar container inside each pod and point the app at localhost:4318. That is the one case where the sidecar shape in section 2 is not a preference but a requirement. A cluster that mixes managed-node-group and Fargate pods needs both shapes — DaemonSet for the nodes, sidecar for the Fargate pods.
What Lambda’s active tracing actually produces
Turning on Active Tracing for a Lambda does more than “make a segment”. The Lambda service emits two nodes on the map: the Lambda service segment (the invoke, including any queueing/throttling) and the function segment (your code running). A cold start shows up as an Initialization subsegment inside the function segment — which is how you see cold-start cost in a trace rather than guessing at it. The runtime also exposes the trace context in the _X_AMZN_TRACE_ID environment variable, and if you instrument the AWS SDK inside the function, every downstream dynamodb/s3/sns call becomes a subsegment automatically. The cost is a small per-invocation charge for the recorded trace, and — the operational catch — Active Tracing samples at the Lambda service level using X-Ray’s own rules, so a function behind a very high fixed-rate rule can still generate a large recorded-trace volume.
The newer CloudWatch layer: ServiceLens, Application Signals, Transaction Search
X-Ray’s own console is no longer the only front end for this data. AWS has been folding tracing into CloudWatch as a full APM experience, and for new work you should know which tool answers which question:
| Layer | What it gives you | When to reach for it |
|---|---|---|
| X-Ray service map / console | The raw map, filter expressions, trace timelines | Deep single-trace triage; the mechanics this lesson builds |
| CloudWatch ServiceLens | The map plus correlated metrics, logs, and traces in one pane | Jumping from a latency spike straight to the traces and logs behind it |
| CloudWatch Application Signals | Auto-discovered services with standard latency/error/volume metrics and SLOs with error-budget burn | Running SLOs on services without hand-building dashboards; APM for teams |
| Transaction Search | 100% of spans stored in CloudWatch Logs and searchable — no sampling blind spot | “Find the one trace for this order ID” when sampling would have dropped it |
Application Signals is the significant shift. It is built on OpenTelemetry, auto-instruments common runtimes (Java, Python, Node.js, .NET) via the CloudWatch agent or ADOT auto-instrumentation, and gives you application-level golden signals plus first-class SLOs — define an objective on an operation (say, “checkout p99 < 300 ms, 99.9% of the time”) and it tracks the error budget and can alarm on burn rate. It correlates every signal back to the underlying X-Ray traces, so the map you built here becomes the drill-down target rather than a separate tool.
Transaction Search attacks tracing’s oldest weakness — sampling means the specific trace you need during an incident may never have been recorded. Enable it and X-Ray sends 100% of spans to a CloudWatch Logs group, so you can search every transaction by any attribute; you separately choose an indexing percentage (default 1%, up to 100%) that controls how many become indexed trace summaries for the analytics/map. You pay CloudWatch Logs ingestion for the spans, so it is a deliberate trade: full searchability for log-ingestion cost. Sampling still governs the classic X-Ray recorded-trace meter.
X-Ray Insights: anomaly detection on top of groups
Trace groups (section 6) are also the unit X-Ray Insights works on. Enable Insights on a group and X-Ray continuously baselines its fault rate and opens an “insight” automatically when faults deviate — with a timeline, the impacted portion of the map, and an estimate of affected requests. Insights can notify through EventBridge/CloudWatch so an anomaly becomes a page. In Terraform, Insights is a flag on the group:
resource "aws_xray_group" "checkout" {
  group_name        = "checkout-faults"
  filter_expression = "service(\"checkout-api\") AND fault = true"
  insights_configuration {
    insights_enabled      = true
    notifications_enabled = true
  }
}
Encryption, PII, and the security surface of a trace
Two security points are easy to miss. First, traces can carry sensitive data: URLs, headers, query attributes, and anything you promote to an annotation. Annotations are indexed and stored for 30 days and searchable by anyone with X-Ray read access — so never promote a raw PII field (email, card fragment, national ID) to indexed_attributes. Keep sensitive values in metadata at most, or redact them before they leave the SDK. Second, X-Ray encrypts trace data at rest with an AWS-owned key by default; if compliance requires a customer-managed key, set it once per account:
resource "aws_xray_encryption_config" "cmk" {
  type   = "KMS"
  key_id = aws_kms_key.xray.arn   # customer-managed key for X-Ray at-rest encryption
}
Because X-Ray API actions do not support resource-level scoping (Resource: "*" is unavoidable on PutTraceSegments), the real access boundary is the role the exporter assumes and the SCPs/permission boundaries around it — not per-resource ARNs. Give the Collector’s role only the ten-ish X-Ray write/sampling actions, and nothing else.
Limits and quotas that shape a design
- Retention is fixed at 30 days — not configurable up or down. Beyond that, export (section 8).
- Up to 50 annotations per trace are indexed. Promote deliberately; the 51st is dropped from the index.
- Trace-ID time window. X-Ray rejects a segment whose trace-ID epoch prefix is older than the retention window or set in the future — the reason the
AwsXRayIdGeneratormatters. A random W3C ID whose first bytes are not a recent timestamp is refused. - Segment document size. The daemon’s UDP path caps a single document at 64 KB, which is why large subsegments are streamed as independent documents rather than one giant segment. Keep individual documents lean.
- Sampling rules and groups have per-account default quotas (a few hundred rules; a couple dozen groups) that you can raise through Service Quotas — design your rule set to be small and prioritized rather than sprawling.
A cost model you can reason about
X-Ray bills on two meters and Transaction Search adds a third; conflating them is how surprise bills happen:
| Meter | Driven by | Your lever |
|---|---|---|
| Traces recorded | PutTraceSegments volume (what sampling keeps) |
Sampling rules — reservoir + fixed rate (section 4) |
| Traces retrieved / scanned | Console browsing, filter queries, GetTraceSummaries/BatchGetTraces |
Prefer trace groups (server-side metrics) over repeated broad scans; scope time windows |
| Transaction Search span ingestion | 100% of spans written to CloudWatch Logs | Only enable where full searchability is worth Logs ingestion cost |
Representative public figures (verify against the current pricing page before you commit — they change and vary by Region): on the order of $5 per million traces recorded and $0.50 per million retrieved, with a monthly free tier. The design consequence is stable regardless of the exact number: sampling controls the write bill, query discipline controls the read bill, and Transaction Search is a separate, opt-in log-ingestion cost. A team that scripts a broad GetTraceSummaries poll every few seconds can run up the retrieval meter as fast as ingestion — so budget both sides.
Advanced failure modes
| Symptom | Likely cause | Fix |
|---|---|---|
| Map splits into two disconnected clusters | Workloads propagate only W3C; AWS edges use X-Amzn-Trace-Id |
Add xray to OTEL_PROPAGATORS (composite propagator) |
AccessDenied / signature in Collector logs |
Service account not bound, or role missing X-Ray actions | Fix IRSA/Pod Identity binding; confirm PutTraceSegments + Sampling* |
Segments silently rejected, send_failed_spans climbing |
SDK mints random W3C IDs; epoch prefix invalid | Use AwsXRayIdGenerator so root IDs carry a recent timestamp |
| Recorded-trace bill scales with pod count | Reporters keep local reservoirs (no GetSamplingTargets) |
Grant the two extra sampling actions; use centralized/remote sampling |
| No traces at all on Fargate pods | DaemonSet has no node to land on under Fargate | Run the Collector as a sidecar in the Fargate pod |
| The one trace you need during an incident was never recorded | Sampling dropped it | Enable Transaction Search for 100% span searchability on critical flows |
Practice challenges
Work these in order — they escalate from reading the data model to designing a cost-and-fidelity strategy. Each has a worked solution; try it before you open the toggle.
Challenge 1 — Decode a trace ID (beginner)
You are handed the trace ID 1-67c0a1f2-5e1b2a3c4d5e6f7081920a3b. Without any AWS access, work out when this trace started, and explain why X-Ray can expire traces cheaply from the ID alone.
<details> <summary>Solution</summary>
The middle group — 67c0a1f2 — is the start time in epoch seconds, hex-encoded. Convert it:
python3 -c "import datetime;e=int('67c0a1f2',16);print(e, datetime.datetime.fromtimestamp(e,datetime.timezone.utc))"
# 1740677618 2025-02-27 17:33:38+00:00
So the trace began at 2025-02-27 17:33:38 UTC. The last group (5e1b…0a3b) is 24 hex of randomness for uniqueness.
Why: because the start time is encoded in the ID, X-Ray knows a trace’s age without a lookup — it can shard by time and drop anything past the fixed 30-day window without scanning content. </details>
Challenge 2 — Make the managed edges appear on the map (beginner)
A request flows API Gateway (stage prod) → Lambda checkout-handler, but neither shows up as a node on the service map. Turn on tracing for both with the CLI, and say why this is the right layer to fix it.
<details> <summary>Solution</summary>
# API Gateway stage: enable Active Tracing (emits an API Gateway segment/node)
aws apigateway update-stage \
  --rest-api-id abc123 --stage-name prod \
  --patch-operations op=replace,path=/tracingEnabled,value=true

# Lambda: enable Active Tracing (Lambda creates the function segment/node)
aws lambda update-function-configuration \
  --function-name checkout-handler \
  --tracing-config Mode=Active
Why: the managed services trace themselves once Active Tracing is on — you never hand-instrument those edges, and without the switch they simply do not emit segments, so they cannot appear as nodes. </details>
Challenge 3 — Complete the Collector’s export pipeline (intermediate)
Finish this ADOT Collector config so it takes OTLP in and writes to X-Ray in eu-west-1, promoting http.route and deployment.environment to searchable annotations. What is the consequence if you leave indexed_attributes empty?
exporters:
  awsxray:
    # ??? fill in region + indexed_attributes
service:
  pipelines:
    traces:
      receivers: [otlp]
      processors: [memory_limiter, batch/traces]
      exporters: [ ??? ]
<details> <summary>Solution</summary>
exporters:
  awsxray:
    region: eu-west-1
    indexed_attributes:
      - http.route
      - deployment.environment
service:
  pipelines:
    traces:
      receivers: [otlp]
      processors: [memory_limiter, batch/traces]
      exporters: [awsxray]
Why: only attributes named in indexed_attributes become annotation.<key> and are searchable in filter expressions; leave it empty and those fields land as metadata — visible on a trace you already opened, but impossible to search or filter during an incident.
</details>
Challenge 4 — Write a high-fidelity sampling rule (intermediate)
Add a Terraform sampling rule for POST /api/payments* that always keeps 3 traces/second plus 25% above that, and is evaluated before the catch-all Default rule (priority 10000). What single field decides “before”?
<details> <summary>Solution</summary>
resource "aws_xray_sampling_rule" "payments" {
  rule_name      = "payments-high-fidelity"
  priority       = 200          # lower number = evaluated first (before Default's 10000)
  reservoir_size = 3            # 3 traces/sec floor
  fixed_rate     = 0.25         # then 25% of everything above the reservoir
  host           = "*"
  http_method    = "POST"
  url_path       = "/api/payments*"
  service_name   = "*"
  service_type   = "*"
  resource_arn   = "*"
  version        = 1
}
Why: priority decides order — rules are evaluated ascending, so the lowest matching number wins. A specific rule must sit below Default’s 10000, or the catch-all matches first and your fidelity rule never fires.
</details>
Challenge 5 — Reconnect a split service map (advanced)
The map shows API Gateway → two Lambdas as one connected cluster, and your EKS services as a separate disconnected cluster. One request is producing two traces. Give the two-line fix in the EKS services and name the exact misconfiguration.
<details> <summary>Solution</summary>
The EKS services propagate only W3C traceparent, so the Root ID that API Gateway sent in X-Amzn-Trace-Id is never read — each EKS service mints a fresh trace ID. Fix propagation (and ID generation):
# env: honour the AWS header (composite propagator keeps W3C too)
OTEL_PROPAGATORS=xray,tracecontext,baggage
# code: X-Ray-shaped IDs + read/write the AWS header
from opentelemetry.propagate import set_global_textmap
from opentelemetry.propagators.aws import AwsXRayPropagator
from opentelemetry.sdk.extension.aws.trace import AwsXRayIdGenerator
from opentelemetry.sdk.trace import TracerProvider

set_global_textmap(AwsXRayPropagator())
provider = TracerProvider(id_generator=AwsXRayIdGenerator())
Why: on AWS a disconnected map is almost never a sampling problem — it is a propagator mismatch; adding xray to the propagator list lets the service extract the gateway’s Root ID so its segment attaches under the API Gateway node.
</details>
Challenge 6 — Design for cost and zero blind spots (advanced)
Leadership wants the X-Ray recorded-trace bill cut by ~60%, but the on-call must never find that the one checkout trace they need during an incident was dropped, and audit needs checkout traces kept for a year. Sketch the strategy across sampling, Transaction Search, and retention.
<details> <summary>Solution</summary>
Three moves, one per meter:
- Cut the write bill with sampling. Drop the
Defaultrule’sfixed_ratefrom0.05to0.01(5%→1%) — that removes most recorded traces from the noisy majority. Keep (or raise) the checkout rule’s reservoir so those flows stay fully sampled. - Close the blind spot with Transaction Search. Enable it so 100% of spans go to CloudWatch Logs and every checkout transaction is searchable by order ID even when classic sampling would have dropped it. Budget the CloudWatch Logs ingestion this adds.
- Satisfy the 1-year audit with an archive. X-Ray retention is a fixed 30 days, so fan out a second exporter to an S3-backed store (or run a scheduled
GetTraceSummaries+BatchGetTracesexport to S3 under a lifecycle policy) and keep the checkout copy for a year.
Why: the three costs are independent — sampling controls recorded-trace cost, Transaction Search buys full searchability at Logs-ingestion cost, and export solves the fixed 30-day retention — so you tune each to a different requirement instead of trading one off against another. </details>
Common beginner mistakes
These are misconceptions, not just bugs — each one is a wrong mental model that produces a whole class of problems. Fix the model and the symptoms stop.
“My services use OpenTelemetry, so I’ll just point them at X-Ray.” X-Ray does not accept OTLP. It stores segments, a different format. Pointing an OTLP exporter at X-Ray gets you nothing. The right model: on EKS you send OTLP to the ADOT Collector, and its awsxray exporter is the translator that turns spans into segments. The Collector is not optional plumbing — it is the bridge between the open format your code speaks and the native format the AWS service map understands.
“A trace ID is just a random ID.” For X-Ray it is not. An X-Ray trace ID is 1-{epoch-seconds-hex}-{random}, and the timestamp prefix is load-bearing — X-Ray rejects a segment whose prefix is not a recent time. If your SDK mints plain random W3C IDs, the segments silently fail. The right model: use AwsXRayIdGenerator so root IDs carry a valid epoch prefix. “Segments disappear and I don’t know why” is almost always this.
“Sampling is one percentage I set once.” X-Ray sampling is a reservoir (a guaranteed floor of N traces/second) plus a fixed rate (a percentage above the floor), and it is centralized — coordinated across every reporter through GetSamplingTargets. Thinking of it as a single local percentage leads to two errors: quiet endpoints that never get sampled (no reservoir), and a bill that scales with pod count (each reporter keeping its own reservoir because you never granted the sampling-read actions).
“Annotations and metadata are the same thing — extra fields on a trace.” Only annotations are indexed and therefore searchable in filter expressions (annotation.tenant = "acme"). Metadata is attached but not indexed — you can read it on a trace you already found, but you cannot search by it. The right model: promote the handful of fields you will triage by (tenant, route, environment) to annotations deliberately, and leave the rest as metadata. During an incident, “I can see it but I can’t filter for it” is this mistake.
“Turning on tracing records every request.” Sampling means most requests are not recorded, by design — the service map is a statistical picture, not a ledger of every call. Beginners chase “why is this one request missing from X-Ray?” when the honest answer is “sampling dropped it.” The right model: if you truly need every transaction findable (an order ID during an incident), that is exactly what Transaction Search is for — do not crank the fixed rate to 100% and pay to record everything.
“I configure the service map.” You never draw the map or define its nodes and edges. X-Ray derives it from fields in the segments you emit — service name, namespace, error/fault/throttle flags. A node is missing because a service is not emitting correctly-shaped segments (or an edge is not tracing itself), not because you forgot to add it to a graph config. The right model: shape the map by fixing instrumentation and propagation, never by editing the map.
“IRSA is a nice-to-have; I’ll just put access keys in the pod.” Long-lived keys in a pod are the anti-pattern the whole EKS identity model exists to kill. The awsxray exporter needs credentials, and the correct source is a role bound to the service account via IRSA or EKS Pod Identity — short-lived, rotated, auditable. Static keys in a ConfigMap or image are a security finding waiting to happen.
Glossary
| Term | Plain-language meaning |
|---|---|
| Trace | The full picture of one request as it crosses services — every segment and subsegment sharing one trace ID. |
| Trace ID | X-Ray’s ID for a trace, shaped 1-{epoch-seconds-hex}-{24-hex-random}. The timestamp prefix is why X-Ray can expire traces cheaply, and why it rejects IDs without a recent prefix. |
| Segment | The work one service did for a request — roughly an OpenTelemetry SERVER span plus everything local to that service. X-Ray’s native unit of storage. |
| Subsegment | A downstream call recorded inside a segment (an HTTP call, a DynamoDB query). Maps to an OTel CLIENT/PRODUCER span. |
| Span | OpenTelemetry’s unit of work. A SERVER/CONSUMER span becomes a segment; a CLIENT/PRODUCER span becomes a subsegment. |
| Service map (service graph) | The node-and-edge diagram X-Ray derives from segment fields, with rolled-up latency and error stats. You shape it by emitting correct segments, not by configuring it. |
| Annotation | A key-value promoted to X-Ray’s index, so it is searchable in filter expressions (annotation.key = "..."). Up to 50 per trace. |
| Metadata | A key-value attached to a trace but not indexed — readable on a trace you already opened, not searchable. |
| X-Amzn-Trace-Id | The trace-context header AWS-managed services (ALB, API Gateway, Lambda) speak: Root, Parent, Sampled. Distinct from W3C traceparent. |
| Propagator | The SDK component that reads/writes trace-context headers. AwsXRayPropagator handles X-Amzn-Trace-Id; a composite (OTEL_PROPAGATORS=xray,tracecontext,baggage) handles both AWS and W3C. |
| AwsXRayIdGenerator | The SDK piece that mints X-Ray-shaped trace IDs (with the epoch prefix X-Ray accepts) instead of plain random W3C IDs. |
| OpenTelemetry (OTel) | The vendor-neutral standard for instrumentation and the OTLP wire format. AWS’s go-forward instrumentation; the X-Ray SDKs are in maintenance. |
| OTLP | OpenTelemetry Protocol — the wire format spans travel in (gRPC :4317, HTTP :4318). X-Ray does not accept it directly. |
| ADOT | AWS Distro for OpenTelemetry — AWS’s supported, patched build of the OTel Collector with the AWS exporters (awsxray, awsemf) compiled in. |
| ADOT Collector | The running process that receives OTLP and exports it onward. Deployed as a DaemonSet (per node) or sidecar (per pod, required on Fargate). |
| awsxray exporter | The Collector component that translates OTLP spans into X-Ray segments and calls PutTraceSegments. |
| awsproxy extension | A Collector extension that proxies X-Ray sampling API calls, so app SDKs can use centralized sampling without their own AWS credentials. |
| DaemonSet | A Kubernetes object that runs one pod per node — the default shape for the Collector on managed node groups. |
| Sidecar | A second container inside your pod. The required Collector shape on EKS Fargate, which has no DaemonSets. |
| IRSA | IAM Roles for Service Accounts — binds an IAM role to a Kubernetes service account via OIDC, giving pods short-lived credentials instead of static keys. |
| EKS Pod Identity | The newer, simpler alternative to IRSA — a direct namespace/service-account-to-role association, no per-cluster OIDC plumbing. |
| Sampling rule | A policy combining a reservoir and a fixed rate, matched by host/method/path/service and ordered by priority (ascending). |
| Reservoir | The guaranteed floor: N traces kept per second for a rule, even at low traffic. Coordinated fleet-wide by the service. |
| Fixed rate | The percentage of traffic above the reservoir that is sampled. |
| Active Tracing | The per-resource switch that makes a managed service (Lambda, API Gateway) emit its own segment and appear as a map node. |
| Filter expression | The query language over indexed fields — service("x") AND fault = true AND annotation.tenant = "acme". |
| Trace group | A saved, monitored filter expression that emits CloudWatch metrics (FaultRate, ThrottleRate) you can alarm on. |
| X-Ray Insights | Anomaly detection on a group — automatically opens an “insight” when fault rates deviate, with an impacted-map timeline. |
| ServiceLens | The CloudWatch view that stitches the service map, traces, metrics, and logs into one pane. |
| Application Signals | CloudWatch’s OpenTelemetry-based APM layer — auto-discovered services with standard golden-signal metrics and SLOs with error-budget burn. |
| Transaction Search | The feature that stores 100% of spans in CloudWatch Logs so every transaction is searchable, defeating sampling blind spots (billed as Logs ingestion). |
| SLO (Service Level Objective) | A target on a service’s behaviour (e.g. p99 < 300 ms, 99.9% of the time), tracked with an error budget in Application Signals. |
| PutTraceSegments | The X-Ray API the exporter/daemon calls to write segments — the meter behind “traces recorded”. |
Verify
# 1. Confirm the Collector authenticated to X-Ray (IRSA working, no AccessDenied).
kubectl -n observability logs ds/adot-collector | grep -iE "xray|accessdenied|signature"

# 2. Confirm segments are being written: watch the exporter's success counter.
kubectl -n observability port-forward ds/adot-collector 8888:8888 &
curl -s localhost:8888/metrics | grep -E "otelcol_exporter_sent_spans|otelcol_exporter_send_failed_spans"

# 3. Confirm the centralized sampling rules are present and being polled.
aws xray get-sampling-rules --region eu-west-1 \
  --query 'SamplingRuleRecords[].SamplingRule.{name:RuleName,prio:Priority,rate:FixedRate,res:ReservoirSize}'

# 4. Pull a recent trace summary and confirm the service graph has the expected nodes.
aws xray get-trace-summaries --region eu-west-1 \
  --start-time "$(date -u -d '10 minutes ago' +%s)" --end-time "$(date -u +%s)" \
  --query 'TraceSummaries[0].ServiceIds[].Name'
In the X-Ray console, open the service map and confirm there is a single connected graph from the front-door service (API Gateway or ALB-fronted EKS) through to your downstream Lambdas and data stores, with no orphaned cluster. Then run a filter expression on an indexed annotation (annotation.tenant = "acme") and confirm it returns traces — that proves both the connected graph and the annotation indexing are live. otelcol_exporter_send_failed_spans flat at zero confirms the IAM grant and trace-ID format are correct.