In a nutshell
Imagine every request that enters your system gets a GPS tracker clipped to it at the front door. As that request hops from the web API to the orders service to the database and back, the tracker logs each leg — where it went, how long it waited, whether it arrived. Later you can pull up any single request and replay its entire journey across every service, and see exactly which leg stalled. That is distributed tracing, and Application Insights is where those journeys are stored, drawn as a map, and queried.
The tracker is OpenTelemetry (OTel) — an open, vendor-neutral standard for producing telemetry — and in .NET it is already built into the runtime as System.Diagnostics.Activity. The Azure Monitor OpenTelemetry Distro is one NuGet package and one line of startup code that ships those Activity objects to Application Insights. Because the tracker’s ID travels in a standard HTTP header (the W3C traceparent), every service that touches the request stamps the same journey ID, so the fragments stitch back into one end-to-end transaction — even across forty microservices you never coordinated.
The catch is volume. At scale you cannot afford to keep every journey, so sampling keeps a consistent fraction (say one in four) and marks each survivor with how many it stands in for (itemCount), so your charts still add up. Get sampling wrong and you either overpay for telemetry you never read, or you blind yourself to the one trace you needed. This lesson is the working tour: the migration off the old SDK, the sampling that actually controls the bill, and the correlation fields that make the application map and the transaction view work.
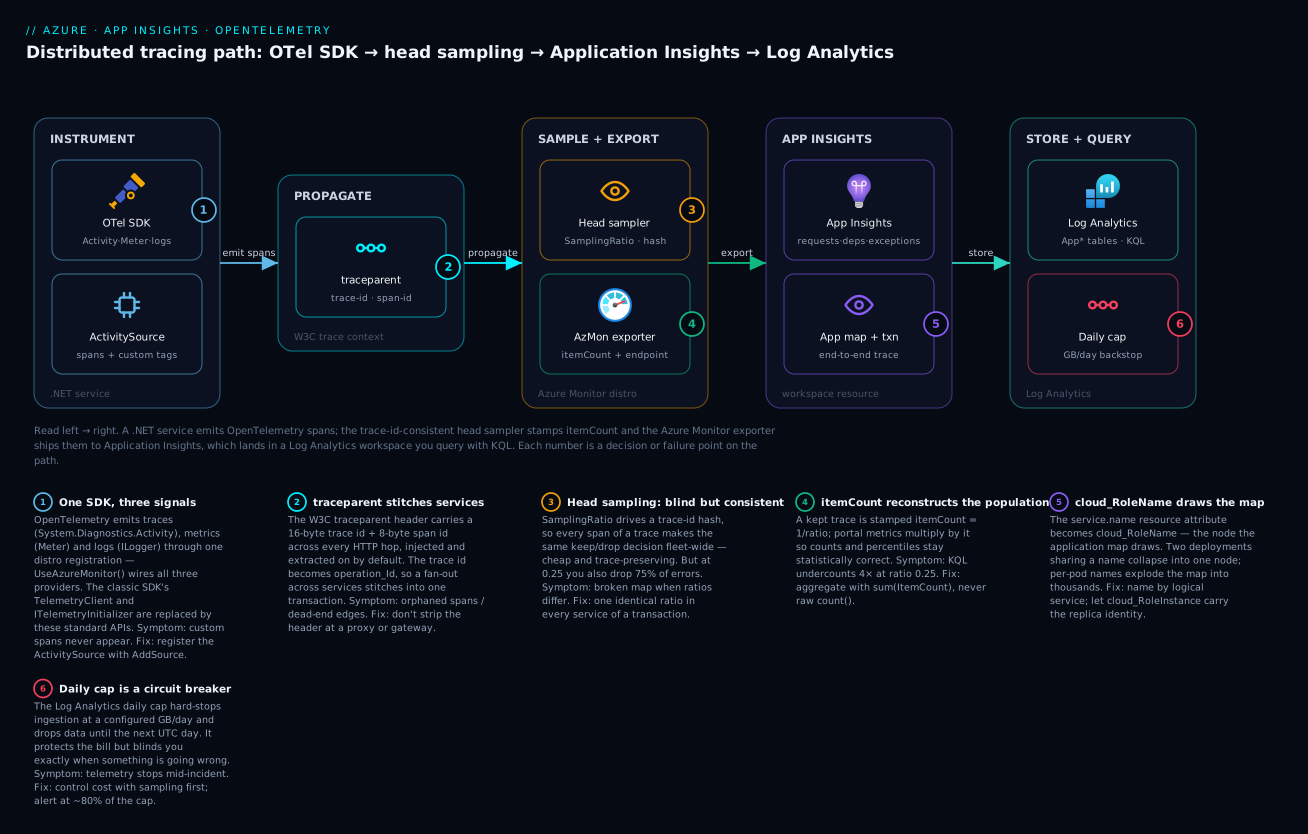
Walkthrough: a .NET service emits OpenTelemetry spans, the traceparent header propagates one trace ID across every hop, the trace-ID-consistent head sampler stamps itemCount and the Azure Monitor exporter ships the survivors to Application Insights, which lands in a Log Analytics workspace you query with KQL and guard with a daily cap.
Level: Advanced · Time: ~40 min
Prerequisites. You should be comfortable with C#/.NET (an ASP.NET Core minimal API or MVC app), the idea of microservices calling each other over HTTP, and reading a little KQL. You need an Azure subscription with a workspace-based Application Insights resource (the only kind you can create today) and its connection string. If distributed tracing itself is new, skim the OpenTelemetry model in Going deeper before the code sections — the rest of the lesson assumes the words span, trace, and context propagation mean something to you.
After this lesson you can:
- Migrate an ASP.NET Core app off the classic
Microsoft.ApplicationInsights.AspNetCoreSDK to the Azure Monitor OpenTelemetry distro in a handful of lines. - Create custom spans and metrics with
ActivitySource/Meterand get them to actually export. - Choose and standardize a sampling strategy — head vs tail — across a whole fleet without breaking traces.
- Reconstruct the true population from sampled data in KQL with
sum(ItemCount)instead of undercounting withcount(). - Set
cloud_RoleNameso the application map draws one node per logical service, not per pod. - Scrub PII in a processor before export, and cap ingestion cost before a runaway loop bankrupts the workspace.
The classic Application Insights SDK is in maintenance mode. New feature work in Azure Monitor goes to the OpenTelemetry-based distro, and if you are still running Microsoft.ApplicationInsights.AspNetCore you are accumulating a migration you will eventually be forced to do under worse conditions. The good news is that the new path is not a rewrite — it is a different package, a different startup call, and a model where your telemetry is System.Diagnostics.Activity objects exported to the same backend you already query with KQL. This is a working tour of that migration, the sampling behavior that actually controls your bill, and the correlation fields that make the application map and transaction diagnostics work.
1. Migrating from the classic SDK to the Azure Monitor OTel distro
The classic SDK exposed TelemetryClient, TelemetryConfiguration, and ITelemetryInitializer. The distro replaces those with the OpenTelemetry APIs (ActivitySource, Meter, ILogger) and a single registration call that wires the TracerProvider, MeterProvider, and log exporter to Azure Monitor in one shot.
Remove the old package and add the distro:
dotnet remove package Microsoft.ApplicationInsights.AspNetCore
dotnet add package Azure.Monitor.OpenTelemetry.AspNetCore
Azure.Monitor.OpenTelemetry.AspNetCore is the distro. It transitively pulls the OpenTelemetry SDK plus the ASP.NET Core, HttpClient, and SQL client instrumentation libraries, so a default web app gets request, dependency, and exception telemetry with one call. (For non-web workloads — workers, console apps — use Azure.Monitor.OpenTelemetry.Exporter and build the providers yourself.)
// Program.cs
using Azure.Monitor.OpenTelemetry.AspNetCore;

var builder = WebApplication.CreateBuilder(args);

builder.Services.AddOpenTelemetry().UseAzureMonitor();

var app = builder.Build();
Set the connection string out of band — never hardcode it. The distro reads APPLICATIONINSIGHTS_CONNECTION_STRING from the environment automatically:
export APPLICATIONINSIGHTS_CONNECTION_STRING="InstrumentationKey=00000000-0000-0000-0000-000000000000;IngestionEndpoint=https://<region>.in.applicationinsights.azure.com/;LiveEndpoint=https://<region>.livediagnostics.monitor.azure.com/"
The connection string carries a regional ingestion endpoint. The bare instrumentation key (classic style) is deprecated for ingestion routing — always use the full connection string, and on Azure App Service / Functions set it as an app setting so the platform injects it.
Two breaking-change classes will bite during migration. First, TelemetryClient.TrackEvent / TrackMetric have no direct equivalent: custom events map to nothing in OTel, and you replace custom metrics with a Meter. Second, any ITelemetryInitializer or ITelemetryProcessor you wrote does not load — the equivalent is an OpenTelemetry Processor<Activity>, covered in section 5.
2. Dependency, request, and exception telemetry with the activity model
Everything is an Activity. An incoming HTTP request becomes a server Activity (ActivityKind.Server), an outbound HttpClient call or SQL query becomes a client Activity (ActivityKind.Client), and the distro maps these to the requests and dependencies tables on export. You do not write that mapping; the instrumentation libraries emit the activities and the Azure Monitor exporter translates OTel semantic conventions into the Application Insights schema.
For your own code, define an ActivitySource and create spans explicitly. The source name must be registered or its activities are dropped:
using System.Diagnostics;

public static class Telemetry
{
    public static readonly ActivitySource Source = new("Orders.Api", "1.0.0");
}

// In a handler
using var activity = Telemetry.Source.StartActivity("ReserveInventory");
activity?.SetTag("order.id", orderId);
activity?.SetTag("order.line_count", lineCount);
Register the source so the SDK samples and exports it:
builder.Services.AddOpenTelemetry()
    .UseAzureMonitor()
    .WithTracing(t => t.AddSource("Orders.Api"));
Exceptions are recorded on the active activity, not as a separate top-level call. The ASP.NET Core instrumentation sets the activity status to Error on an unhandled exception and records the exception event; that surfaces in the exceptions table joined to its parent request. To record a handled exception explicitly:
try
{
    await reservationClient.ReserveAsync(order);
}
catch (ReservationConflictException ex)
{
    activity?.AddException(ex);            // .NET 9+ first-class API
    activity?.SetStatus(ActivityStatusCode.Error, ex.Message);
    // ... compensate
}
The exporter populates
operation_Nameon a request from the route template (for examplePOST Orders/{id}), not the raw URL. If youroperation_Nameshows full URLs with IDs baked in, you have unparameterized routes and your app map will fragment into thousands of distinct operations.
3. Adaptive vs fixed-rate ingestion sampling and how itemCount is preserved
This is the section that controls your bill, and it is the one most teams get wrong. There are two distinct sampling models, and the distro does not use the classic one.
Adaptive sampling was a classic-SDK feature: the SDK watched the telemetry rate and dynamically dialed the sampling percentage up or down to hit a target items-per-second. It is implemented by AdaptiveSamplingTelemetryProcessor and is not available in the Azure Monitor OpenTelemetry distro. If a migration doc or an old runbook tells you to configure adaptive sampling on the new distro, it is stale.
What the distro gives you is fixed-rate sampling via a single property:
builder.Services.AddOpenTelemetry().UseAzureMonitor(o =>
{
    // Keep 25% of traces. Range 0.0 - 1.0. 1.0 = keep everything.
    o.SamplingRatio = 0.25F;
});
SamplingRatio drives an ApplicationInsightsSampler that is trace-ID-based and consistent: the keep/drop decision is a hash of the trace ID, so every span of a given trace makes the same decision across every service that uses the same ratio. That consistency is the whole point — it keeps traces intact rather than slicing them, the same property tail sampling in a Collector has to engineer with a load-balancing exporter. The cost is that the decision is blind: at 0.25 you keep 25% of errors and 25% of slow requests along with 25% of the boring ones.
The critical concept is itemCount. When the sampler keeps one trace out of four, it does not pretend the other three never happened. It stamps the surviving telemetry with an itemCount of 4 (the inverse of the sampling rate). Azure Monitor’s aggregations and the portal’s metrics multiply by itemCount to reconstruct the true population. So requests/count and dependencies/duration percentiles stay statistically correct even though you ingested a quarter of the rows. If you write raw KQL that does count() without weighting, you will undercount by 4x — section 6 shows the fix.
| Property | Classic adaptive | Distro fixed-rate |
|---|---|---|
| Mechanism | dynamic, targets items/sec | static ratio, trace-ID hash |
| Consistency across services | per-node, not guaranteed | guaranteed (same ratio + trace ID) |
| Available in OTel distro | no | yes (SamplingRatio) |
| itemCount stamped | yes | yes |
Set the same SamplingRatio in every service of a transaction. Mismatched ratios re-introduce the broken-trace problem: a downstream service at 1.0 keeping spans whose root was dropped at 0.1.
4. Cross-component correlation: operation_Id, parentId, and the app map
Distributed correlation rides on W3C Trace Context. The traceparent HTTP header carries a 16-byte trace ID and an 8-byte span ID; the HttpClient instrumentation injects it on outbound calls and the ASP.NET Core instrumentation extracts it on inbound. You do not configure this — it is on by default in the distro, and it is the reason a request landing on service A and fanning out to B and C stitches into one transaction.
The OTel trace ID becomes operation_Id on export. Every span sharing a trace ID shares operation_Id, and parentId (the parent span ID) chains them into a tree. The fields map like this:
| OpenTelemetry | App Insights column | Meaning |
|---|---|---|
| TraceId | operation_Id |
one value per end-to-end transaction |
| SpanId | id |
this span |
| ParentSpanId | operation_ParentId |
the calling span |
service.name |
cloud_RoleName |
the node on the app map |
service.instance.id |
cloud_RoleInstance |
the specific replica |
cloud_RoleName is what the application map draws as a node, so set it deliberately. The distro derives it from the service.name resource attribute; override it through resource configuration rather than letting it default to the process name:
using OpenTelemetry.Resources;

builder.Services.AddOpenTelemetry()
    .UseAzureMonitor()
    .ConfigureResource(r => r.AddService(
        serviceName: "orders-api",
        serviceNamespace: "commerce",
        serviceInstanceId: Environment.MachineName));
If two deployments report the same service.name, they collapse into one node on the map and you lose the ability to see traffic between them. Conversely, per-pod role names explode the map. Name by logical service, and let cloud_RoleInstance carry the replica identity.
5. Custom dimensions, telemetry processors, and PII scrubbing
Tags you set on an activity (activity.SetTag(...)) land in the customDimensions property bag, queryable as customDimensions.key. That is the right place for business context — tenant ID, SKU, feature flag — that you want to slice by in KQL.
When you need to mutate or drop telemetry before export — the classic ITelemetryProcessor job — implement an OpenTelemetry BaseProcessor<Activity> and register it on the tracer provider. The canonical use is scrubbing PII out of URLs and tags so it never reaches the ingestion endpoint:
using System.Diagnostics;
using OpenTelemetry;

public sealed class PiiRedactingProcessor : BaseProcessor<Activity>
{
    public override void OnEnd(Activity activity)
    {
        // Strip a query string that may carry tokens or emails.
        var url = activity.GetTagItem("url.full") as string;
        if (url is not null && url.Contains('?'))
        {
            activity.SetTag("url.full", url[..url.IndexOf('?')]);
        }

        // Drop a tag entirely by overwriting with null.
        if (activity.GetTagItem("enduser.email") is not null)
        {
            activity.SetTag("enduser.email", null);
        }
    }
}
Register it. Order matters: scrub on OnEnd so you see the final, fully-tagged activity:
builder.Services.AddOpenTelemetry()
    .UseAzureMonitor()
    .WithTracing(t => t.AddProcessor<PiiRedactingProcessor>());
Two rules a principal review should enforce. Redaction belongs in a processor, not scattered through handlers, so there is one auditable place that data leaves the boundary clean. And redaction must run client-side, before export — Azure Monitor’s workspace-level data collection transformations can also drop columns at ingestion, but by then the PII has already crossed the network to the regional endpoint, which most compliance regimes treat as a disclosure.
6. Querying requests/dependencies tables and building transaction diagnostics in KQL
In a workspace-based Application Insights resource, the tables are AppRequests, AppDependencies, AppExceptions, AppTraces, and AppPerformanceCounters. (The portal’s transaction view uses the same data; KQL gives you control the UI does not.)
Reconstruct a full transaction from an operation_Id. Union the three tables, normalize timing, and order by start to read the call tree top to bottom:
let opId = "0123456789abcdef0123456789abcdef";
union AppRequests, AppDependencies, AppExceptions
| where OperationId == opId
| project TimeGenerated, ItemType = Type, Name, Target,
          DurationMs = DurationMs, Success, ParentId, Id
| order by TimeGenerated asc
Find the slowest dependency type across the fleet — and weight by ItemCount so sampling does not skew the percentile:
AppDependencies
| where TimeGenerated > ago(1h)
| summarize p95 = percentile(DurationMs, 95),
            calls = sum(ItemCount)          // ItemCount, not count()
          by DependencyType = Type, Target
| order by p95 desc
That sum(ItemCount) is the rule for any sampled environment: raw count() counts ingested rows, sum(ItemCount) reconstructs the real population. The same applies to failure rates:
AppRequests
| where TimeGenerated > ago(30m)
| summarize total = sum(ItemCount),
            failed = sumif(ItemCount, Success == false)
          by OperationName = Name
| extend failureRate = round(100.0 * failed / total, 2)
| where total > 100
| order by failureRate desc
To stitch failures back to their root request — the diagnostic the transaction view is built for — join exceptions to their parent request on OperationId:
AppExceptions
| where TimeGenerated > ago(1h)
| project OperationId, ProblemId, ExceptionType = Type,
          OuterMessage, ExcParentId = ParentId
| join kind=inner (
    AppRequests
    | project OperationId, RequestName = Name, ResultCode, Url
  ) on OperationId
| summarize occurrences = count() by ProblemId, ExceptionType, RequestName
| order by occurrences desc
Going deeper
Sections 1–6 are the how. This section is the why underneath — the model the distro implements, the choices it hides, and the places where an experienced engineer earns or loses money and sleep. Read it once end to end; you will come back to the sampling and cost parts.
The OpenTelemetry data model: three signals, one context
OpenTelemetry defines three signals, and the distro exports all three to Application Insights:
- Traces are made of spans. A span is a single timed operation — an incoming request, an outbound SQL call — with a start time, a duration, a status, and a bag of attributes (tags). A span has a parent, so spans form a tree, and the whole tree is one trace. In .NET a span is a
System.Diagnostics.Activity; there is no separate OTel span object. Each span has anActivityKind:Server(you received a call),Client(you made one),Internal(in-process work), andProducer/Consumer(async messaging). The kind is what tells the exporter whether a span becomes arequestrow or adependencyrow. - Metrics come from a
Meterand its instruments —Counter,UpDownCounter,Histogram,ObservableGauge. Metrics are pre-aggregated client-side into time buckets, so they are cheap and constant-cost regardless of traffic; they never carry a full call tree, which is why you cannot drill from a metric spike to a specific request without exemplars (below). - Logs are
ILoggerrecords. The distro’s log exporter stamps each record with the trace ID and span ID of theActivitythat was current when you logged, so a log line in theAppTracestable joins straight back to the request that produced it.
The thread that ties the three together is context. Within a process, the “current” span lives in Activity.Current, backed by AsyncLocal<T>, so it flows across await boundaries automatically. Across processes it travels in the W3C traceparent header, whose format is fixed:
traceparent: 00-4bf92f3577b34da6a3ce929d0e0e4736-00f067aa0ba902b7-01
             ^^ ^------------ 16-byte trace id -----------^ ^-- 8-byte span id --^ ^^
           version                                                              trace-flags
The final byte is trace-flags; its low bit is the sampled flag — the upstream service’s way of telling downstream “I decided to keep this trace, you should too.” A sibling header, tracestate, carries vendor-specific key/values, and baggage (Activity.Baggage) propagates your own key/values (a tenant ID, an experiment arm) across every hop so any service can read them. Baggage is powerful and dangerous: it rides every request header, so never put anything large or secret in it.
Three ways to instrument .NET, and when each applies
“Add OpenTelemetry” is not one decision. There are four surfaces, and mixing them is where people get double-counted telemetry:
| Approach | Package / mechanism | Use when | Trade-off |
|---|---|---|---|
| Azure Monitor distro | Azure.Monitor.OpenTelemetry.AspNetCore + UseAzureMonitor() |
Almost all ASP.NET Core apps | Batteries included; opinionated defaults; the recommended path |
| Classic App Insights SDK | Microsoft.ApplicationInsights.AspNetCore + TelemetryClient |
Existing apps not yet migrated | Maintenance mode — bug fixes only, no new features |
| Exporter only | Azure.Monitor.OpenTelemetry.Exporter + hand-built providers |
Workers, console apps, libraries, or when you already run vanilla OTel | You wire AddSource, instrumentation, and exporters yourself |
| Auto-instrumentation (codeless) | App Service / Functions extension, AKS attach | You cannot change the code, or want a zero-touch baseline | Limited surface; conflicts with a manual SDK if you run both |
The rule that saves you a confusing afternoon: pick one path per process. If App Service auto-instrumentation is on and you also call UseAzureMonitor(), you can get two exporters and duplicated dependencies. On App Service, either disable the auto-instrumentation extension and instrument in code, or leave the code clean and let the platform do it — not both.
Head vs tail vs ingestion sampling
There are three places a keep/drop decision can be made, and they answer different questions:
| Head sampling | Tail sampling | Ingestion sampling | |
|---|---|---|---|
| Decided | at the root span, before work runs | after the whole trace is buffered | server-side, after the network hop |
| Where | in-process (SamplingRatio) |
in an OTel Collector tier | at Azure Monitor (classic SDK feature) |
| Can keep “all errors”? | no — it is blind | yes — it sees the finished trace | limited |
| Cost model | free, stateless | a stateful Collector fleet | you already paid to transmit |
| Distro uses it? | yes, this is SamplingRatio |
you build it yourself | not in the distro |
SamplingRatio is head sampling: cheap, consistent (trace-ID hash), and blind. When “drop 90% but keep every error and every slow request” is a hard requirement — a regulated audit path, say — you need tail sampling, which can only decide after it has seen the complete trace, so it must run in an OpenTelemetry Collector that buffers spans. Because a trace’s spans arrive from many services, the Collector needs a load-balancing exporter to route all spans of one trace to the same Collector instance before the tail_sampling processor decides. A minimal tail tier that keeps errors and slow traces, plus a small probabilistic floor, and exports to the same Application Insights resource:
# otel-collector-config.yaml - tail-sampling tier for the regulated services
receivers:
  otlp:
    protocols:
      grpc:
      http:
processors:
  tail_sampling:
    decision_wait: 10s
    policies:
      - name: keep-errors
        type: status_code
        status_code: { status_codes: [ERROR] }
      - name: keep-slow
        type: latency
        latency: { threshold_ms: 1500 }
      - name: probabilistic-floor
        type: probabilistic
        probabilistic: { sampling_percentage: 5 }
exporters:
  azuremonitor:
    connection_string: ${APPLICATIONINSIGHTS_CONNECTION_STRING}
service:
  pipelines:
    traces:
      receivers: [otlp]
      processors: [tail_sampling]
      exporters: [azuremonitor]
The azuremonitor exporter and tail_sampling processor both live in the OpenTelemetry Collector contrib distribution, not the core one — a common “why won’t my config load” trap. And tail sampling is not free: decision_wait means every span sits in Collector memory for those seconds, so a busy service needs the Collector sized for its span rate.
Processors, samplers, and enrichment: what runs where
Order matters, and knowing the order tells you where to put each concern. Conceptually the pipeline is:
Activity starts → Sampler decides keep/drop → (if kept) processors' OnStart
    → your code runs, tags accumulate → Activity ends → processors' OnEnd
    → BatchExportProcessor buffers → AzureMonitorExporter ships
Three consequences fall out of that ordering:
- A processor cannot un-drop a span. The
ApplicationInsightsSamplerruns first; a dropped span is never recorded, so aBaseProcessor<Activity>never sees it. If you need to keep a span conditionally (all errors), that is a sampler/tail-sampling job, not a processor job. - To stop a span being created at all — health-check probes, static-file requests — filter at the instrumentation, not in a processor. With the distro you set the ASP.NET Core instrumentation’s
Filterpredicate through DI:services.Configure<AspNetCoreTraceInstrumentationOptions>(o => o.Filter = ctx => !ctx.Request.Path.StartsWithSegments("/health"));. Returningfalsemeans “do not record this request,” which is cheaper than recording it and sampling it away. - Enrichment has three tiers, each with a scope: resource attributes (
ConfigureResource().AddService(...)) are static per-process —cloud_RoleName, version, region; a processor (OnStart/OnEnd) touches every span for cross-cutting concerns — PII scrubbing, adding an environment tag; andactivity.SetTag(...)in a handler adds per-operation business context. Put each thing at the widest scope that still has the data it needs.
The workspace-based data model and KQL
Application Insights used to store telemetry in its own opaque store (“classic”). Those classic resources retired in early 2024; every resource you create now is workspace-based, meaning the telemetry physically lives in a Log Analytics workspace. That change is why the tables are named App* (AppRequests, AppDependencies, AppExceptions, AppTraces, AppPerformanceCounters) and why you can join App Insights data to VM logs, AKS container logs, and Azure resource logs in one KQL query — they are all in the same workspace. RBAC, retention, and billing are unified at the workspace, not scattered per component.
A few model details that change how you query and what you pay:
customDimensionsis a dynamic property bag;activity.SetTag("tenant", id)lands there and you filter it ascustomDimensions.tenant. It is un-indexed, so heavy filtering on it is slower than filtering a first-class column.ItemCountis a real column on every sampled row. Everysummarizeover sampled data must usesum(ItemCount)(counts) or theItemCount-weighted form;count()reports ingested rows, not real events.- Table plans. Each table can be Analytics (full KQL, alerting, longer interactive retention) or Basic/Auxiliary (cheap ingestion, limited KQL, short retention, meant for high-volume verbose logs). Moving
AppTracesto a Basic plan can cut a log-heavy bill sharply — at the cost of not being able to alert on it or run the full query surface. - Retention and commitment tiers. Interactive retention plus optional cheaper long-term archive is set per table; the workspace can sit on a pay-as-you-go or a discounted commitment tier (a fixed GB/day you pre-buy). Right-sizing the tier to your steady-state ingestion is often a bigger lever than one more turn of the sampling dial.
Exemplars, Live Metrics, and the application map
Three features are worth knowing exist, because they answer questions the raw tables cannot:
- Exemplars solve “this metric spiked — show me one real trace that caused it.” An exemplar attaches a sample trace ID/span ID to an aggregated metric bucket, so you can jump from a latency histogram straight to a representative slow trace instead of hunting. Exemplars are an OpenTelemetry metrics feature and Azure Monitor’s surfacing of them is still maturing — treat it as “emerging,” not a guaranteed portal button on every chart.
- Live Metrics (historically “QuickPulse”) is a separate, low-latency stream over the connection string’s
LiveEndpoint. It is not sampled bySamplingRatioand not persisted — it is a ~1-second real-time view you watch during a deploy or an incident, then it is gone. The distro enables it by default; you can turn it off via theEnableLiveMetricsoption. Because it bypasses sampling, it is the one place you see 100% of the current second even when you ingest 10%. - The application map is derived, not stored: Azure Monitor builds it by grouping telemetry by
cloud_RoleName(the nodes) and reading dependency spans (the edges), then annotating each edge with call volume and failure rate fromitemCount-weighted aggregates. That is why role naming is not cosmetic — it is the map’s topology. Badcloud_RoleNamehygiene does not make the map ugly; it makes the map wrong.
Cost control as layered defense
Sampling is the headline lever, but a mature setup defends the bill in layers, cheapest-first:
- Sample at the source —
SamplingRatio, standardized fleet-wide. This is the biggest, cheapest cut because dropped telemetry is never transmitted or stored. - Drop noise before it exports — filter health checks at the instrumentation, lower the exported log level (
Information→Warningfor chatty namespaces), and drop known-noisy dependency types in a processor. - Transform at ingestion — a workspace data collection transformation (KQL applied as rows land) can drop or mask columns you cannot filter at source. Note this happens after the network hop, so it saves storage cost, not transmission, and it is not a PII boundary.
- Right-size retention and table plans — move verbose tables to Basic, shorten interactive retention, archive the rest.
- The daily cap — the hard backstop, covered below. It is the last line, not the first, because hitting it means data loss.
The mistake is reaching for layer 5 (the cap) to control cost. The cap is a circuit breaker against a runaway loop, not a budgeting tool; the budgeting tool is layers 1–4.
Enterprise scenario
A payments platform team running about forty .NET microservices on AKS migrated off the classic SDK and immediately tripped two wires at once. First, half the services migrated in sprint N and the rest in sprint N+1; during the overlap the migrated services ran the distro at SamplingRatio = 0.1 while the un-migrated ones still ran classic adaptive sampling targeting five items/second. The two algorithms made independent keep/drop decisions on the same traces, so the application map showed dependencies that dead-ended — a request kept by service A calling a service B span that had been dropped. The transaction view was unusable for exactly the cross-service failures the team cared about.
The constraint was that they could not pause the migration and could not run unsampled at their volume (the workspace was already near a meaningful daily ingestion spend). The fix had two parts. They standardized on distro fixed-rate sampling everywhere and set an identical ratio via a shared environment variable injected by a Helm chart, so trace-ID-consistent sampling held across the whole mesh:
# values.yaml fragment applied to every service's Deployment
env:
  - name: APPLICATIONINSIGHTS_CONNECTION_STRING
    valueFrom:
      secretKeyRef: { name: appinsights, key: connectionString }
  - name: OTEL_SAMPLING_RATIO        # read in Program.cs, applied to SamplingRatio
    value: "0.10"
Second, for the four services on the regulated payment-authorization path, blind 10% sampling was unacceptable because a dropped error was a lost audit trail. They could not afford full retention fleet-wide, so they kept the cheap consistent head sampling for the bulk and added a second-tier OpenTelemetry Collector doing tail-based sampling only for those services — keeping 100% of error and high-latency traces and a small probabilistic floor of the rest — exporting to the same Azure Monitor resource. The result: the app map stitched cleanly again, the regulated path retained every error, and ingestion dropped roughly 80% versus their pre-migration unsampled baseline. The lesson the team wrote into their migration runbook: a sampling ratio is a fleet-wide contract, not a per-service setting.
Verify
Confirm the pipeline end to end before you call the migration done.
- Generate traffic and confirm requests arrive:
AppRequests | where TimeGenerated > ago(15m) | summarize count() by cloud_RoleName— every service’s role name should appear, with no duplicates or process-name defaults. - Confirm cross-service correlation: pick one
OperationIdfromAppRequestsand union it acrossAppDependencies— you should see a connected tree viaParentId/Id, not orphaned spans. - Confirm sampling and itemCount:
AppRequests | where TimeGenerated > ago(15m) | summarize ingested = count(), reconstructed = sum(ItemCount)— atSamplingRatio = 0.25the reconstructed total should be roughly 4x the ingested count. - Confirm PII scrubbing: query
AppDependencies | take 50 | project Data, Targetand grep for query strings or known PII tags — they must be absent. - Open the application map in the portal and confirm nodes match logical services and the edges carry call counts and failure rates.
Controlling data volume cap, daily cap alerts, and ingestion cost
Sampling reduces volume probabilistically; the daily cap is the hard backstop that stops ingestion when a workspace exceeds a configured GB/day, protecting against a runaway loop that floods telemetry. Set it on the Log Analytics workspace and alert before you hit it:
az monitor log-analytics workspace update \
  --resource-group rg-observability \
  --workspace-name law-prod \
  --daily-quota-gb 50
The cap fires a _LogOperation event when reached, and after the cap data is dropped until the next UTC day — which means a cap is a circuit breaker, not a budgeting tool, because hitting it blinds you exactly when something is going wrong. Alert at ~80% of the cap so an engineer reacts before data loss. Track ingestion by table to find what to sample harder:
Usage
| where TimeGenerated > ago(7d)
| where IsBillable == true
| summarize BillableGB = sum(Quantity) / 1000 by DataType
| order by BillableGB desc
If AppDependencies or AppTraces dominate, lower SamplingRatio, drop noisy dependency types in a processor, or move verbose logs below the exported log level before you touch the cap.
Practice challenges
Work these in order — they escalate from a first migration to a fleet-wide sampling design. Each solution names the exact call or query and a one-line why.
<details> <summary><strong>1. Beginner — migrate a default web app.</strong> Take an ASP.NET Core app off the classic SDK and get requests, dependencies, and exceptions flowing to Application Insights with the connection string supplied out of band.</summary>
Remove Microsoft.ApplicationInsights.AspNetCore, add Azure.Monitor.OpenTelemetry.AspNetCore, and register the distro:
builder.Services.AddOpenTelemetry().UseAzureMonitor();
Then supply the connection string via the environment (never in code):
export APPLICATIONINSIGHTS_CONNECTION_STRING="InstrumentationKey=00000000-0000-0000-0000-000000000000;IngestionEndpoint=https://<region>.in.applicationinsights.azure.com/;LiveEndpoint=https://<region>.livediagnostics.monitor.azure.com/"
Why: the distro’s transitive instrumentation gives a web app request/dependency/exception telemetry from that one call — the entire migration surface for a default app is one package swap plus one line.
</details>
<details> <summary><strong>2. Beginner→Intermediate — a custom span that actually exports.</strong> Wrap a business operation (<code>ReserveInventory</code>) in a span with two business tags, and make sure it does not get silently dropped.</summary>
Define and register an ActivitySource, then create the span:
public static class Telemetry
{
    public static readonly ActivitySource Source = new("Orders.Api", "1.0.0");
}

builder.Services.AddOpenTelemetry()
    .UseAzureMonitor()
    .WithTracing(t => t.AddSource("Orders.Api"));   // the line people forget

// in the handler
using var activity = Telemetry.Source.StartActivity("ReserveInventory");
activity?.SetTag("order.id", orderId);
activity?.SetTag("order.line_count", lineCount);
Why: an ActivitySource whose name is not passed to AddSource(...) produces activities the SDK never samples or exports — “my custom spans don’t show up” is almost always a missing AddSource.
</details>
<details> <summary><strong>3. Intermediate — sample to 20% and count correctly.</strong> Keep one request in five, then write the KQL that reports the <em>true</em> request volume per operation, not the ingested-row count.</summary>
Set the ratio, then weight by ItemCount:
builder.Services.AddOpenTelemetry().UseAzureMonitor(o => o.SamplingRatio = 0.20F);
AppRequests
| where TimeGenerated > ago(1h)
| summarize realRequests = sum(ItemCount) by OperationName = Name
| order by realRequests desc
Why: at SamplingRatio = 0.20 each kept row carries ItemCount = 5; count() would report a fifth of reality, while sum(ItemCount) reconstructs the true population.
</details>
<details> <summary><strong>4. Intermediate→Advanced — name the map and audit it.</strong> Set a logical <code>cloud_RoleName</code>, then write KQL that flags any service still reporting a default/process-style name so a bad deploy can’t quietly fragment the map.</summary>
Set the role name via the resource:
builder.Services.AddOpenTelemetry()
    .UseAzureMonitor()
    .ConfigureResource(r => r.AddService(
        serviceName: "orders-api",
        serviceInstanceId: Environment.MachineName));
Audit which role names are live:
AppRequests
| where TimeGenerated > ago(1d)
| summarize requests = sum(ItemCount) by cloud_RoleName
| order by cloud_RoleName asc
Eyeball the list for process defaults (dotnet, w3wp, a container hash) or per-pod names.
Why: cloud_RoleName is the application map’s node identity — a default or per-pod name either collapses services together or explodes the map, and both are silent until someone opens the map during an incident.
</details>
<details> <summary><strong>5. Advanced — stop instrumenting health probes.</strong> Kubernetes liveness/readiness probes hit <code>/health</code> hundreds of times a minute. Prevent those requests from ever becoming spans (do not merely sample them away).</summary>
Filter at the ASP.NET Core instrumentation, configured through DI with the distro:
using OpenTelemetry.Instrumentation.AspNetCore;

builder.Services.Configure<AspNetCoreTraceInstrumentationOptions>(o =>
{
    o.Filter = ctx => !ctx.Request.Path.StartsWithSegments("/health");
});
Why: the Filter predicate returns false to say “do not record this request,” so the span is never created — cheaper than recording it and dropping it later, and a processor could not have done this because the sampler/recording decision happens before OnEnd.
</details>
<details> <summary><strong>6. Advanced — design fleet-wide sampling with a regulated exception.</strong> Forty services can run at 10%, but four on the payment-authorization path must retain <em>every</em> error and slow trace. Design the sampling so traces never break and the four keep their audit trail — and say why a per-team ratio is wrong.</summary>
Two tiers. First, standardize head sampling everywhere via a shared, injected ratio so the trace-ID hash is consistent across the mesh:
env:
  - name: OTEL_SAMPLING_RATIO   # read in Program.cs → SamplingRatio
    value: "0.10"
Never leave any service on classic adaptive sampling during the rollout — mixed algorithms make independent decisions and break traces. Then, in front of the four regulated services only, add a tail-sampling OpenTelemetry Collector tier (keep status_code=ERROR, keep latency > threshold, plus a small probabilistic floor) exporting to the same Application Insights resource — the otel-collector-config.yaml from Going deeper.
Why: head sampling is a fleet-wide contract — a keep/drop decision is only trace-consistent when every service uses the same ratio, so a per-team ratio silently re-creates dead-ended edges; and only tail sampling can conditionally keep “all errors,” because that decision requires seeing the finished trace.
</details>
Common beginner mistakes
These are misconceptions, not symptoms — each one is a wrong mental model that produces a whole class of bugs. (For symptom→fix triage, use the Verify checklist above.)
- “Sampling at 25% means my dashboards are 25% wrong.” No. Each kept row carries
itemCount, and the portal’s metrics multiply by it, so counts and percentiles stay statistically correct. The only way sampling corrupts your numbers is if you write rawcount()in KQL instead ofsum(ItemCount). The dashboard is right; hand-rolled queries are where the error creeps in. - “I’ll enable adaptive sampling like the migration doc says.” Adaptive sampling (
AdaptiveSamplingTelemetryProcessor, target items/sec) is a classic-SDK feature and does not exist in the distro. The distro has exactly one knob,SamplingRatio, and it is fixed-rate. A runbook telling you to configure adaptive sampling onUseAzureMonitor()is stale. - “The instrumentation key is all I need.” The bare instrumentation key is deprecated for ingestion routing. Use the full connection string — it carries the regional ingestion and live endpoints, and a key-only setup can send data to the wrong region or fail outright.
- “My custom spans aren’t showing up, so the SDK is broken.” You almost certainly forgot
AddSource("Your.Source.Name"). AnActivitySourcewhose name is not registered produces activities the SDK never samples — they are dropped silently, no error. - “Each team can pick its own sampling ratio; it’s their budget.” A sampling ratio is a fleet-wide contract. Trace-ID-consistent sampling only holds when every service in a transaction uses the same ratio; mismatched ratios re-create dead-ended edges on the app map and unusable cross-service transactions.
- “I’ll scrub PII with a workspace transformation.” By the time an ingestion-time transformation runs, the PII has already crossed the network to the regional endpoint — which most compliance regimes treat as a disclosure. Redact client-side, in a
BaseProcessor<Activity>, before export. The workspace transformation is a storage/cost tool, not a privacy boundary. - “The daily cap will keep my costs down.” The cap is a circuit breaker, not a budget. Hitting it drops all telemetry until the next UTC day — blinding you at the exact moment something is melting down. Control cost with sampling and table plans; use the cap only as a backstop, with an alert at ~80%.
- “Per-pod
cloud_RoleNamelets me see every replica.” It explodes the application map into thousands of nodes and makes it useless. Name by logical service; letcloud_RoleInstance(theservice.instance.id) carry the replica identity — the map draws nodes from role name, instances from role instance. - “A telemetry processor can drop the spans I don’t want.” A
BaseProcessor<Activity>runs after the sampler has already decided to record the span; it can mutate or enrich, but it cannot un-drop or reliably drop. To stop a span existing, filter at the instrumentation (Filter) or write a customSampler.
Checklist
Glossary
- OpenTelemetry (OTel) — a vendor-neutral, open standard (SDKs + wire protocol) for producing traces, metrics, and logs. Azure Monitor is one backend you can export OTel data to.
- Azure Monitor OpenTelemetry Distro — Microsoft’s opinionated bundle (
Azure.Monitor.OpenTelemetry.AspNetCore) that wires the OTel providers and the Azure Monitor exporter with oneUseAzureMonitor()call. The recommended path; the classic SDK is in maintenance mode. - Span — a single timed operation with a name, duration, status, and attributes. In .NET a span is a
System.Diagnostics.Activity. - Trace — the tree of spans that make up one end-to-end transaction, tied together by a shared trace ID.
Activity/ActivitySource— the .NET runtime types for a span and the named factory that creates spans. A source must be registered withAddSourceto export.ActivityKind—Server,Client,Internal,Producer,Consumer; determines whether a span exports as a request or a dependency.Meter— the .NET type that produces metric instruments (Counter,Histogram,ObservableGauge); the OTel replacement for the classic SDK’s custom metrics.- W3C Trace Context /
traceparent— the standard HTTP header (version-traceid-spanid-flags) that carries the trace and span IDs across service hops so a transaction stitches together. tracestate/ baggage — sibling propagation mechanisms:tracestatecarries vendor data; baggage carries your own key/values (e.g. tenant ID) across every hop. Never put secrets or large values in baggage.- Head sampling — decide keep/drop at the root span, in-process, before work runs. Cheap and consistent, but blind (cannot preferentially keep errors).
SamplingRatiois head sampling. - Tail sampling — decide after the whole trace is buffered, in an OTel Collector, so you can keep “all errors / all slow traces.” Requires a stateful Collector tier and a load-balancing exporter.
- Ingestion sampling — server-side keep/drop at the backend after transmission (a classic-SDK behavior); not used by the distro.
SamplingRatio— the distro’s single sampling knob,0.0–1.0; drives the trace-ID-hashApplicationInsightsSampler.ApplicationInsightsSampler— the trace-ID-based, consistent sampler behindSamplingRatio: the same trace ID makes the same keep/drop decision everywhere the ratio matches.itemCount/ItemCount— the weight stamped on a kept row (1 / ratio). Portal metrics and correct KQL multiply by it to reconstruct the true population; alwayssum(ItemCount), nevercount(), on sampled data.BaseProcessor<Activity>— the OTel pipeline hook (OnStart/OnEnd) that mutates or enriches spans before export; the replacement for the classicITelemetryProcessor/ITelemetryInitializer. It cannot un-drop a sampled-out span.- Resource attribute — static, per-process metadata set via
ConfigureResource().AddService(...);service.nameandservice.instance.idare the important ones. cloud_RoleName/cloud_RoleInstance— the App Insights columns derived fromservice.name(the application-map node) andservice.instance.id(the specific replica).operation_Id/operation_ParentId— the App Insights columns derived from the OTel trace ID (one per transaction) and parent span ID (the caller), which chain spans into the transaction tree.- Application map — the derived topology Azure Monitor draws by grouping telemetry on
cloud_RoleName(nodes) and dependency spans (edges), annotated withitemCount-weighted call and failure rates. - Exemplar — a sample trace ID attached to an aggregated metric bucket, so you can jump from a metric spike to a representative trace. An OTel metrics feature whose Azure Monitor surfacing is still maturing.
- Live Metrics (QuickPulse) — a ~1-second real-time stream over the connection string’s
LiveEndpoint; not sampled and not stored. Toggled by the distro’sEnableLiveMetricsoption. - Workspace-based Application Insights — the current model where telemetry physically lives in a Log Analytics workspace (tables named
App*), with unified RBAC, retention, and cross-source KQL. Classic (non-workspace) resources retired in early 2024. - Log Analytics workspace — the store and query engine behind workspace-based App Insights; hosts
AppRequests,AppDependencies,AppExceptions,AppTraces, and more. - KQL (Kusto Query Language) — the read-only query language for Log Analytics tables.
customDimensions— the dynamic property bag whereactivity.SetTag(...)values land; queried ascustomDimensions.key.- Data collection transformation — a KQL rule applied at ingestion to drop or mask columns; a storage/cost tool that runs after the network hop, so not a PII boundary.
- Table plan (Analytics / Basic) — the per-table billing/capability tier: Analytics (full KQL, alerting, longer retention) vs Basic (cheap, limited KQL, short retention) for high-volume verbose logs.
- Daily cap — the workspace’s hard GB/day ingestion limit; a circuit breaker that drops data until the next UTC day, not a budgeting tool.
- Auto-instrumentation (codeless) — attaching telemetry without code changes (App Service/Functions extension, AKS attach). Convenient, limited, and conflicts with a manual SDK if both run.
- Connection string vs instrumentation key — the connection string carries the regional ingestion and live endpoints and is required; the bare instrumentation key is deprecated for routing.