In a nutshell
If you have ever run Prometheus and Grafana yourself, you know the shape of it: Prometheus scrapes /metrics endpoints on a schedule, stores the samples in a local time-series database, evaluates your recording and alerting rules, and Grafana draws dashboards on top. It works beautifully — until the database fills a disk at 2 a.m., or one bad label multiplies your series count into an out-of-memory crash, or you realise you now own an HA pair, a write-ahead log, and a long-term store that nobody on the team wants to operate.
Azure Monitor managed service for Prometheus is that same stack with the operational half handed to Azure. You still write PromQL, recording rules, alert rules, and Grafana dashboards — the parts that encode what your system means. Azure runs the parts nobody enjoys owning: ingestion, a horizontally scaled store, query, rule evaluation, and 18 months of retention. Think of it as swapping “I run a Prometheus server” for “I configure a Prometheus service.” The scrape config moves from prometheus.yml to a Kubernetes ConfigMap, the storage becomes an Azure Monitor workspace, the rules become Azure resources you deploy like any other infrastructure, and Azure Managed Grafana is a Grafana you log into with your corporate identity instead of a pod you patch.
The mental model to hold onto: nothing about Prometheus’s language changes — only who runs the machine. Your PromQL is identical, your dashboards are portable, and the alerting semantics you already know still apply. What changes is that the control surface is now the Azure CLI, ConfigMaps, and ARM/Bicep instead of a Helm chart and a pile of CRDs you maintain.
Level: Advanced · Time: ~39 min
Prerequisites
- A running AKS cluster you can
az aks update, with yourkubectlcontext set and Contributor (or a scoped custom role) on the cluster’s resource group. - Comfort with core Prometheus concepts — targets, scrape intervals, labels and cardinality, PromQL, recording vs alerting rules. If those are new, learn them on open-source Prometheus first; this lesson is about the Azure wiring, not Prometheus 101.
- Basic Azure RBAC and managed-identity literacy (role assignments, system- vs user-assigned identity) and enough Bicep/ARM to read a resource block. See Azure Monitor, the deep dive on every option and Data Collection Rules, Workbooks, alerting and action groups for the surrounding platform.
After this lesson you can
- Enable the metrics add-on on AKS and explain every workload it deploys and every Azure resource it creates.
- Customise scrape targets and control cardinality through the
ama-metricsConfigMap,PodMonitor/ServiceMonitorCRDs, and raw scrape config. - Wire Azure Managed Grafana to the workspace correctly, keeping the identity RBAC plane and the user RBAC plane straight.
- Author recording and alert rules as
prometheusRuleGroupsand route fired alerts through action groups. - Decide when you need Container Insights (logs) versus managed Prometheus (metrics), and remote-write an existing OSS Prometheus into the workspace during a migration.
- Reason about the cost model — active time series, not metric count — and keep a fleet’s ingestion bill predictable.
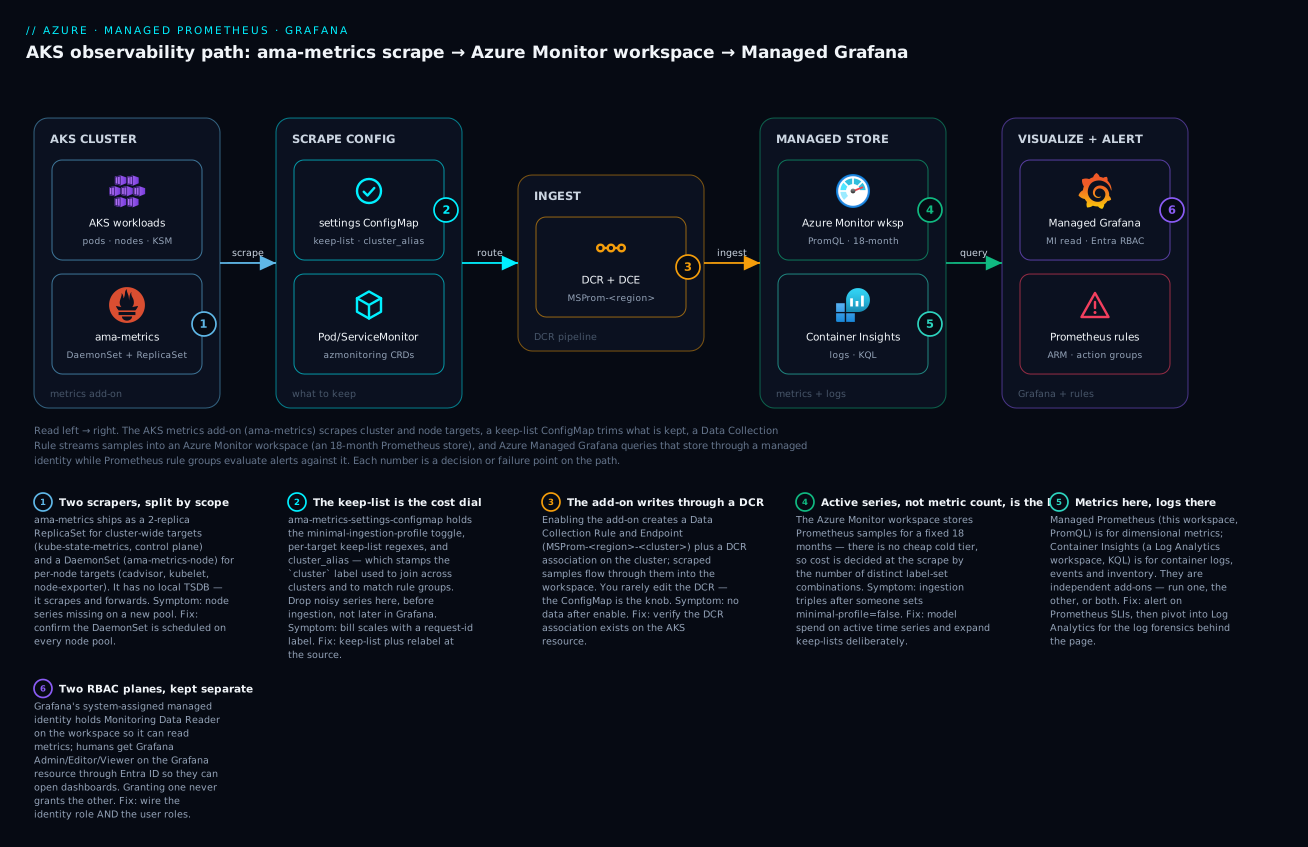
The metrics add-on scrapes AKS, a keep-list ConfigMap decides what is kept, a Data Collection Rule streams the samples into an 18-month Azure Monitor workspace, and Managed Grafana reads them through a managed identity while prometheusRuleGroups evaluate alerts against the same store.
Self-managing Prometheus on Kubernetes means you own the storage, the HA pair, the WAL, the cardinality blast radius, and the 2 a.m. page when the TSDB fills a PVC. Azure Monitor managed service for Prometheus moves ingestion, storage, query, and rule evaluation into a PaaS plane while keeping the parts you want to own: PromQL, recording rules, alert rules, and Grafana dashboards. The catch is that the control surface is no longer prometheus.yml and CRDs. It is a metrics add-on, a Data Collection Rule, an Azure Monitor workspace, a ConfigMap for scrape customization, and ARM resources for rules. This walkthrough wires all of it together correctly, then closes on the cost model that decides whether this is cheaper than running it yourself.
We assume an existing AKS cluster on a managed identity, Azure CLI 2.x, and kubectl context set.
1. Register providers and enable the metrics add-on
Managed Prometheus is delivered by the metrics add-on (the ama-metrics agent), not by Container Insights. They are independent: you can run one, the other, or both. Four resource providers must be registered in the cluster’s subscription before enabling.
for ns in Microsoft.Insights Microsoft.AlertsManagement Microsoft.Monitor Microsoft.Dashboard; do
  az provider register --namespace "$ns"
done
# poll until all report "Registered"
az provider show --namespace Microsoft.Monitor --query registrationState -o tsv
Create (or reference) an Azure Monitor workspace — the Prometheus-native store, distinct from a Log Analytics workspace — then enable the add-on on the cluster, passing both the workspace and a Managed Grafana instance so the data source and dashboards are provisioned for you.
AMW_ID=$(az monitor account create \
  --name amw-platform-prod --resource-group rg-observability \
  --query id -o tsv)

GRAFANA_ID=$(az grafana create \
  --name graf-platform-prod --resource-group rg-observability \
  --query id -o tsv)

az aks update \
  --name aks-platform-prod --resource-group rg-platform \
  --enable-azure-monitor-metrics \
  --azure-monitor-workspace-resource-id "$AMW_ID" \
  --grafana-resource-id "$GRAFANA_ID"
If you previously installed the
aks-previewextension, remove it first withaz extension remove --name aks-preview. A stale preview extension is the single most common cause of--enable-azure-monitor-metricsfailing or silently using old defaults.
You can omit --azure-monitor-workspace-resource-id to land on a default workspace per region, but in a platform setting always pin an explicit workspace you own. Likewise omit --grafana-resource-id if Grafana is managed separately (section 4).
2. What the add-on plumbs: DCR, DCE, and the agent pods
--enable-azure-monitor-metrics is not just a pod install. Behind it Azure creates the data-collection plumbing that routes scraped samples into the workspace.
| Resource | Name pattern | Purpose |
|---|---|---|
| Data Collection Rule | MSProm-<region>-<clusterName> |
Defines the Prometheus stream and the workspace destination. |
| Data Collection Endpoint | MSProm-<region>-<clusterName> |
Regional ingestion endpoint the agent writes to. |
| DCR association | on the cluster | Binds the DCR to the AKS resource. |
The DCR/DCE live in the cluster’s resource group and are managed by the add-on. You rarely edit them directly; the knobs you actually turn live in a ConfigMap (section 3). On the cluster side the add-on deploys a fixed set of workloads in kube-system:
kubectl get pods -n kube-system -l rsName=ama-metrics
kubectl get ds   -n kube-system ama-metrics-node
ama-metrics— a ReplicaSet (2 replicas) that scrapes cluster-wide targets (kube-state-metrics, the control-plane jobs, custom replica jobs).ama-metrics-node— a DaemonSet that scrapes per-node targets (cadvisor,kubelet,node-exporter) so node-local series stay node-local.ama-metrics-ksm— the bundled kube-state-metrics deployment.ama-metrics-operator-targets— reconcilesPodMonitor/ServiceMonitorCRDs and custom scrape config into the collector.
This split matters for cost and correctness: anything node-scoped is sharded across the DaemonSet, while cluster-scoped scrapes are centralized and HA on the ReplicaSet.
3. Customize scrape targets with the ama-metrics ConfigMap
By default the add-on collects a minimal ingestion profile — a curated keep-list per target chosen to power the built-in dashboards and recording rules without exploding your series count. To change what is scraped, apply ama-metrics-settings-configmap in kube-system. It does not exist until you create it; the absence of the ConfigMap means “use defaults.”
Schema note: the current ConfigMap is schema v2. Target settings are split into two top-level sections,
cluster-metricsandcontrolplane-metrics, so you can govern node/cluster ingestion separately from control-plane ingestion. Older guides using a single flatdefault-scrape-settings-enabledare v1 — do not mix them.
apiVersion: v1
kind: ConfigMap
metadata:
  name: ama-metrics-settings-configmap
  namespace: kube-system
data:
  prometheus-collector-settings: |-
    cluster_alias = "platform-prod-eastus"
  cluster-metrics: |-
    default-targets-scrape-enabled: |-
      kubelet = true
      cadvisor = true
      kube-state-metrics = true
      nodeexporter = true
      coredns = false
      kubeproxy = false
    default-targets-scrape-interval-settings: |-
      kubelet = "30s"
      cadvisor = "60s"
    minimal-ingestion-profile: |-
      enabled = true
    default-targets-metrics-keep-list: |-
      kubelet = "kubelet_volume_stats_available_bytes|kubelet_volume_stats_capacity_bytes"
      kube-state-metrics = ".*"
  controlplane-metrics: |-
    default-targets-scrape-enabled: |-
      apiserver = true
      etcd = false
Three levers do almost all the work:
cluster_aliasrewrites theclusterlabel on every series from this cluster. Set it deliberately — it is the join key across clusters in one workspace, and it must match theclusterNameyou put on rule groups later (section 5). If you set an alias here and forget it there, your cluster-scoped rules evaluate against nothing.minimal-ingestion-profile: enabled = truekeeps you on the curated keep-list. Setfalseonly when you truly need full metrics from a default target; it can multiply that target’s series count.default-targets-metrics-keep-listis a per-target regex of metric names to keep. This is your primary cardinality control for built-in targets — drop here, not downstream.
Apply it and watch the agent reload:
kubectl apply -f ama-metrics-settings-configmap.yaml
# ama-metrics pods pick up changes and restart within ~2-3 minutes
kubectl rollout status deploy/ama-metrics -n kube-system
For your own apps, the cleanest path is the Prometheus operator CRDs the add-on already watches. A PodMonitor is scraped without touching any ConfigMap:
apiVersion: azmonitoring.coreos.com/v1
kind: PodMonitor
metadata:
  name: checkout-api
  namespace: payments
spec:
  selector:
    matchLabels:
      app: checkout-api
  podMetricsEndpoints:
    - port: metrics
      interval: 30s
Note the API group azmonitoring.coreos.com/v1 — the add-on ships its own CRDs so it can coexist with a real Prometheus operator without colliding on monitoring.coreos.com. For static or kubernetes_sd targets that do not fit CRDs, drop a raw Prometheus config under the key prometheus-config in the ama-metrics-prometheus-config ConfigMap; the supported discovery methods there are static_configs and kubernetes_sd_configs.
4. Connect Azure Managed Grafana with managed identity and RBAC
If you passed --grafana-resource-id in section 1, the data source and Kubernetes dashboards already exist. The mechanism underneath is worth understanding because it is also how you connect Grafana created out-of-band.
Grafana queries the Azure Monitor workspace using its own system-assigned managed identity, which must hold the Monitoring Data Reader role on the workspace. There is no API key, no bearer token to rotate.
GRAFANA_MI=$(az grafana show --name graf-platform-prod \
  --resource-group rg-observability \
  --query identity.principalId -o tsv)

az role assignment create \
  --assignee "$GRAFANA_MI" \
  --role "Monitoring Data Reader" \
  --scope "$AMW_ID"
Then attach the workspace (idempotent if the add-on already did it):
az grafana update \
  --name graf-platform-prod --resource-group rg-observability \
  --azure-monitor-workspaces "$AMW_ID"
Human and pipeline access is a separate RBAC plane. Logging into the Grafana UI is governed by Azure built-in roles on the Grafana resource, mapped to Grafana org roles, all backed by Microsoft Entra ID. Assign the least-privilege role that fits:
| Azure role | Grafana capability | Role definition ID |
|---|---|---|
| Grafana Admin | Manage data sources, dashboards, and role assignments | 22926164-76b3-42b3-bc55-97df8dab3e41 |
| Grafana Editor | View and edit dashboards and alerts | a79a5197-3a5c-4973-a920-486035ffd60f |
| Grafana Viewer | Read-only dashboards and alerts | 60921a7e-fef1-4a43-9b16-a26c52ad4769 |
# Grant an Entra group read-only dashboard access
az role assignment create \
  --assignee "<group-object-id>" \
  --role "Grafana Viewer" \
  --scope "$GRAFANA_ID"
Keep the two planes straight: the managed identity reads metrics from the workspace (Monitoring Data Reader on the AMW); users read dashboards (Grafana Viewer/Editor/Admin on the Grafana resource). Granting a user Monitoring Data Reader does not let them open Grafana, and granting Grafana Admin does not let the identity query the workspace.
5. Recording and alert rules as ARM/Bicep
This is where managed Prometheus diverges most from open source. Rules are not loaded from rule files on disk. A rule group is an Azure resource — Microsoft.AlertsManagement/prometheusRuleGroups — evaluated by the managed service against your workspace. That means rules are governed exactly like the rest of your infrastructure: Bicep in a repo, deployed through a pipeline, diffed in PRs.
The shape mirrors open-source rule groups (a group has an interval and an ordered rules[] of record or alert entries) but adds Azure semantics: scopes (which workspace, optionally which cluster), clusterName, alert severity, auto-resolution, and actions pointing at action groups.
@description('Azure Monitor workspace resource ID')
param amwId string
@description('AKS cluster resource ID')
param clusterId string
@description('Action group resource ID for paging')
param actionGroupId string
param location string = resourceGroup().location

resource platformRules 'Microsoft.AlertsManagement/prometheusRuleGroups@2023-03-01' = {
  name: 'platform-prod-rules'
  location: location
  properties: {
    description: 'Recording + alert rules for platform-prod'
    scopes: [
      amwId
      clusterId
    ]
    clusterName: 'platform-prod-eastus'   // MUST match cluster_alias from section 3
    interval: 'PT1M'
    rules: [
      // --- recording rule: precompute per-node CPU utilisation ---
      {
        record: 'instance:node_cpu_utilisation:rate5m'
        expression: '1 - avg without (cpu) (sum without (mode)(rate(node_cpu_seconds_total{job="node", mode=~"idle|iowait|steal"}[5m])))'
        labels: {
          source: 'platform-recording'
        }
        enabled: true
      }
      // --- alert rule: pods stuck not-ready ---
      {
        alert: 'KubePodNotReady'
        expression: 'sum by (namespace, pod, cluster) (max by (namespace, pod, cluster) (kube_pod_status_phase{job="kube-state-metrics", phase=~"Pending|Unknown"}) * on(namespace, pod, cluster) group_left(owner_kind) topk by(namespace, pod, cluster) (1, max by(namespace, pod, owner_kind, cluster)(kube_pod_owner{owner_kind!="Job"}))) > 0'
        for: 'PT15M'
        severity: 2
        labels: {
          team: 'platform'
        }
        annotations: {
          summary: 'Pod has been in a non-ready state for more than 15 minutes.'
          description: 'Namespace {{ $labels.namespace }} pod {{ $labels.pod }} is not ready.'
        }
        resolveConfiguration: {
          autoResolved: true
          timeToResolve: 'PT10M'
        }
        actions: [
          {
            actionGroupId: actionGroupId
          }
        ]
        enabled: true
      }
    ]
  }
}
Several properties carry sharp edges:
scopesmust include the workspace ID. Adding the cluster ID narrows evaluation to one cluster; this is how you avoid running one rule set against every cluster’s data in a shared workspace and tripping query throttling.clusterNamemust equalcluster_alias. The managed service filters cluster-scoped rules by theclusterlabel. If you set an alias in the ConfigMap, that string — not the AKS resource name — is what belongs here. Mismatch = rules that fire on nothing.severityis 0–4 (0 critical, 4 verbose; default 3). It maps to Azure Monitor alert severity, which your action-group routing and on-call tooling key off.- Recording rules feed back in.
instance:node_cpu_utilisation:rate5mis ingested as a new series and is queryable from Grafana and from other rules — same as OSS, billed as ingested samples.
If you already maintain OSS rule YAML, you do not have to hand-translate it: the az-prom-rules-converter utility takes a standard Prometheus rules file plus the Azure metadata (subscription, RG, workspace, cluster, action groups) and emits a deployable ARM template.
6. Route Prometheus alerts through action groups
A fired alert from a managed Prometheus rule is a first-class Azure Monitor alert. Notification and integration are therefore delegated to action groups, the same primitive used by metric and log alerts — which is the real payoff: one notification fabric (PagerDuty, email, webhook, Logic App, Teams, Functions) across every alert source.
resource pagePlatform 'Microsoft.Insights/actionGroups@2023-01-01' = {
  name: 'ag-platform-oncall'
  location: 'global'
  properties: {
    groupShortName: 'platOncall'
    enabled: true
    emailReceivers: [
      {
        name: 'platform-dl'
        emailAddress: 'platform-oncall@example.com'
        useCommonAlertSchema: true
      }
    ]
    webhookReceivers: [
      {
        name: 'pagerduty'
        serviceUri: 'https://events.pagerduty.com/integration/<key>/enqueue'
        useCommonAlertSchema: true
      }
    ]
  }
}
Reference pagePlatform.id as the actionGroupId in the rule group from section 5. Set useCommonAlertSchema: true so every receiver gets the normalized Common Alert Schema payload — webhooks parse one shape regardless of source. An alert rule can list multiple action groups; route by severity (page on severity <= 1, ticket-only on severity >= 3) by pointing those rules at different groups.
Verify
Confirm each layer independently, top of stack to bottom.
# 1. Agent healthy and scraping
kubectl get pods -n kube-system -l rsName=ama-metrics
kubectl get ds   -n kube-system ama-metrics-node
# transient agent issues surface in logs
kubectl logs -n kube-system -l rsName=ama-metrics -c prometheus-collector --tail=50

# 2. DCR association exists on the cluster
az monitor data-collection rule association list \
  --resource "$(az aks show -n aks-platform-prod -g rg-platform --query id -o tsv)" \
  --query "[].name" -o tsv

# 3. Rule group deployed and enabled
az alerts-management prometheus-rule-group show \
  --name platform-prod-rules --resource-group rg-observability \
  --query "{enabled:enabled, rules:length(rules)}" -o table
For the data path, open Grafana and run a query in Explore against the Managed Prometheus data source — up should return your scraped jobs, and instance:node_cpu_utilisation:rate5m should return your recording rule’s output (proof rules are evaluating). You can also confirm ingestion from the workspace side with a PromQL query in the Azure portal’s metrics explorer for the Azure Monitor workspace. To verify alert routing without waiting for a real incident, temporarily lower an alert’s threshold so it fires, watch it appear under Monitor > Alerts, and confirm the action group delivered.
Enterprise scenario
A platform team ran one shared Azure Monitor workspace behind 40+ AKS clusters to keep Grafana and rule management centralized. Within weeks, ingestion costs roughly tripled versus their old self-hosted Prometheus, and cluster-scoped alert rules began flapping into a Degraded resource-health state. Two root causes, both structural.
First, cardinality. Several teams had set minimal-ingestion-profile: enabled = false to “see everything,” and a few apps emitted a per-request-ID label. Active time series — the real cost driver — ballooned. Second, rule evaluation. Every rule group scoped only to the workspace re-scanned all 40 clusters’ data each minute, and the heavy kube_pod_owner join was throttled at that volume, which is exactly what the Degraded health state was reporting.
The fix was to treat ingestion and evaluation as governed surfaces, not defaults. They enforced the minimal profile and per-target keep-lists through a baseline ConfigMap shipped by their cluster bootstrap, and dropped the offending high-cardinality label at the source. For rules, they generated one rule group per cluster, each pinned to that cluster via both scopes and clusterName, so a rule only ever scanned one cluster’s series. A small Bicep loop produced all of them from a single rule definition:
param clusters array   // [{ name: 'platform-prod-eastus', id: '/subscriptions/.../managedClusters/...' }]

resource perClusterRules 'Microsoft.AlertsManagement/prometheusRuleGroups@2023-03-01' = [for c in clusters: {
  name: 'rules-${c.name}'
  location: location
  properties: {
    scopes: [ amwId, c.id ]
    clusterName: c.name
    interval: 'PT1M'
    rules: sharedRuleSet   // identical PromQL, scoped per cluster
  }
}]
Throttling disappeared because no single group spanned all clusters, and ingestion dropped by more than half once the keep-lists and the dropped label took effect — without losing a single dashboard or alert.
Checklist
Cost model: samples, retention, and active time series
Managed Prometheus bills on two axes that you must reason about separately, because they are optimized by different levers.
| Dimension | What it is | Primary lever |
|---|---|---|
| Ingested samples | Every datapoint written: series x (60s / scrape_interval) x time |
Scrape interval, keep-lists, target enable/disable |
| Query | Samples processed by rule evaluation and dashboard/API queries | Rule scoping, dashboard refresh, query breadth |
Retention is effectively fixed (managed Prometheus stores metrics for 18 months), so unlike self-hosted Prometheus or Mimir you do not tune storage class or block retention — you tune what you ingest in the first place. That reframes optimization: there is no cheap long-term tier to lean on, so the cost is decided at the scrape.
The dominant variable is active time series — distinct label-set combinations being written. Cost scales with series count far more than with raw metric count, because one metric with a high-cardinality label (a request ID, a full URL, a pod-hash gone wrong) is thousands of series. Practical controls, in order of impact:
- Stay on the minimal ingestion profile and expand keep-lists deliberately. Flipping
minimal-ingestion-profiletofalseacross fleets is the most expensive single mistake. - Kill cardinality at the source. Drop unbounded labels via
metric_relabel_configsin custom scrape config, or fix the instrumentation. Akeep-listfilters by metric name; it does not save you from a bad label on a metric you do want. - Right-size scrape intervals. 60s instead of 30s halves the sample volume for a target with no loss for slow-moving gauges. Reserve 30s for things you alert on at tight windows.
- Disable targets you do not use (
kubeproxy,etcd,corednsare off by default for a reason) and shard correctly — node targets on the DaemonSet, cluster targets on the ReplicaSet. - Scope rule groups per cluster in shared workspaces. This is a query-cost and throttling control, not an ingestion one, but in a busy workspace it is the difference between rules that evaluate and rules that sit
Degraded.
The honest comparison: managed Prometheus is rarely the cheapest option at low scale, where a single self-hosted Prometheus on a spot node costs almost nothing. It wins on total cost of ownership at fleet scale — no storage to operate, no HA pair to babysit, 18-month retention for free, and rules and dashboards governed as Azure resources. Model it on your active series, not on metric counts, and the line item stays a line item instead of becoming the crisis you adopted PaaS to avoid.
Going deeper
The six sections above are the happy path. This section is for the reader who has to operate the thing: what the agent really is, the three tiers of scrape control, the sharp edges in rules, dashboards-as-code, when logs beat metrics, migrating an existing Prometheus, and the version caveats that bite in production.
The add-on is a collector, not a Prometheus server
The most useful thing to internalise: ama-metrics has no local time-series database. It is a Prometheus-compatible collector (built on the OpenTelemetry collector and Prometheus scrape libraries) that discovers targets, scrapes them, applies your keep-lists and relabels, and immediately forwards the samples to the Data Collection Endpoint. There is no WAL on the cluster, no block compaction, no PVC that fills. That single architectural fact is why the 2 a.m. “TSDB full” page disappears — there is nothing on the cluster to fill. The two replicas of the ReplicaSet exist for scrape HA and sharding of cluster-wide targets, not for storage replication.
Because it is still a Prometheus scraper under the hood, it exposes the familiar debugging surface. Enable the collector’s debug mode (a debug-mode setting in ama-metrics-settings-configmap) and port-forward port 9090 of an ama-metrics pod to reach a /targets and /config view that shows exactly what the agent discovered, what it kept, and any scrape errors — the same page you would open on OSS Prometheus:
POD=$(kubectl get pod -n kube-system -l rsName=ama-metrics -o name | head -1)
kubectl port-forward -n kube-system "$POD" 9090:9090
# then browse http://localhost:9090/targets  and  /config
When a scrape “silently does nothing,” this view answers it in seconds: target not discovered (selector/label mismatch), target discovered but dropped by a keep-list, or target scraped but erroring (TLS, auth, wrong port). It is the single best troubleshooting tool the add-on gives you, and most people never learn it exists.
One more control worth knowing at enable time: kube-state-metrics label and annotation allow-lists. KSM only exposes the pod/workload labels and annotations you explicitly allow-list, which is a direct cardinality lever on the busiest target in the cluster:
az aks update -n aks-platform-prod -g rg-platform \
  --enable-azure-monitor-metrics \
  --ksm-metric-labels-allow-list "pods=[app,team],deployments=[app]" \
  --ksm-metric-annotations-allow-list "pods=[kubernetes.io/created-by]"
Leave these empty and your PromQL joins on label_* come back empty; open them too wide and every deploy annotation becomes a new series.
Three tiers of scrape control — pick the lowest one that fits
There are three distinct ways to tell the add-on what to scrape, and mixing them up is a common source of “why is this metric missing / duplicated.”
| Tier | Mechanism | Use it for | Reloads via |
|---|---|---|---|
| Built-in targets | ama-metrics-settings-configmap toggles + keep-lists |
kubelet, cadvisor, KSM, node-exporter, control plane | ConfigMap apply (~2–3 min) |
| Your workloads (declarative) | PodMonitor / ServiceMonitor (azmonitoring.coreos.com/v1) |
apps you own that expose /metrics |
CRD apply, watched live |
| Anything else (imperative) | raw prometheus-config in ama-metrics-prometheus-config |
static targets, kubernetes_sd, legacy exporters, relabel gymnastics |
ConfigMap apply |
Prefer CRDs for your own apps — they are declarative, namespaced, and survive add-on upgrades cleanly. A ServiceMonitor selects Services (a PodMonitor selects Pods directly) and is where you attach relabel and metric-relabel rules:
apiVersion: azmonitoring.coreos.com/v1
kind: ServiceMonitor
metadata:
  name: checkout-api
  namespace: payments
spec:
  labelLimit: 63
  selector:
    matchLabels:
      app: checkout-api
  endpoints:
    - port: metrics
      interval: 30s
      relabelings:
        - sourceLabels: [__meta_kubernetes_pod_node_name]
          targetLabel: instance
      metricRelabelings:
        - sourceLabels: [__name__]
          regex: "go_gc_duration_seconds.*"
          action: drop
Drop to raw config only when CRDs cannot express the target. This is also where you win the cardinality war — a labeldrop in metric_relabel_configs removes an unbounded label at ingest, before it is ever billed:
apiVersion: v1
kind: ConfigMap
metadata:
  name: ama-metrics-prometheus-config
  namespace: kube-system
data:
  prometheus-config: |-
    scrape_configs:
      - job_name: legacy-exporter
        scrape_interval: 60s
        kubernetes_sd_configs:
          - role: pod
        relabel_configs:
          - source_labels: [__meta_kubernetes_pod_label_app]
            regex: legacy-exporter
            action: keep
        metric_relabel_configs:
          # kill high-cardinality labels at ingest — cheaper than any downstream fix
          - regex: (request_id|session_id|trace_id)
            action: labeldrop
Remember the distinction that trips everyone up: a keep-list filters by metric name; metric_relabel_configs with labeldrop filters by label. A noisy label on a metric you want to keep is only solvable with the second one.
Rules: the edges beyond the basic shape
Section 5 covered the resource. In production the sharp edges are subtler:
- Durations are ISO 8601, not Prometheus shorthand.
interval: 'PT1M',for: 'PT15M',timeToResolve: 'PT10M'. Writing1m/15m(valid in OSS rule files) is a deploy-time error here. This is the number-one gotcha when hand-porting rules. - Recording rules evaluate in group order. Within a group, rules run top to bottom each interval, so a later rule may reference an earlier rule’s recorded series — same chaining semantics as OSS. Ordering across groups is not guaranteed, so keep a dependency chain inside one group.
- Rule evaluation is billed as query. A heavy join (the
kube_pod_ownerexample) re-runs everyintervalagainst the workspace. In a shared workspace, an unscoped group multiplies that by cluster count — which is the throttling failure from the enterprise scenario. Scope narrows both correctness and cost. enabledexists at both levels. You can disable a whole group or an individual rule; prefer per-ruleenabled: falsewhen silencing one noisy alert so the rest of the group keeps evaluating.
The OSS-to-ARM field mapping, for when you are porting a rules.yml:
| OSS Prometheus rule file | prometheusRuleGroups (ARM/Bicep) |
|---|---|
groups[].name |
resource name |
groups[].interval: 1m |
properties.interval: 'PT1M' (ISO 8601) |
rules[].record / expr |
rules[].record / expression |
rules[].alert / for: 15m |
rules[].alert / for: 'PT15M' |
labels / annotations |
labels / annotations (unchanged) |
| (no equivalent) | severity 0–4, resolveConfiguration, actions[] |
| rule files on disk, hot-reloaded | one ARM resource, deployed through a pipeline |
Azure Managed Grafana: data source, and dashboards-as-code
The identity wiring in section 4 is the load-bearing half. The other half is treating dashboards as code so they are reviewable and reproducible rather than hand-edited in the UI (where the next az grafana reconcile or a wrong click loses them).
First, a gotcha that blocks people on the very first command: az grafana is not in the core CLI — it ships in the amg extension. Install it once:
az extension add --name amg # 'az grafana' lives here; without it you get "command not found"
Then push a dashboard JSON model into managed Grafana, keyed by its uid so the push is idempotent:
az grafana dashboard create \
  --name graf-platform-prod --resource-group rg-observability \
  --definition @platform-golden.json --overwrite true
For a fuller GitOps flow, point the Grafana Terraform provider at the managed endpoint (authenticated with your Entra token) and manage grafana_dashboard / grafana_folder resources in the same repo as your Bicep — dashboards, folders, and alert-contact points reviewed in PRs alongside the infrastructure they visualise. Because the query language is plain PromQL, the same dashboard JSON works against OSS Prometheus and managed Prometheus, which is what makes the migration below low-risk.
Two operational notes: pin the Grafana major version on the resource so a platform upgrade never surprises a dashboard, and if the workspace and Grafana must not traverse the public internet, put both behind an Azure Monitor Private Link Scope (AMPLS) and use Grafana’s managed private endpoint — private ingestion and query are opt-in, not the default.
Container Insights (logs) vs managed Prometheus (metrics) — you usually want both
They are different add-ons answering different questions, and it is worth being deliberate about which does what:
| Managed Prometheus | Container Insights | |
|---|---|---|
| Store | Azure Monitor workspace | Log Analytics workspace |
| Query language | PromQL | KQL |
| Best at | dimensional metrics, SLIs, alerting, Grafana | container logs (stdout/stderr), events, inventory, forensics |
| Cost axis | active time series | GB ingested |
| Retention | fixed 18 months | configurable, cost-tiered |
| Enable | --enable-azure-monitor-metrics |
--enable-addons monitoring |
The rule of thumb: alert on Prometheus, investigate in Container Insights. A Prometheus alert tells you that checkout error-rate crossed an SLO; the pod’s stdout in Log Analytics tells you why. Most production clusters run both. One cost trap to avoid the double-pay: Container Insights historically collected its own performance metrics into Log Analytics, which now overlap with what Prometheus gives you — tune the Container Insights data-collection settings (namespace filtering, interval, or turning off the overlapping perf metrics) so you are not paying to store CPU/memory twice, once as logs and once as series.
Remote-write and the OSS-to-managed migration
You do not have to cut over in one night. The Azure Monitor workspace exposes a remote-write ingestion endpoint, so an existing OSS Prometheus can dual-write into it during a migration. Point the OSS server’s remote_write at the DCE endpoint and authenticate with Entra ID (a user-assigned managed identity, or an app registration):
remote_write:
  - url: "https://<amw-metrics-ingestion-endpoint>/dataCollectionRules/<dcr-immutable-id>/streams/Microsoft-PrometheusMetrics/api/v1/write?api-version=2023-04-24"
    azuread:
      cloud: AzurePublic
      managed_identity:
        client_id: "<user-assigned-mi-client-id>"
    write_relabel_configs:
      - source_labels: [__name__]
        regex: "up|kube_pod_status_phase|node_cpu_seconds_total"
        action: keep
A safe, boring migration order:
- Stand up the Azure Monitor workspace + metrics add-on (or Grafana) alongside the running OSS Prometheus — both collect in parallel.
- Dual-write the OSS server into the workspace via
remote_write(or just let the add-on scrape independently). Now the same data lands in both stores. - Port the rules with
az-prom-rules-converter, deploy them asprometheusRuleGroupsBicep, and confirm the recording rules produce identical series. - Repoint Grafana at the managed data source. Dashboards are portable — same PromQL — so this is a data-source swap, not a rebuild.
- Verify parity by comparing a handful of queries across both stores, then retire the OSS server and its storage.
The write_relabel_configs keep above is not cosmetic: during dual-run you are paying for ingestion twice, so trim the remote-write stream to what you actually need in the managed store while the OSS server keeps its full fidelity until cutover.
Version, API, and failure-mode caveats
- CRD group is
azmonitoring.coreos.com/v1, notmonitoring.coreos.com. The add-on ships its own CRDs; applying prometheus-operator’s community CRDs and expecting the add-on to read them will silently collect nothing. The two groups can coexist if you also run a real operator. - ConfigMap is schema v2 (
cluster-metrics/controlplane-metrics). Do not mix in the flat v1default-scrape-settings-enabledkeys from older blogs. prometheusRuleGroupsAPI2023-03-01is the stable version used above; ISO 8601 durations throughout.- Disabling the add-on does not clean up.
az aks update --disable-azure-monitor-metricsremoves the agents but leaves the Azure Monitor workspace, the DCR/DCE, and any rule groups — delete those separately or they keep billing and cluttering the resource group. - Private ingestion/query is opt-in. Without an AMPLS, ingestion and Grafana query traverse public endpoints (still authenticated) — fine for many, a compliance blocker for some.
- The failure modes almost always trace to one of four things: a missing DCR association (no data at all), an
cluster_alias↔clusterNamemismatch (rules fire on nothing),minimal-ingestion-profile: falsefleet-wide (cost blowout), or an empty KSM allow-list (empty label joins). Check those first.
Practice challenges
Work these on a non-production AKS cluster you can safely enable and disable the add-on on. Each solution lists the commands or manifest plus a one-line why.
<details> <summary><strong>Challenge 1 (beginner) — Enable managed Prometheus against a workspace you own, and prove the agents are running.</strong></summary>
Register the providers, create an Azure Monitor workspace, enable the add-on with an explicit workspace ID, then confirm both scraper workloads are healthy.
for ns in Microsoft.Insights Microsoft.AlertsManagement Microsoft.Monitor Microsoft.Dashboard; do
  az provider register --namespace "$ns"
done
AMW_ID=$(az monitor account create -n amw-lab -g rg-lab --query id -o tsv)
az aks update -n aks-lab -g rg-lab \
  --enable-azure-monitor-metrics \
  --azure-monitor-workspace-resource-id "$AMW_ID"

kubectl get pods -n kube-system -l rsName=ama-metrics   # ReplicaSet (2)
kubectl get ds   -n kube-system ama-metrics-node        # DaemonSet (per node)
Why: pinning the workspace (not the regional default) is the platform-correct habit, and seeing both the ReplicaSet and the DaemonSet confirms cluster-wide and per-node scraping are live. </details>
<details> <summary><strong>Challenge 2 (beginner) — Set a cluster alias and a keep-list, and confirm the agent reloaded.</strong></summary>
Create ama-metrics-settings-configmap with a deliberate cluster_alias and a trimmed kubelet keep-list, apply it, and watch the rollout.
apiVersion: v1
kind: ConfigMap
metadata:
  name: ama-metrics-settings-configmap
  namespace: kube-system
data:
  prometheus-collector-settings: |-
    cluster_alias = "lab-eastus"
  cluster-metrics: |-
    minimal-ingestion-profile: |-
      enabled = true
    default-targets-metrics-keep-list: |-
      kubelet = "kubelet_volume_stats_available_bytes|kubelet_volume_stats_capacity_bytes"
kubectl apply -f ama-metrics-settings-configmap.yaml
kubectl rollout status deploy/ama-metrics -n kube-system
Why: cluster_alias becomes the cluster label — the value you must reuse as clusterName on rule groups — and the keep-list is your first, cheapest cardinality control.
</details>
<details> <summary><strong>Challenge 3 (intermediate) — Scrape one of your own apps with a ServiceMonitor and confirm it in the live targets view.</strong></summary>
Apply a ServiceMonitor (add-on CRD group), then use the debug port-forward to verify the target is discovered and up.
apiVersion: azmonitoring.coreos.com/v1
kind: ServiceMonitor
metadata:
  name: checkout-api
  namespace: payments
spec:
  selector:
    matchLabels:
      app: checkout-api
  endpoints:
    - port: metrics
      interval: 30s
POD=$(kubectl get pod -n kube-system -l rsName=ama-metrics -o name | head -1)
kubectl port-forward -n kube-system "$POD" 9090:9090
# browse http://localhost:9090/targets — checkout-api should be UP
Why: CRDs are the declarative, upgrade-safe way to scrape your own apps, and the /targets view is the fastest answer to “why isn’t my metric showing up” (discovered? kept? erroring?).
</details>
<details> <summary><strong>Challenge 4 (intermediate) — Deploy a recording rule and an alert as a per-cluster rule group, then prove the recording rule evaluates.</strong></summary>
Deploy a prometheusRuleGroups resource scoped to one cluster (both scopes and clusterName), with a recording rule and an alert, then query the recorded series in Grafana Explore.
resource labRules 'Microsoft.AlertsManagement/prometheusRuleGroups@2023-03-01' = {
  name: 'lab-rules'
  location: location
  properties: {
    scopes: [ amwId, clusterId ]
    clusterName: 'lab-eastus'          // MUST equal cluster_alias
    interval: 'PT1M'
    rules: [
      { record: 'job:up:count', expression: 'count by (job) (up)', enabled: true }
      {
        alert: 'TargetDown'
        expression: 'up == 0'
        for: 'PT5M'
        severity: 3
        enabled: true
      }
    ]
  }
}
Then in Grafana Explore run job:up:count — non-empty output proves the rule is evaluating.
Why: scoping to one cluster is the throttling/cost control, clusterName must match the alias or the rule matches nothing, and a queryable recorded series is the only real proof rules run.
</details>
<details> <summary><strong>Challenge 5 (advanced) — Wire a Grafana created out-of-band to the workspace: identity plane AND user plane, plus a dashboard-as-code.</strong></summary>
Grant Grafana’s managed identity read access to the workspace, grant a group UI access, then push a dashboard JSON.
# identity plane — Grafana MI reads metrics
GRAFANA_MI=$(az grafana show -n graf-lab -g rg-lab --query identity.principalId -o tsv)
az role assignment create --assignee "$GRAFANA_MI" \
  --role "Monitoring Data Reader" --scope "$AMW_ID"
az grafana update -n graf-lab -g rg-lab --azure-monitor-workspaces "$AMW_ID"

# user plane — humans open dashboards
az role assignment create --assignee "<group-object-id>" \
  --role "Grafana Viewer" --scope "$(az grafana show -n graf-lab -g rg-lab --query id -o tsv)"

# dashboard-as-code (amg extension)
az extension add --name amg
az grafana dashboard create -n graf-lab -g rg-lab \
  --definition @lab-golden.json --overwrite true
Why: this is the exam question of the whole lesson — the identity reads metrics (Monitoring Data Reader on the AMW) and users read dashboards (Grafana Viewer on the Grafana resource); granting one never grants the other. </details>
<details> <summary><strong>Challenge 6 (advanced) — Dual-run an existing OSS Prometheus into the workspace via remote-write, and convert one rule file.</strong></summary>
Add an Entra-authenticated remote_write block to your OSS Prometheus so it dual-writes into the managed store, and convert an existing rules.yml to a deployable ARM template.
remote_write:
  - url: "https://<amw-ingestion-endpoint>/dataCollectionRules/<dcr-immutable-id>/streams/Microsoft-PrometheusMetrics/api/v1/write?api-version=2023-04-24"
    azuread:
      cloud: AzurePublic
      managed_identity:
        client_id: "<user-assigned-mi-client-id>"
# convert existing OSS recording/alerting rules to prometheusRuleGroups ARM
az-prom-rules-converter \
  --rule-file rules.yml \
  --subscription-id "<subscription-id>" \
  --resource-group rg-observability \
  --azure-monitor-workspace "$AMW_ID" \
  --cluster-name lab-eastus \
  --output rules.arm.json
Why: remote-write lets both stores hold the same data during cutover so you can verify parity before retiring the OSS server, and the converter saves you from hand-porting for:/interval: into ISO 8601 durations.
</details>
Common beginner mistakes
- “The add-on stores metrics on the cluster, like Prometheus does.” It does not —
ama-metricsis a collector with no local TSDB; it scrapes and forwards to the Azure Monitor workspace. Right model: there is nothing on the cluster to fill up, and all storage/retention questions are answered by the workspace, not by a PVC. - “Azure Monitor workspace and Log Analytics workspace are the same thing.” Two different resources. The Azure Monitor workspace is the Prometheus-native, PromQL store; the Log Analytics workspace is the logs/KQL store used by Container Insights. Enabling one does not create the other. Right model: metrics land in the AMW, logs land in the LAW.
- “I’ll just apply my existing prometheus-operator
ServiceMonitors.” The add-on watchesazmonitoring.coreos.com, not the communitymonitoring.coreos.com. Community CRDs will be ignored. Right model: change theapiVersiongroup (the spec fields are the same). - “Rules go in a
rules.ymlfile mounted into the pod.” There are no on-disk rule files here. Rules areMicrosoft.AlertsManagement/prometheusRuleGroupsAzure resources. Right model: rules are infrastructure — Bicep in a repo, deployed through a pipeline. - “
clusterNameis the AKS resource name.” It is the value ofcluster_aliasfrom the ConfigMap (which becomes theclusterlabel). If you set an alias and then use the resource name on the rule group, the rule filters to a cluster label that does not exist and fires on nothing. Right model: alias andclusterNameare the same string, chosen by you. - “Granting a user Monitoring Data Reader lets them open Grafana.” No — that role lets an identity read the workspace. Humans need Grafana Viewer/Editor/Admin on the Grafana resource. Right model: two independent RBAC planes, wire both.
- “Set
minimal-ingestion-profile: falseso we can see everything.” This is the classic fleet-wide cost blowout; it removes the curated keep-list from every default target at once. Right model: stay on the minimal profile and widen specific keep-lists only where you have a concrete need. - “
az grafanadoesn’t exist, so managed Grafana must not support CLI.” It lives in theamgextension —az extension add --name amg. Right model: some Azure services ship their CLI surface as an extension. - “Durations use Prometheus shorthand like
15m.” In ARM/Bicep rule groups they are ISO 8601 —PT15M,PT1M,PT10M. Writing15mis a deploy error. Right model: ISO 8601 for every duration on the Azure side. - “Removing the add-on cleans everything up.”
--disable-azure-monitor-metricsremoves the agents but leaves the workspace, DCR/DCE, and rule groups billing quietly. Right model: decommission the Azure resources explicitly.
Glossary
- Azure Monitor managed service for Prometheus — the PaaS that ingests, stores, queries, and evaluates rules over Prometheus metrics, so you run PromQL and rules without operating a Prometheus server.
- Azure Monitor workspace (AMW) — the Prometheus-native store the add-on writes to. Distinct from a Log Analytics workspace; queried with PromQL; 18-month retention.
- Metrics add-on /
ama-metrics— the agent installed by--enable-azure-monitor-metrics. A Prometheus-compatible collector (no local TSDB) that scrapes targets and forwards samples to the workspace. ama-metricsReplicaSet vsama-metrics-nodeDaemonSet — the ReplicaSet (2 replicas) scrapes cluster-wide targets (KSM, control plane); the DaemonSet scrapes per-node targets (cadvisor, kubelet, node-exporter) so node series stay node-local.- Container Insights — the separate AKS add-on that sends container logs, events, and inventory to a Log Analytics workspace (queried with KQL). Independent of managed Prometheus.
- Log Analytics workspace (LAW) — the logs/KQL store used by Container Insights and most Azure Monitor logging. Not the same resource as an Azure Monitor workspace.
- Data Collection Rule (DCR) / Data Collection Endpoint (DCE) — the Azure plumbing (
MSProm-<region>-<cluster>) the add-on creates to route scraped samples into the workspace. The DCR association binds the DCR to the AKS resource. ama-metrics-settings-configmap— the schema-v2 ConfigMap inkube-systemthat governs built-in scrape targets: enable/disable, intervals, keep-lists, andcluster_alias. Absent means “use defaults.”ama-metrics-prometheus-config— the ConfigMap that holds raw Prometheus scrape config (static_configs,kubernetes_sd_configs) for targets that do not fit the CRDs.PodMonitor/ServiceMonitor— the add-on’s own CRDs (azmonitoring.coreos.com/v1) for declaratively scraping your workloads;PodMonitorselects Pods,ServiceMonitorselects Services.- Minimal ingestion profile — the default curated keep-list per target that powers built-in dashboards/rules while holding down series count. Flipping it off fleet-wide is the classic cost mistake.
- Keep-list — a per-target regex of metric names to retain (
default-targets-metrics-keep-list). Filters by name, not by label. metric_relabel_configs/labeldrop— relabel rules that drop or rewrite labels at ingest. The only way to remove a high-cardinality label from a metric you otherwise want to keep.cluster_alias/clusterName— the same string in two places: the alias stamps theclusterlabel in the ConfigMap;clusterNameon a rule group must match it or cluster-scoped rules match nothing.- Active time series (cardinality) — the count of distinct label-set combinations being written. The dominant cost driver — one bad label can be thousands of series.
prometheusRuleGroups— the Azure resource (Microsoft.AlertsManagement/prometheusRuleGroups) that holds recording and alerting rules, evaluated by the managed service against the workspace. Deployed as ARM/Bicep, not rule files.- Recording rule — a rule that precomputes a PromQL expression into a new, ingested series (e.g.
instance:node_cpu_utilisation:rate5m) for cheaper dashboards and reuse in other rules. - Alerting rule — a rule whose expression, when true for its
forduration, raises an Azure Monitor alert with aseverity(0–4) and optional auto-resolution. - Action group — the Azure Monitor notification/integration primitive (email, webhook, PagerDuty, Logic App, Teams, Functions) that fired alerts route to. One fabric across metric, log, and Prometheus alerts.
- Common Alert Schema — the normalized alert payload (
useCommonAlertSchema: true) so every receiver parses one shape regardless of alert source. - Azure Managed Grafana — the managed Grafana service. Queries the workspace via its system-assigned managed identity; users sign in via Entra ID with Grafana Admin/Editor/Viewer roles.
- Monitoring Data Reader — the Azure role Grafana’s managed identity needs on the Azure Monitor workspace to read metrics. The identity RBAC plane, separate from user access.
- Managed identity (system-assigned) — an Entra identity tied to a resource’s lifecycle, used here so Grafana reads the workspace with no API key or token to rotate.
- Remote write — the workspace’s Prometheus ingestion endpoint, letting an existing OSS Prometheus dual-write into the managed store (with Entra auth) during a migration.
az-prom-rules-converter— the utility that turns a standard Prometheusrules.ymlplus Azure metadata into a deployableprometheusRuleGroupsARM template.- AMPLS (Azure Monitor Private Link Scope) — the construct that makes workspace ingestion/query and Grafana traffic private instead of traversing public endpoints. Opt-in.
- PromQL / KQL — Prometheus Query Language (metrics, the AMW) and Kusto Query Language (logs, the LAW). Managed Prometheus uses PromQL; Container Insights uses KQL.
- kube-state-metrics (KSM) — the component that exposes Kubernetes object state as metrics. Its label/annotation allow-lists are a direct cardinality lever on the busiest target in the cluster.