In a nutshell
Before you can choose a database, a storage account or an Azure service, you have to learn the language of data — and that is all this first lesson is. Think of it like moving to a new city: before you decide where anything goes, you first learn the vocabulary (what a “warehouse”, a “lake” and a “transaction” actually mean) and the floor plan (which kind of building each type of thing belongs in). Nobody starts by buying furniture; they learn the layout first. Core data concepts are that floor plan for the data world, and DP-900 is the exam that checks you can read it.
The whole field collapses into three plain questions you learn to ask about any piece of data:
- What shape is it? Rigid rows and columns (structured), flexible self-describing documents (semi-structured), or raw files whose meaning lives in the bytes (unstructured). Shape decides where you store it and how you query it.
- What job is being done with it? Are you recording what just happened — an order, a payment, a sensor reading (transactional / OLTP) — or making sense of what happened across millions of past events (analytical / OLAP)? The job decides which kind of system you build.
- Who looks after it? A database administrator keeps the operational databases healthy, a data engineer builds the pipelines that move and shape data, and a data analyst turns the result into reports and insight. The role decides who does what.
That is the entire mental model. Once “structured versus semi versus unstructured”, “transactional versus analytical” and “who does what” are second nature, the rest of DP-900 is largely learning which Azure service plays which part — the vocabulary attaches to names you will already understand. Get these three questions wrong and every later service feels arbitrary; get them right and the exam mostly names things you can already reason about.
Level: Beginner · Time: ~28 min
What you need first: nothing technical — no SQL, no prior Azure experience. It helps to have met the words PaaS and managed service (from the cloud-fundamentals lesson), but everything here is defined from scratch. This is Module 1, Lesson 1 of the DP-900 track.
After this lesson you will be able to:
- Look at any dataset and label it structured, semi-structured or unstructured, and say what that means for storage, querying and cost.
- Tell a transactional (OLTP) workload from an analytical (OLAP) one, and explain why one database rarely serves both well.
- Choose batch or streaming by the latency the scenario demands, not by habit.
- Match a responsibility to the right data role, and name the Azure tool each one reaches for.
- Pick a sensible file format (CSV, JSON, Parquet, Avro, Delta) for a transactional versus an analytical job.
- Read the DP-900 objective domains, know how each concept here is weighted, and confirm the exam’s current, live status.
Almost every system you will ever build in Azure exists to do one of two things with data: record what happened (a customer placed an order, a sensor took a reading, a payment cleared) or make sense of what happened (which products sell best, which machines are about to fail, which customers are about to leave). Those two jobs pull a design in opposite directions, and almost every data decision you make for the rest of your career — which database, which storage, which file format, which Azure service — flows from understanding the difference.
This is the opening lesson of the DP-900: Azure Data Fundamentals track, and the foundation every later data lesson builds on. It assumes you have never written a line of SQL or designed a database in your life. By the end you will be able to look at any workload and say, with confidence, “that is structured, transactional, relational data — it belongs in a relational database” or “that is unstructured, analytical data — it belongs in a data lake”, and you will know who in a data team is responsible for each piece. Get these mental models right and the rest of DP-900 is largely vocabulary; get them wrong and nothing downstream will make sense.
Learning objectives
After this lesson you will be able to:
- Classify any dataset as structured, semi-structured or unstructured, and explain what each means for storage and querying.
- Distinguish relational from non-relational data and transactional (OLTP) from analytical (OLAP) workloads, and say why one database rarely serves both well.
- Describe the data lifecycle and the difference between batch and stream processing, with realistic Azure examples of each.
- Explain the modern data warehouse pattern and the medallion (bronze/silver/gold) architecture at a concept level.
- Identify the four core data roles — database administrator, data engineer, data analyst and data scientist — and who owns what.
- Recognise common data formats (CSV, JSON, XML, Parquet, Avro, ORC) and choose the right one for transactional versus analytical use.
Prerequisites
None beyond curiosity. It helps to have read Cloud Computing Fundamentals: IaaS, PaaS, SaaS & the Shared-Responsibility Model so that terms like PaaS and managed service are familiar, but this lesson defines everything it needs. This is Module 1, Lesson 1 of the DP-900 Data Fundamentals course in the KloudVin Azure Zero-to-Hero program.
How we classify data: structured, semi-structured, unstructured
The very first question to ask about any data is how regular is its shape? Data falls on a spectrum from rigidly tabular to completely freeform, and where it sits decides how you store it, how you query it and how much it costs to work with.
Structured data has a fixed, predefined schema — rows and columns, where every row has the same fields and every field has a declared type (an integer, a date, a 50-character string). A spreadsheet of employees is the everyday example; a relational database table is the production one. Because the shape is known in advance, structured data is easy to query precisely with a language like SQL and easy for the database to index and optimise.
Semi-structured data carries its own structure with it but does not force every record to look the same. A JSON document describing a product might have a discount field that some products simply omit; another might nest a list of reviews inside it. The structure is there — keys, values, nesting, arrays — but it is flexible and self-describing rather than fixed up front. This flexibility is exactly why semi-structured formats dominate web APIs and document databases.
Unstructured data has no inherent field-and-value model at all: photos, video, audio, PDFs, free-text emails, scanned documents. The bytes mean something to a human or to an AI model, but there is no schema a database can index on directly. You typically store the file as a blob and store metadata about it (name, size, tags, who uploaded it) separately. This is the fastest-growing category by far — most of the world’s data is now unstructured.
| Type | Schema | Examples | Where it lives in Azure | How you query it |
|---|---|---|---|---|
| Structured | Fixed, defined up front | Orders table, ledger, IoT readings in columns | Azure SQL Database, PostgreSQL/MySQL | SQL |
| Semi-structured | Self-describing, flexible | JSON/XML API payloads, product catalogues | Azure Cosmos DB, Azure Table storage | SQL-like / document queries |
| Unstructured | None (raw bytes + metadata) | Images, video, audio, PDFs, free text | Azure Blob Storage, Data Lake Storage Gen2 | Search, AI/ML, full-text |
A useful instinct: if you can draw it as a clean table, it is structured; if it is a document or message with optional, nested fields, it is semi-structured; if it is a file whose meaning lives in the bytes, it is unstructured.
Relational versus non-relational
Closely related to “shape” is the question of how records connect to each other.
A relational database stores data in tables and models relationships between them using keys. A Customers table and an Orders table are linked because each order carries a CustomerID that points back to a customer. The schema is enforced strictly: define a column as a date and the database refuses to store the word “Tuesday”. Relational databases excel when data is well-structured, relationships matter and you need strong consistency and complex joins — think finance, inventory, bookings. On Azure these are Azure SQL Database, Azure SQL Managed Instance, and Azure Database for PostgreSQL and MySQL.
A non-relational (often called NoSQL) database relaxes the fixed-schema rule and stores data in whatever shape suits the access pattern: documents (JSON), key-value pairs, wide columns or graphs. It trades rich cross-table joins and rigid schema for flexibility, massive horizontal scale and very fast reads/writes on known keys. It shines for catalogues, user profiles, IoT telemetry, gaming leaderboards and anything that must scale globally. On Azure the flagship is Azure Cosmos DB, alongside Azure Storage’s Table and Blob services.
Neither is “better” — they answer different questions. The exam loves a scenario that pushes you to pick: strong relationships and transactions → relational; flexible schema and global scale → non-relational.
Transactional versus analytical: OLTP vs OLAP
This is the single most important distinction in the whole lesson, and a guaranteed exam topic.
OLTP — Online Transaction Processing — is the world of recording what happens, right now. Each operation is small and touches a few rows: insert one order, update one balance, read one customer’s profile. There are many such operations per second, they must be fast, and they must be atomic and consistent — money must never disappear between two accounts. OLTP systems are optimised for lots of short read/write transactions and are usually relational, normalised (data stored once, without duplication) to keep writes clean and correct. Your e-commerce checkout, your banking app and your booking system are OLTP.
OLAP — Online Analytical Processing — is the world of understanding what happened, over time. A query here is large and read-only: “total revenue by product category by month for the last three years.” It scans millions or billions of rows but runs rarely compared with OLTP. OLAP systems are optimised for big aggregations and are usually denormalised (data deliberately duplicated and pre-joined into wide tables) and often column-oriented so that summing one column over a billion rows is cheap. Reporting, dashboards and business intelligence are OLAP.
The reason you cannot serve both well from one database is that their optimal designs are opposites: OLTP wants normalised tables and row storage for fast small writes; OLAP wants denormalised, columnar storage for fast huge reads. So in practice data is born in an OLTP system and copied into an OLAP system for analysis — which is exactly what the data lifecycle and the modern data warehouse describe.
| Aspect | OLTP (transactional) | OLAP (analytical) |
|---|---|---|
| Purpose | Run the business (record events) | Understand the business (analyse) |
| Typical operation | Small insert/update/read of a few rows | Large read-only aggregation over millions of rows |
| Frequency | Very high (many per second) | Lower (reports, dashboards) |
| Schema design | Normalised, row-oriented | Denormalised, often column-oriented |
| Consistency need | Strong (ACID transactions) | Read consistency; freshness can lag |
| Azure examples | Azure SQL Database, Cosmos DB, PostgreSQL | Azure Synapse Analytics, Microsoft Fabric, Databricks |
A quick memory hook: OLTP = Production/everyday transactions; OLAP = Analysis.
ACID: the promise that makes transactions safe
When people say a transactional database is “reliable”, they usually mean it guarantees ACID properties for every transaction:
- Atomicity — all the steps in a transaction happen, or none do. Debiting one account and crediting another either both succeed or both roll back; money never vanishes mid-transfer.
- Consistency — a transaction moves the database from one valid state to another, never leaving it half-broken or violating its rules.
- Isolation — concurrent transactions do not tread on each other; the result is as if they ran one after another.
- Durability — once a transaction is committed, it survives even a power cut or crash.
ACID is the hallmark of OLTP relational systems. Many non-relational systems relax some of these guarantees (for example offering eventual consistency) in exchange for scale and availability — a trade-off you choose deliberately based on the workload.
The data lifecycle
Data is not static; it moves through stages from creation to consumption. Understanding this flow is what ties every Azure data service together.
- Generate / capture — data is created by an application, device or user (an order is placed, a sensor emits a reading).
- Ingest — it is brought into a data platform, either in bulk on a schedule or continuously as events arrive.
- Store — it lands in an appropriate store: a relational database for transactions, a data lake for raw analytical data, a warehouse for curated data.
- Process / transform — it is cleaned, joined, reshaped and enriched into a form fit for analysis (this is where ETL/ELT lives — covered in the analytics lesson).
- Serve / analyse — it is queried by analysts, fed to dashboards or used to train machine-learning models.
- Visualise / act — insights reach humans (a Power BI dashboard) or drive automated decisions.
- Archive / retire — old data is moved to cheap cold storage or deleted per retention policy.
The two ingestion styles in step 2 — bulk-on-a-schedule versus continuous — are important enough to have their own names: batch and streaming.
Batch versus stream processing
Batch processing collects data over a period and processes it together in scheduled runs. You might load yesterday’s sales every night at 02:00, or reprocess a month of logs in one large job. Batches handle huge volumes efficiently and tolerate latency — nobody minds that last night’s sales report is a few hours old. The trade-off is freshness: results are only as current as the last run.
Stream processing handles data continuously, as each event arrives, with latency measured in seconds or milliseconds. A fraud-detection system scoring each card swipe, a live operations dashboard, or alerting on a sudden temperature spike are streaming workloads. Streaming gives you near-real-time insight but is more complex to build and operate, and typically processes smaller pieces of data at a time.
| Dimension | Batch | Streaming |
|---|---|---|
| When it runs | Scheduled / on demand, in chunks | Continuously, event by event |
| Latency | Minutes to hours | Seconds to milliseconds |
| Data size per run | Large (the whole batch) | Small (one event / micro-batch) |
| Complexity & cost | Lower, simpler | Higher, always-on |
| Azure services | Azure Data Factory, Synapse/Fabric pipelines, Databricks | Azure Stream Analytics, Event Hubs, Functions |
| Example | Nightly sales load, monthly billing | Live fraud scoring, IoT telemetry alerts |
Many real platforms use both: streaming for the live view and batch for the deep, historical reprocessing — an idea sometimes called a lambda architecture. For DP-900, the key is simply being able to tell a batch scenario from a streaming one by its latency requirement.
The modern data warehouse and the medallion idea
When organisations need to analyse data from many sources together, they build a modern data warehouse. The pattern is consistent regardless of the tool:
Ingest data from operational systems (databases, apps, files, streams) → store the raw data cheaply in a data lake (Azure Data Lake Storage Gen2) → transform it into clean, modelled tables → serve it from an analytical engine (Azure Synapse Analytics or Microsoft Fabric) → visualise it in Power BI. A data lake is simply massive, cheap storage that holds data of any shape — structured, semi-structured and unstructured — in its raw form, so you keep everything and decide how to use it later. A data warehouse is the curated, query-optimised store of clean, structured data ready for reporting.
A popular way to organise the lake is the medallion architecture, which refines data through three quality layers:
- Bronze — raw, untouched data exactly as ingested (your immutable source of truth).
- Silver — cleaned, validated, de-duplicated and conformed data.
- Gold — business-level, aggregated tables shaped for specific reports and dashboards.
Data flows bronze → silver → gold, getting more refined and more valuable at each step. You do not need the implementation detail for DP-900 — just the concept that raw data is progressively cleaned and curated, and that the lake holds everything while the warehouse holds the polished result.
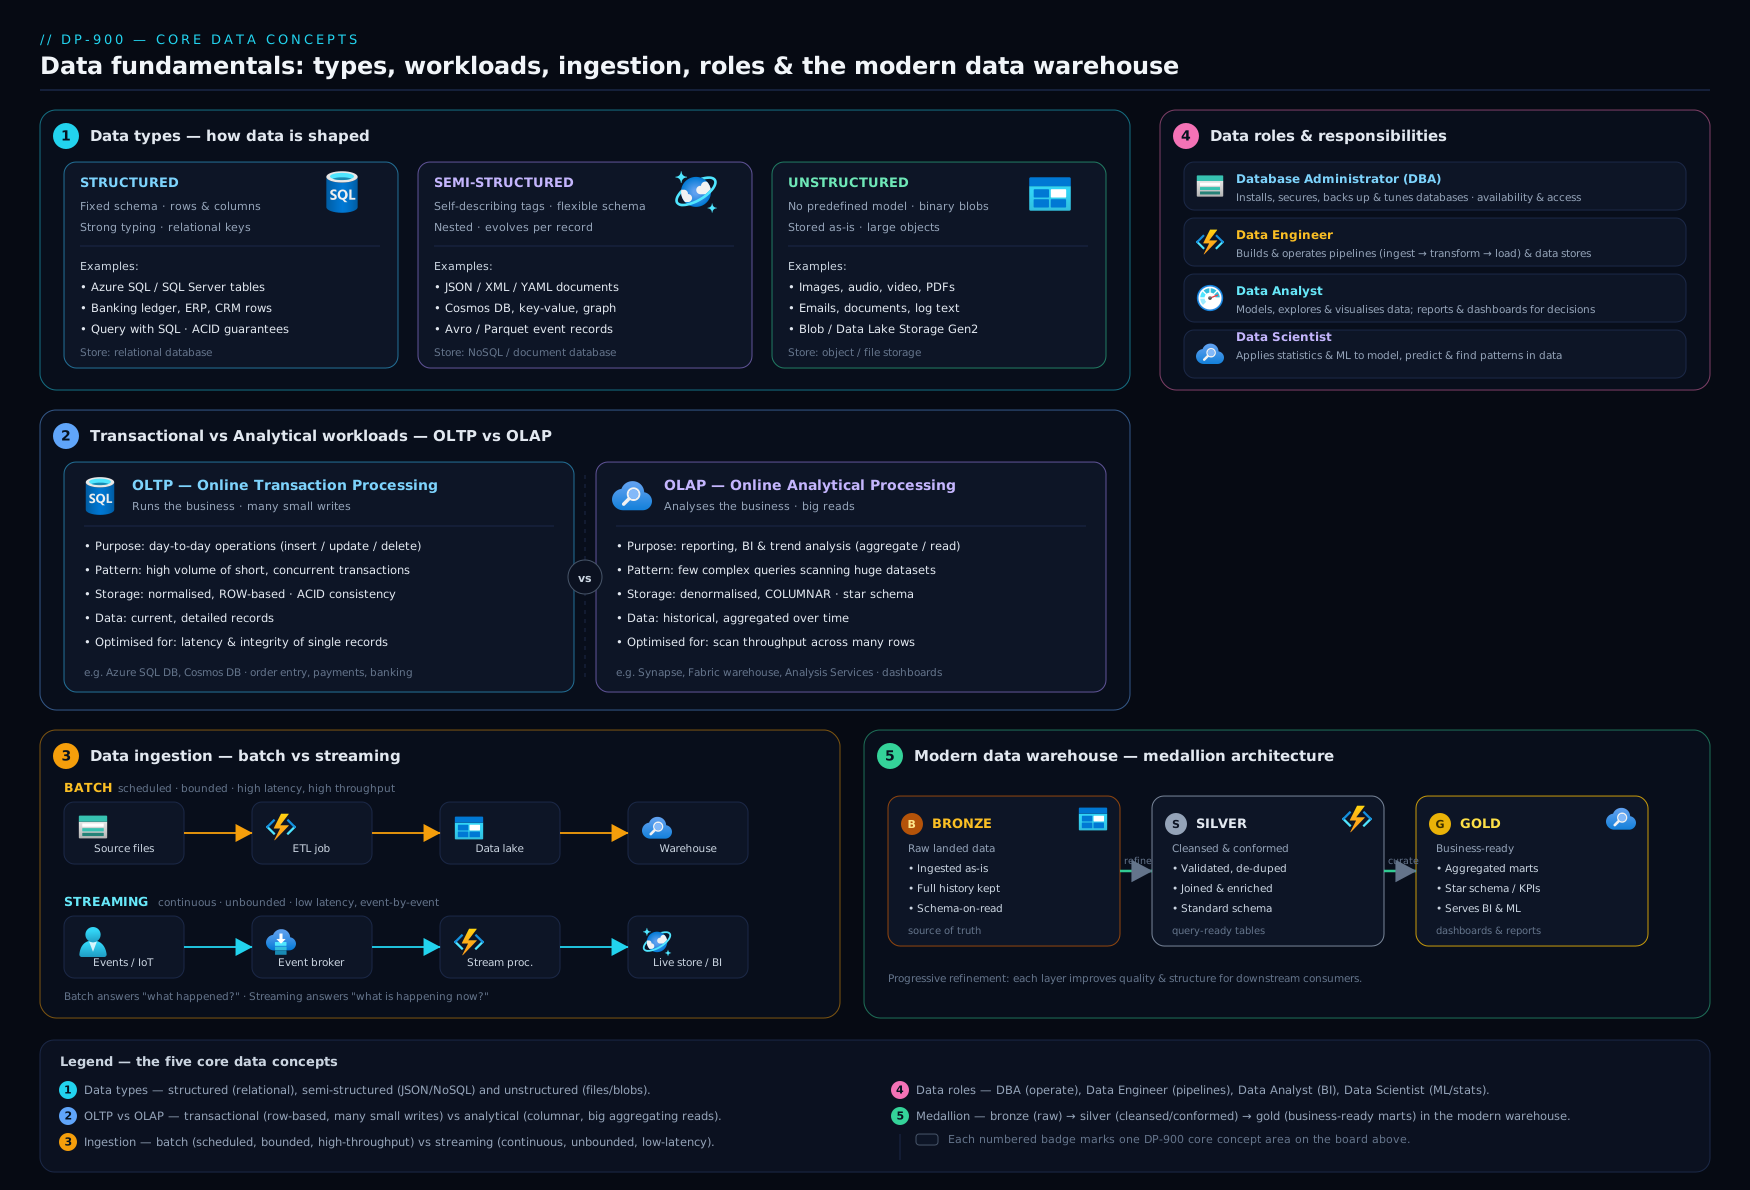
The diagram above ties it together: the same event is captured by an OLTP system, lands raw in the data lake, is refined through the medallion layers, and is finally served for OLAP analysis and visualisation — with each of the four data roles working at a different stage of that journey.
The four data roles: who does what
Data work in any serious organisation is divided among four roles. DP-900 expects you to match a responsibility to the right one.
Database administrator (DBA). Owns the health of operational databases. Provisions and configures them, manages security and access, plans backups and disaster recovery, tunes performance, applies patches and keeps the lights on. The DBA’s world is mostly the OLTP side — keeping production databases fast, secure and available. Azure tools: Azure SQL Database, SQL Managed Instance, backups, security tooling.
Data engineer. Builds the pipelines that move and transform data. They ingest data from many sources, design the data lake and warehouse, write the ETL/ELT that turns raw data into clean, usable datasets, and make sure analysts and scientists have trustworthy data to work with. The data engineer is the plumber of the data world. Azure tools: Azure Data Factory, Synapse/Fabric pipelines, Data Lake Storage Gen2, Databricks.
Data analyst. Turns curated data into insight for business decisions. They explore data, build reports and dashboards, define metrics and tell the story of what the numbers mean — usually for non-technical stakeholders. Azure tools: Power BI, Synapse/Fabric SQL queries.
Data scientist. Applies statistics and machine learning to find patterns and make predictions — forecasting demand, detecting fraud, predicting churn, building models. They work with both raw and curated data and need experimentation tooling. Azure tools: Azure Machine Learning, Databricks, notebooks.
| Role | Core question they answer | Typical tasks | Azure tools |
|---|---|---|---|
| Database administrator | “Is the database healthy, secure and fast?” | Provision, secure, back up, tune, patch | Azure SQL, Managed Instance, backups |
| Data engineer | “How do I move and shape this data reliably?” | Build pipelines, ETL/ELT, lake/warehouse | Data Factory, Synapse/Fabric, Data Lake, Databricks |
| Data analyst | “What is the data telling the business?” | Reports, dashboards, metrics, exploration | Power BI, Synapse/Fabric SQL |
| Data scientist | “What can we predict from this data?” | ML models, statistics, experimentation | Azure ML, Databricks, notebooks |
The roles overlap in practice — in a small team one person may wear several hats — but the exam treats them as distinct, so anchor each to its core question.
Common data formats
How data is stored on disk or in a file matters enormously for cost and performance, especially in analytics. DP-900 expects familiarity with these.
CSV (Comma-Separated Values). Plain text, one row per line, fields separated by commas. Simple, universal and human-readable; great for small exports and exchange. But it has no types (everything is text), no compression and must be read whole — poor for big analytics. Row-oriented.
JSON (JavaScript Object Notation). The standard for semi-structured data and web APIs. Self-describing, supports nesting and arrays, very flexible. More verbose than CSV and still text-based, so not ideal for huge analytical scans, but perfect for documents and message payloads. This is what document databases like Cosmos DB store.
XML (eXtensible Markup Language). An older, tag-based, self-describing format (<order><id>1</id></order>). Still common in enterprise integration and legacy systems, but heavier and more verbose than JSON, which has largely replaced it for new work.
Parquet. A columnar, compressed, binary format built for analytics. Because it stores data by column, a query that needs only two of fifty columns reads only those two — dramatically faster and cheaper for big aggregations. It also carries a schema and compresses extremely well. This is the workhorse of the data lake and the format you reach for when building analytical tables.
Avro. A row-based, compact, binary format with the schema stored alongside the data. It is strong for streaming and message-passing (it handles schema evolution gracefully) and for write-heavy ingestion where you read whole records. Often paired with Event Hubs / Kafka-style pipelines.
ORC (Optimised Row Columnar). Another columnar, compressed analytical format, common in the Hadoop/Hive ecosystem; conceptually similar to Parquet in its benefits.
| Format | Layout | Human-readable | Compressed | Schema | Best for |
|---|---|---|---|---|---|
| CSV | Row | Yes | No | No | Small exports, simple exchange |
| JSON | Row (document) | Yes | No | Self-describing | APIs, semi-structured documents |
| XML | Row (document) | Yes | No | Self-describing | Legacy/enterprise integration |
| Parquet | Column | No (binary) | Yes | Yes | Analytics, data lakes, big scans |
| Avro | Row | No (binary) | Yes | Yes (with data) | Streaming, write-heavy ingestion |
| ORC | Column | No (binary) | Yes | Yes | Analytics (Hadoop/Hive ecosystem) |
The exam-ready instinct: row formats (CSV, JSON, Avro) for transactional / write-heavy / whole-record reads; columnar formats (Parquet, ORC) for analytical / read-heavy / aggregate-a-few-columns workloads.
Going deeper
The sections above give you the working vocabulary. This one is for the reader who wants the mechanics underneath it — the why behind schema, storage layout, the lakehouse and the exam blueprint. None of it is strictly required to pass DP-900, but understanding it is what turns memorised definitions into intuition, and several points here quietly explain exam answers that otherwise look arbitrary.
Schema-on-write versus schema-on-read: the real meaning of “shape”
Structured, semi-structured and unstructured are really three points on one axis: when is the schema enforced?
- Schema-on-write (structured / relational): the shape is defined before any data goes in, and the store rejects anything that does not fit. Declare a column as
DATEand the word “Tuesday” can never be written there. You pay the cost of designing the schema up front and are rewarded with fast, precise, index-backed queries and strong guarantees. This is why structured data and relational databases belong together. - Schema-on-read (semi-structured and unstructured): you store the bytes as they are and impose a shape only when something reads them. A JSON document, a Parquet file or an image lands in storage with no gatekeeper; meaning is applied later, by whatever code reads it. You trade up-front rigidity for the freedom to ingest anything now and decide how to interpret it later — the founding idea of the data lake.
This single distinction explains a lot. It is why a relational database can guarantee referential integrity but a blob container cannot; why loading badly-shaped data into SQL fails immediately while the same file sits happily in a lake until a query trips over it; and why the fastest-growing data (images, logs, telemetry, documents) lives in schema-on-read stores — enforcing a schema on all of it up front would be impossible. For the exam, remember that “flexible” and “self-describing” (semi-structured) is a middle point: the data carries hints about its own shape (keys, nesting), but nothing forces every record to match.
Why OLTP and OLAP are mirror images — and HTAP, the exception
The lesson said their optimal designs are opposites. Concretely: OLTP normalises data (each fact stored once, spread across many narrow tables) and stores it row by row, because a checkout writes a whole order row at once and must not duplicate a customer’s address in a thousand places. OLAP denormalises into a star schema — one central fact table of measures surrounded by dimension tables of context — and stores it column by column, because a report sums one column (say, amount) across a billion rows and never wants to read the other forty.
The columnar payoff is worth seeing. In a row store, summing amount over a billion rows drags every column of every row off disk. In a columnar store (Parquet, and the engines built on it), the amount column sits together, compresses brilliantly because neighbouring values are similar, and a query touches only the bytes it needs. Same question, a fraction of the I/O — the whole reason analytical stores are columnar.
HTAP (Hybrid Transactional/Analytical Processing) is the nuance that “one database can’t do both” glosses over. Modern platforms bolt an analytical column store onto a transactional row store and keep them in sync automatically, so you can analyse fresh operational data with little or no ETL. On Azure you will meet this as columnstore indexes in Azure SQL, and as Azure Synapse Link for Azure Cosmos DB (and, in Microsoft Fabric, mirroring), which project transactional data into an analytical store without you building a pipeline. DP-900 does not test HTAP internals, but knowing it exists stops you over-applying the “always copy OLTP into a separate OLAP system” rule.
Batch, micro-batch, streaming — and the lambda/kappa debate
Batch and streaming are the two ends; real systems live on the spectrum between them. Micro-batch processing (as in Spark Structured Streaming, used by Azure Databricks and Microsoft Fabric) treats a stream as a rapid sequence of tiny batches — seconds apart — which gives near-real-time freshness with batch-style reliability. True continuous stream processing (Azure Stream Analytics) reacts event by event and reasons over time windows (tumbling, hopping, sliding) — “how many failed logins in the last 30 seconds?” — because an unbounded stream has no natural “end” to aggregate over.
Two architecture patterns come up once you combine both:
- Lambda architecture runs a batch layer (accurate, complete, slow) alongside a speed/streaming layer (fast, approximate) and merges the two at query time — the “streaming for the live view, batch for the deep reprocess” idea, generalised.
- Kappa architecture drops the separate batch layer: everything is a stream, and when you need to reprocess history you simply replay the event log through the same streaming code. It is simpler to operate but leans on a durable log (Event Hubs / Kafka) that can be replayed.
For DP-900 you only need to classify a scenario by its latency requirement, but recognising these names keeps you from thinking batch and streaming are mutually exclusive — mature platforms almost always run both.
The lakehouse: where the lake and the warehouse merge (ingest → store → prep → model → serve)
The modern flow has a canonical five-stage shape worth committing to memory: ingest → store → prep → model → serve.
- Ingest — pull data in from operational databases, apps, files and event streams (Azure Data Factory / Fabric pipelines for batch; Event Hubs, IoT Hub, Stream Analytics for streaming).
- Store — land it cheaply and raw in a data lake (Azure Data Lake Storage Gen2 or, in Fabric, OneLake).
- Prep — clean, validate, deduplicate and conform it — exactly the bronze → silver medallion refinement (Databricks, Fabric/Synapse Spark, Data Factory data flows).
- Model — shape it into analytics-ready tables, typically a star schema — the medallion gold layer.
- Serve — expose it to an analytical engine and to Power BI for dashboards and self-service.
The lakehouse is what happens when the lake and the warehouse stop being separate systems. Historically you had a cheap, flexible lake (great for raw and unstructured data, no transactions) and a rigid, expensive warehouse (great for curated SQL analytics). A lakehouse adds warehouse-style structure — ACID tables, schema, fast SQL — on top of lake storage, so one store serves both raw and curated data. Microsoft Fabric is Microsoft’s expression of this: a single SaaS platform where lake, data engineering, data warehouse, real-time intelligence and Power BI all read and write the same OneLake storage, in one open table format. That format is Delta.
Delta and the open table formats
The lesson covered CSV, JSON, XML, Parquet, Avro and ORC. The one the modern stack now assumes is Delta Lake — and understanding it fixes a common confusion. Parquet is a file format; on its own a folder of Parquet files has no notion of a transaction, so two writers can corrupt each other and there is no clean “update this row” or “roll back”. Delta Lake layers a transaction log over a set of Parquet files, turning the folder into a table with ACID guarantees, updates and deletes, time-travel (query the table as of yesterday) and schema enforcement — while the data underneath is still plain, open Parquet. Apache Iceberg and Hudi are the other open table formats in the same category.
This is why “Delta” keeps appearing: it is the default table format of both Azure Databricks and Microsoft Fabric/OneLake, and it is what makes the lakehouse possible — the ACID-on-a-lake that lets one store behave like a warehouse. The exam-ready instinct still holds: row formats (CSV, JSON, Avro) for transactional, write-heavy, whole-record work; columnar (Parquet, ORC) for analytical scans; Delta when you want a governed, updatable, ACID table on top of that columnar storage.
The data roles in the current DP-900 scope
A precise, exam-relevant point: the current DP-900 study guide (skills measured as of July 21, 2026) lists three roles under “Identify roles and responsibilities for data workloads” — database administrator, data engineer and data analyst. The lesson also teaches the data scientist, and rightly so — it is a real, important, adjacent role you will meet constantly in practice — but the current exam’s roles objective calls out those three. Learn all four for a complete mental model of a data team; on the exam, expect the responsibilities of the DBA, the engineer and the analyst to be what you are asked to match. Their Azure tooling maps cleanly: DBA → Azure SQL / SQL Managed Instance and its security, backup and tuning surface; data engineer → Data Factory, Fabric/Synapse pipelines, Data Lake Storage, Databricks; data analyst → Power BI and analytical SQL.
The DP-900 objective domains and how they’re weighted
DP-900 (Microsoft Azure Data Fundamentals) is live and current — verified against the Microsoft Learn study guide (skills measured as of July 21, 2026); the change log for that revision records only minor wording tweaks and no change to the domain structure, so nothing has been retired or restructured. It has no prerequisites, is a fundamentals-level exam, and can act as a stepping stone toward the Azure Data Engineer or Azure Database Administrator associate certifications (though it is required for none of them). Scoring is scaled to 1000 with 700 to pass, and a free official practice assessment is available.
The four scored domains and their weightings:
| DP-900 domain | Weight | What it covers | Where in this track |
|---|---|---|---|
| Describe core data concepts | 25–30% | Ways to represent data (structured/semi/unstructured, file formats), data-store and format options, transactional vs analytical workloads, and the data roles | This lesson |
| Identify considerations for relational data on Azure | 20–25% | Relational concepts, normalization, SQL statements and objects, the Azure SQL family and open-source databases | DP-900: Relational Data on Azure |
| Describe considerations for working with non-relational data on Azure | 15–20% | Azure Blob, Files and Table storage; Azure Cosmos DB use cases and APIs | DP-900: Non-Relational Data & Analytics |
| Describe an analytics workload on Azure | 25–30% | Large-scale analytics (Databricks, Microsoft Fabric), batch vs streaming, and data visualisation in Power BI | (same track, analytics lessons) |
Two things fall out of this table. First, this single lesson maps to the joint-largest domain (core concepts, 25–30%) — the vocabulary you are learning now is the most heavily weighted knowledge on the exam. Second, notice that batch versus streaming is examined under the analytics domain, not core concepts, and that the data roles sit inside core concepts — a favourite way for the exam to test whether you know where a topic belongs. Most exam questions target generally available features; preview features appear only when they are in common use, so you can safely reason from GA behaviour.
Hands-on lab: see structured, semi-structured and the OLTP→OLAP split for yourself
This lab needs nothing but a free Azure account and the Cloud Shell, and it uses the always-free Azure Storage tier within a normal subscription. The goal is to feel the three data shapes and the lifecycle, not to build a warehouse.
Open the Azure Cloud Shell (the >_ icon in the portal) and choose Bash. Then create a resource group and a storage account that will act as a tiny data lake:
# Variables
RG="rg-dp900-lab"
LOC="centralindia"
SA="dp900lab$RANDOM"   # storage account names must be globally unique, lowercase

# 1. Resource group
az group create --name $RG --location $LOC

# 2. Storage account with hierarchical namespace = Data Lake Storage Gen2
az storage account create \
  --name $SA --resource-group $RG --location $LOC \
  --sku Standard_LRS --kind StorageV2 --hierarchical-namespace true

# 3. A container to act as our "bronze" raw layer
az storage container create --account-name $SA --name bronze --auth-mode login
Now create one file of each shape locally and upload them, mimicking the ingest → store stages of the lifecycle:
# Structured (CSV) — a tiny orders table
printf "order_id,customer,amount\n1,Asha,1200\n2,Ben,450\n" > orders.csv

# Semi-structured (JSON) — a product document with optional/nested fields
printf '{"id":"p1","name":"Keyboard","price":1999,"tags":["input","usb"]}\n' > product.json

# Upload both to the bronze layer
az storage blob upload --account-name $SA -c bronze -f orders.csv  -n raw/orders.csv  --auth-mode login
az storage blob upload --account-name $SA -c bronze -f product.json -n raw/product.json --auth-mode login

# List what landed in the lake
az storage blob list --account-name $SA -c bronze --query "[].name" -o table --auth-mode login
Expected output: the final command lists raw/orders.csv and raw/product.json. You have just ingested structured and semi-structured data into a data lake — the bronze layer of a medallion design. (An unstructured file would simply be a blob too: try uploading any image with the same command and it lands right beside them — the lake does not care about shape.)
Validation: in the portal, open the storage account → Storage browser → Blob containers → bronze → raw, and confirm both files are present. Notice that the CSV is a neat grid (structured) while the JSON carries its own keys and a nested array (semi-structured).
Cleanup (important — avoid charges):
az group delete --name $RG --yes --no-wait
Cost note: kept to a single LRS storage account holding a few kilobytes, this lab costs effectively nothing — well under ₹1 — and the resource group is deleted immediately afterwards. Storage in India regions is billed per GB-month, so a few kilobytes for a few minutes rounds to zero; the discipline of always running the cleanup command is what keeps a learning subscription cheap.
Common mistakes & troubleshooting
| Symptom / mistake | Cause | Fix |
|---|---|---|
| Calling JSON “unstructured” | Confusing flexible with no structure | JSON is semi-structured — it is self-describing with keys and nesting |
| Running heavy reports against the production OLTP database | Treating one database as both transactional and analytical | Copy data to an OLAP store (Synapse/Fabric); keep OLTP for transactions |
| Choosing CSV for a large analytics dataset | Picking a familiar format over an efficient one | Use Parquet — columnar and compressed, far cheaper to scan |
| Storage account name rejected in the lab | Names must be globally unique, 3–24 chars, lowercase letters/numbers only | Append $RANDOM or pick another suffix |
| Expecting near-real-time results from a nightly batch | Mismatching latency need with processing style | Use stream processing (Stream Analytics/Event Hubs) for real-time |
| Mixing up data engineer and data analyst | Both “work with data” | Engineer moves and shapes data (pipelines); analyst interprets it (reports) |
Forgetting --auth-mode login on storage commands |
Defaults to key-based auth which may be disabled | Add --auth-mode login to use your Entra identity |
Common beginner mistakes
These are conceptual traps — wrong mental models rather than wrong commands (the operational slip-ups live in the troubleshooting table above). Each is a belief that feels reasonable and quietly leads you to the wrong exam answer or the wrong design.
-
“Unstructured means messy; semi-structured means half-broken.” The axis is not tidiness, it is when the schema is enforced. A pristine, perfectly formatted JSON file is still semi-structured (schema-on-read, flexible per record); a blurry photo is cleanly unstructured (no field model at all). Neither word is a judgement about quality — reach for “schema-on-write versus schema-on-read” and the labels sort themselves out.
-
“NoSQL means no schema, and relational databases are legacy.” Non-relational data still has structure — a document has keys, a graph has edges. What it relaxes is the fixed, enforced-up-front schema and rich cross-table joins, in exchange for flexibility and horizontal scale. Relational remains the correct default whenever relationships and multi-row transactions matter (finance, inventory, bookings). The two answer different questions; neither is obsolete.
-
“OLAP is just a bigger OLTP database.” They are opposite designs — normalised rows for fast small writes versus denormalised columns for fast huge reads. Buying a bigger OLTP server does not make it good at billion-row aggregations; the right move is to copy data into an analytical store shaped for the job. Scale is not the difference; layout is.
-
“A data lake replaces the database, or replaces the warehouse.” The lake holds raw data of any shape, cheaply; the warehouse holds curated, query-optimised tables. They coexist — data flows lake → warehouse as it is refined — or they merge into a lakehouse. A lake is not a drop-in for a transactional database (no ACID transactions, no row-level integrity), and dumping raw files into a lake is not “having a warehouse”.
-
“Streaming is simply better than batch because it’s real-time.” Streaming buys freshness at the price of always-on infrastructure, more moving parts and higher cost. If a nightly refresh meets the business need, batch is the cheaper, simpler, correct choice. Choose by the latency requirement, never by which sounds more modern — the exam rewards matching the tool to the need.
-
“Bronze, silver and gold are three separate Azure products you buy.” The medallion layers are just three zones (folders) of increasing refinement inside one data lake — a naming convention for raw → cleaned → business-ready. There is no “Silver service”. Likewise, a lake, a warehouse and a lakehouse are architectures, not single SKUs.
-
“Parquet is basically a zipped CSV.” Compression is a side effect, not the point. The real difference is the columnar layout: values from one column sit together, so a query can skip the columns it does not need and read a fraction of the data. That column skipping — not the smaller size — is why Parquet is fast for analytics.
-
“DP-900 needs coding and a paid Azure subscription.” DP-900 is a fundamentals exam: conceptual, no coding required, and every hands-on idea in this lesson can be explored on a free account. Knowing what each service is for and which workload it suits matters far more than knowing how to operate it. Do not over-prepare with deep SQL or portal drills you will not be tested on.
-
“The data scientist is one of the DP-900 data roles.” The current DP-900 objective domain lists three — database administrator, data engineer and data analyst. The data scientist is a real and important adjacent role (this lesson still teaches it, and you should know it), but the exam’s roles-and-responsibilities objective calls out those three. Learn all four; expect to be tested on the three.
Best practices
- Match the store to the workload. Transactional and relational → relational database; flexible and globally scaled → non-relational; raw and analytical → data lake. Do not force one store to do every job.
- Separate OLTP from OLAP. Never let reporting queries compete with live transactions; move analytical data into a dedicated analytical store.
- Prefer columnar formats for analytics. Parquet/ORC cut scan cost and time dramatically over CSV/JSON.
- Keep raw data (bronze) immutable. Refine forward into silver and gold; never overwrite your source of truth.
- Choose batch or streaming by latency, not habit. Real-time need → streaming; tolerant of delay → batch (cheaper and simpler).
- Label data by sensitivity early. Knowing which datasets hold personal or financial data shapes every later security and governance decision.
Security notes
Even at fundamentals level, three security ideas underpin everything in DP-900. First, encryption: Azure data services encrypt data at rest by default and support encryption in transit (TLS), so data is protected both on disk and on the wire. Second, identity-based access: prefer Microsoft Entra ID identities and role-based access control (RBAC) over shared keys or passwords — in the lab we used --auth-mode login precisely so the storage operations ran as you, not as an account key that could leak. Third, classification and least privilege: identify which data is sensitive (personal, financial, health) and grant each role only the access it needs — a data analyst rarely needs write access to raw operational tables. These principles recur in every later data lesson, so internalise them now.
Interview & exam questions
-
What is the difference between structured, semi-structured and unstructured data? Give an example of each. Structured has a fixed schema (a SQL table); semi-structured is self-describing but flexible (JSON); unstructured has no inherent field model (an image or PDF).
-
Explain OLTP versus OLAP. OLTP handles many small, fast read/write transactions to run the business (and is normalised, row-oriented, ACID); OLAP handles large read-only aggregations to analyse the business (and is denormalised, often columnar). Data is born in OLTP and copied to OLAP.
-
Why can’t one database serve both transactional and analytical workloads well? Their optimal designs are opposites — OLTP wants normalised rows for fast small writes; OLAP wants denormalised columnar storage for fast huge reads. Mixing them degrades both.
-
What do the letters in ACID stand for, and which workload depends on them? Atomicity, Consistency, Isolation, Durability — the guarantees that make OLTP transactional databases reliable.
-
What is the difference between relational and non-relational data? Relational stores data in tables linked by keys with a strict schema and rich joins; non-relational (NoSQL) relaxes the schema for flexibility and horizontal scale (documents, key-value, columns, graphs).
-
Batch versus stream processing — when would you use each? Batch processes large volumes on a schedule with higher latency (nightly sales load); streaming processes events continuously with sub-second latency (live fraud detection). Choose by the latency requirement.
-
Describe the four data roles. Database administrator (health, security and performance of operational databases); data engineer (builds pipelines that move and transform data); data analyst (turns curated data into reports and insight); data scientist (builds ML models and predictions).
-
A team needs to analyse three years of sales by region in Power BI without slowing the checkout system. Outline an approach. Leave checkout on its OLTP database; use a data engineer’s pipeline to ingest the sales data into a data lake, refine it (bronze→silver→gold), serve it from Synapse/Fabric, and connect Power BI to that analytical store.
-
Why is Parquet preferred over CSV for large analytical datasets? Parquet is columnar and compressed, so a query reads only the columns it needs and far fewer bytes — dramatically faster and cheaper than scanning a whole row-based, uncompressed CSV.
-
What is a data lake, and how does it differ from a data warehouse? A data lake is massive, cheap storage holding raw data of any shape; a data warehouse holds curated, structured, query-optimised data ready for reporting. Data flows from lake to warehouse as it is refined.
-
What does the medallion architecture describe? Three progressive quality layers in a data lake — bronze (raw), silver (cleaned/conformed) and gold (business-ready aggregates) — through which data is refined.
-
Which file format would you choose for a streaming ingestion pipeline that reads whole records, and why? Avro — a compact, row-based binary format that stores its schema with the data and handles schema evolution well, suiting write-heavy, whole-record streaming.
Practice challenges
Six exam-style questions, escalating from recall to reasoning. Try each before opening the answer. They follow the DP-900 style — a single best answer with plausible distractors — and are written to be self-marking. (The real exam mixes multiple-choice, multiple-response and drag-and-drop; the thinking is the same.)
1 · (Recall) What shape is it? A mobile game stores each player’s profile as a JSON document. Some players have a guild field and a nested list of achievements; others do not. How is this data best classified?
A. Structured B. Semi-structured C. Unstructured D. Relational
<details><summary>Show answer</summary>
B — Semi-structured. JSON is self-describing (keys, nesting, arrays) but does not force every record to look the same — the optional guild is the giveaway. Why: flexible-but-self-describing is the definition of semi-structured, not “no structure”.
</details>
2 · (Recall) Which workload? A bank’s app debits one account and credits another thousands of times a second, each operation touching a few rows and needing to be atomic and consistent. Which workload type is this?
A. OLAP B. Batch analytics C. OLTP D. Streaming analytics
<details><summary>Show answer</summary>
C — OLTP. Many small, fast, ACID read/write transactions that run the business. Why: a tiny per-operation footprint at high frequency, with atomicity, is the OLTP signature; OLAP is the opposite (large read-only aggregations).
</details>
3 · (Apply) Pick the format. A data engineer must store 5 TB of historical sales in a lake so dashboards can sum two or three columns over billions of rows as cheaply as possible. Which file format fits best?
A. CSV B. JSON C. Parquet D. XML
<details><summary>Show answer</summary>
C — Parquet. Columnar and compressed, so a query reads only the columns it needs and far fewer bytes. Why: analytical, read-heavy, few-columns-of-many always points to a columnar format (Parquet/ORC, or Delta on top of Parquet), never row-based CSV/JSON/XML.
</details>
4 · (Apply) Match the role. Someone builds and schedules the pipelines that ingest raw data, clean it, and load it into curated tables for others to consume. In current DP-900 terms, which role is this?
A. Database administrator B. Data analyst C. Data engineer D. Business user
<details><summary>Show answer</summary>
C — Data engineer. Owns the pipelines that move and transform data (ETL/ELT) and builds the lake and warehouse. Why: “moves and shapes the data” = engineer; “interprets it in reports” = analyst; “keeps the operational database healthy, secure and fast” = DBA.
</details>
5 · (Reason) Batch or stream? A factory needs an alert within about two seconds of a machine’s temperature crossing a threshold. Which processing style and which Azure service pair fit best?
A. Batch — Data Factory + Synapse B. Streaming — Event Hubs + Stream Analytics C. Batch — Databricks + Power BI D. Streaming — Blob Storage + Table Storage
<details><summary>Show answer</summary>
B — Streaming, with Event Hubs + Stream Analytics. A sub-second-to-seconds reaction to each event as it arrives is stream processing: Event Hubs ingests the telemetry and Stream Analytics scores it against a time window in real time. Why: the two-second requirement rules out scheduled batch, and Blob + Table storage are stores, not stream processors.
</details>
6 · (Reason) Read the blueprint. On the current DP-900 study guide, “Describe core data concepts” is weighted at 25–30%. Which of the following is also explicitly part of that same core-concepts domain?
A. Writing T-SQL SELECT statements B. Configuring Azure Cosmos DB APIs C. Identifying roles and responsibilities for data workloads D. Building a Power BI data model
<details><summary>Show answer</summary>
C — Identifying roles and responsibilities for data workloads. The core-data-concepts domain covers ways to represent data, data-store and file-format options, transactional-vs-analytical workloads, and the data roles. Why: SQL statements live in the relational domain, Cosmos DB APIs in the non-relational domain, and Power BI models in the analytics domain — a classic “where does this topic belong?” trap.
</details>
Quick check
- JSON is an example of which data category?
- Which workload type is optimised for many small, fast transactions: OLTP or OLAP?
- True or false: streaming processing has higher latency than batch.
- Which role builds the pipelines that move and transform data?
- Which file format is columnar and best suited to large analytical scans?
Answers
- Semi-structured — it is self-describing and flexible but not freeform.
- OLTP (Online Transaction Processing).
- False — streaming has lower latency (seconds/ms); batch has higher latency.
- The data engineer.
- Parquet (ORC is the other columnar analytical format).
Exercise
Pick three systems you use or know — for example a banking app, a video-streaming service and a hospital’s patient-records system. For each, write a short note answering: (a) what kind of data does it mainly hold — structured, semi-structured or unstructured? (b) is its primary workload transactional (OLTP) or analytical (OLAP)? © would its reporting needs be better served by batch or streaming? (d) which two data roles would be most involved in running it? There is no single right answer — the value is in justifying each choice with the concepts from this lesson. As a stretch, sketch how data would flow through the lifecycle (generate → ingest → store → transform → serve) for one of them.
Certification mapping
This lesson maps directly to the DP-900: Microsoft Azure Data Fundamentals exam, principally the “Describe core data concepts” domain (the largest scored area), which covers ways to represent data (structured/semi-structured/unstructured and file formats), data workload options (batch vs streaming, transactional vs analytical) and common data roles and the tasks performed by each. The OLTP/OLAP, relational/non-relational and modern-data-warehouse concepts here also underpin the relational and non-relational/analytics domains covered in the following lessons. Everything in this lesson is foundational knowledge expected before any other DP-900 topic.
Glossary
-
Structured data — data with a fixed, predefined schema of rows and typed columns (e.g. a SQL table).
-
Semi-structured data — self-describing data with flexible structure (e.g. JSON), where records need not be identical.
-
Unstructured data — data with no inherent field model (images, video, audio, free text), stored as files with separate metadata.
-
Relational — data modelled as tables linked by keys, with a strict, enforced schema.
-
Non-relational / NoSQL — databases that relax the fixed schema for flexibility and scale (document, key-value, column, graph).
-
OLTP — Online Transaction Processing; many small, fast, ACID read/write transactions that run the business.
-
OLAP — Online Analytical Processing; large read-only aggregations that analyse the business.
-
ACID — Atomicity, Consistency, Isolation, Durability; the guarantees that make transactions reliable.
-
Normalisation — organising data so each fact is stored once, without duplication (favoured by OLTP).
-
Denormalisation — deliberately duplicating/pre-joining data into wide tables for fast reads (favoured by OLAP).
-
Batch processing — processing data in scheduled chunks; higher latency, large volumes.
-
Stream processing — processing events continuously as they arrive; very low latency.
-
Data lake — massive, cheap storage holding raw data of any shape (Azure Data Lake Storage Gen2).
-
Data warehouse — curated, query-optimised store of clean, structured data for analytics.
-
Medallion architecture — bronze (raw) → silver (cleaned) → gold (business-ready) refinement layers in a lake.
-
ETL / ELT — Extract-Transform-Load (or Extract-Load-Transform); the process of moving and reshaping data.
-
Database administrator (DBA) — owns the health, security and performance of operational databases.
-
Data engineer — builds the pipelines that ingest, move and transform data.
-
Data analyst — turns curated data into reports, dashboards and business insight.
-
Data scientist — applies statistics and machine learning to make predictions from data.
-
Parquet / ORC — columnar, compressed binary formats optimised for analytical scans.
-
Avro — a compact, row-based binary format with embedded schema, suited to streaming.
-
Schema-on-write — enforcing a table’s shape before data is stored (relational databases); anything that does not fit is rejected.
-
Schema-on-read — storing raw data as-is and applying a shape only when it is read (data lakes, semi-structured and unstructured data).
-
Row store / columnar store — arranging a table physically by rows (fast for whole-record reads/writes, favoured by OLTP) versus by columns (fast for aggregating a few columns over many rows, favoured by OLAP).
-
HTAP (Hybrid Transactional/Analytical Processing) — running analytics directly on transactional data with little or no ETL (e.g. SQL columnstore indexes, Azure Synapse Link for Azure Cosmos DB).
-
Lakehouse — an architecture that adds warehouse-style structure and ACID tables on top of a data lake, so one store serves both raw and curated data.
-
Delta Lake / Delta format — an open table format that layers a transaction log over Parquet files to give ACID tables, updates and time-travel on a lake; the native table format of Azure Databricks and Microsoft Fabric.
-
Microsoft Fabric — Microsoft’s unified SaaS analytics platform (data engineering, warehouse, real-time intelligence and Power BI in one), built on OneLake.
-
OneLake — the single, tenant-wide logical data lake underneath Microsoft Fabric, storing data in the open Delta/Parquet format.
-
Star schema — an analytical model of one central fact table (numeric measures) surrounded by dimension tables (descriptive context); the shape OLAP models and Power BI favour.
-
Fact / dimension table — the events being measured (fact) and the context you slice them by — time, product, region (dimension).
-
Primary key / foreign key — a column (or set) that uniquely identifies each row (primary key), and a column that references another table’s primary key to link records (foreign key).
-
Index — an auxiliary structure that lets a database find matching rows quickly without scanning the whole table.
-
Micro-batch — processing a stream as a rapid sequence of very small batches (e.g. Spark Structured Streaming), blurring the line between batch and streaming.
-
Lambda / kappa architecture — a design combining a batch layer and a streaming (speed) layer (lambda), versus a stream-only design that replays the event log to reprocess history (kappa).
-
Eventual consistency — a scale-and-availability trade-off in which replicas converge to the same value over time rather than instantly; common in globally distributed non-relational stores.
-
Data mart — a small, subject-specific slice of a data warehouse serving a single team or business domain.
Next steps
You now have the vocabulary and the mental models the rest of the track depends on. Next, go hands-on with the most common workload of all in DP-900: Relational Data on Azure — tables, keys, normalisation, basic SQL and the Azure relational family (Azure SQL Database, Managed Instance, PostgreSQL and MySQL). From there the track moves to non-relational data and analytics, where the data lake, Cosmos DB, Synapse, Microsoft Fabric and Power BI ideas introduced here are explored in full.