Microsoft Sentinel is a cloud-native SIEM and SOAR built on Log Analytics. A workspace is cheap to enable and ruinously easy to operate badly — runaway ingestion bills, noisy detections, and incidents nobody triages. This guide stands one up the way it should run in production: deliberate table tiers, KQL detections mapped to MITRE ATT&CK, automated response, and cost under control.
In a nutshell
Picture a modern building’s security control room. Door badges, cameras, motion sensors, and fire alarms all feed their signals onto one wall of screens. A small team watches for anything odd, and when the smoke detector on floor 12 trips, an automatic routine locks the stairwell doors and calls the fire brigade — no human had to notice first. Microsoft Sentinel is that control room for your cloud and on-premises IT. It is a SIEM (Security Information and Event Management — it collects and searches logs from everywhere) fused with a SOAR (Security Orchestration, Automation and Response — it reacts automatically), delivered as a managed Azure service, so you never rack a server or patch a database.
The signals (“sensors”) are data connectors: Entra ID sign-ins, Defender endpoint alerts, firewall logs, Azure activity. They all land in a Log Analytics workspace — the searchable pile of logs Sentinel sits on top of. Analytics rules are the “watchers”: saved KQL queries on a timer that spot a threat pattern and raise an incident. And playbooks — built on Logic Apps — are the “automatic routines” that respond: disable the account, isolate the laptop, ping the SOC in Teams.
Why should a beginner care? Because every one of these pieces is just a resource you deploy and configure, and the whole thing is priced by how much data you ingest. You can enable it in a click; running it well takes discipline. Get the wiring right and you have a security operations centre (SOC) platform a two-person team can run. Get it wrong and you have a very expensive log bucket that alerts on nothing useful. This lesson walks the full pipeline — connect, detect, respond, and control the bill — the way it should look in production.
Level: Advanced · Time: ~45 min
Prerequisites
- Comfort with the Azure portal and the
azCLI, plus an Owner/Contributor role and Microsoft Sentinel Contributor on the subscription or resource group you will use. - Basic KQL (Kusto Query Language) —
where,summarize,project,join. If KQL is new, skim a Log Analytics primer first; every detection here is KQL. - Familiarity with Entra ID (formerly Azure AD), Log Analytics workspaces, and Logic Apps. The identity, monitoring, and automation lessons earlier in this course are the on-ramp.
After this lesson you will be able to
- Stand up a Log Analytics workspace, onboard Sentinel, and choose a single-vs-multi-workspace architecture (including Azure Lighthouse for MSSPs).
- Onboard the data connectors that matter first and route Syslog/CEF through the Azure Monitor Agent with a filtering Data Collection Rule.
- Write scheduled, NRT, and anomaly analytics rules in KQL with entity mapping and MITRE ATT&CK tags.
- Group alerts into incidents, enrich them with UEBA, and automate triage with automation rules.
- Build SOAR playbooks (disable user, isolate device, Teams approval) and wire them to incidents safely.
- Keep ingestion cost under control with table tiers, DCR filtering, and commitment tiers.
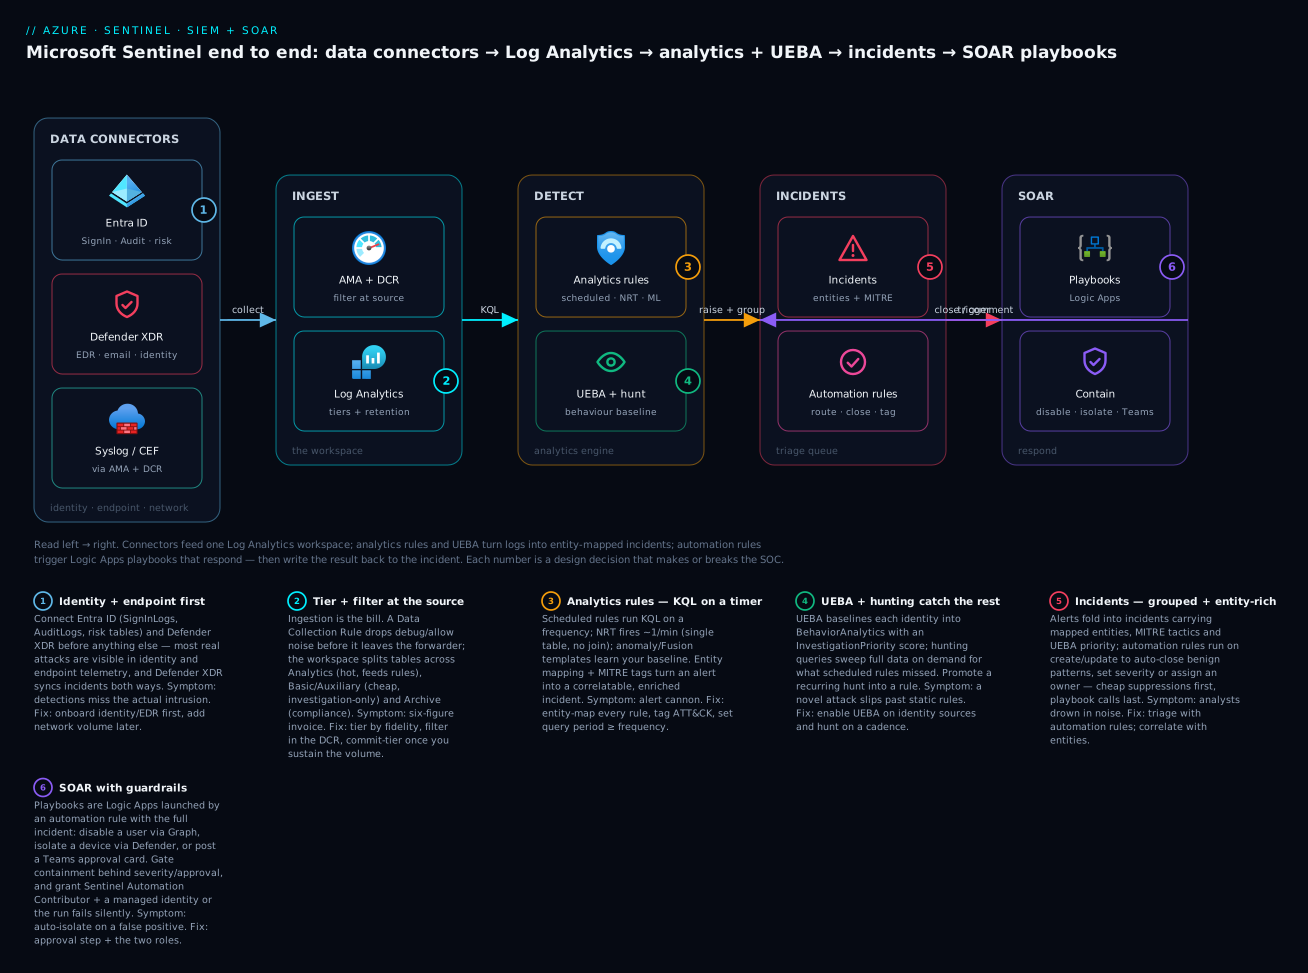
The pipeline reads left to right: data connectors feed one Log Analytics workspace, analytics rules and UEBA turn logs into entity-mapped incidents, and automation rules trigger Logic Apps playbooks that respond — then write their result back to the incident.
1. Workspace and architecture decisions
Sentinel is an offering layered on a Log Analytics workspace (LAW). The decisions you make here are hard to reverse, so get them right first.
One workspace or many? Default to a single regional workspace per environment. Cross-workspace queries exist but add friction, and the per-GB ingestion model means consolidation rarely costs more. Split only for data-residency or strict tenant-isolation reasons. For MSSP or multi-tenant estates, keep workspaces in each tenant and manage them centrally with Azure Lighthouse — delegated access lets your SOC run cross-tenant hunting without storing customer logs in your own tenant.
Table tiers drive most of your bill. Sentinel supports three:
| Tier | Query window | Retention model | Use for |
|---|---|---|---|
| Analytics | Interactive, full | Hot, up to 2 years interactive | Tables that feed analytics rules |
| Basic / Auxiliary | Limited (KQL subset), 30 days interactive | Cheaper ingestion, long-term archive | High-volume, low-fidelity (firewall, NetFlow) |
| Archive | Restore or search jobs | Up to 12 years | Compliance retention |
Set interactive and total retention deliberately. Workspace default is 90 days; per-table overrides let you keep auth logs hot for a year while sending verbose proxy logs to Basic.
# Create the workspace and onboard Sentinel
az monitor log-analytics workspace create \
  --resource-group rg-sec-sentinel \
  --workspace-name law-sentinel-prod \
  --location eastus \
  --retention-time 90

az sentinel onboarding-state create \
  --resource-group rg-sec-sentinel \
  --workspace-name law-sentinel-prod \
  --name default
The
az sentinelcommands ship in thesentinelCLI extension. Install withaz extension add --name sentinel. Much of Sentinel’s advanced surface is REST/ARM only, so expect to mix CLI, Bicep, and the portal.
2. Onboarding data connectors
Detections are only as good as your telemetry. Prioritize identity and endpoint first — that is where most real attacks are visible.
Entra ID and Microsoft Defender XDR connect through the unified Microsoft Defender portal experience or the legacy data connectors. For Entra ID, enable SignInLogs, AuditLogs, and the risk tables (AADUserRiskEvents, AADRiskyUsers). For Defender XDR, the connector streams the Device*, Email*, Alert*, and Identity* tables and synchronizes incidents bidirectionally.
Azure Activity is a built-in connector backed by a Diagnostic Setting that routes the subscription activity log into the AzureActivity table:
az monitor diagnostic-settings subscription create \
  --name "send-activity-to-sentinel" \
  --location eastus \
  --logs '[{"category":"Administrative","enabled":true},
           {"category":"Security","enabled":true},
           {"category":"Policy","enabled":true}]' \
  --workspace "/subscriptions/<sub-id>/resourceGroups/rg-sec-sentinel/providers/Microsoft.OperationalInsights/workspaces/law-sentinel-prod"
Syslog and CEF now flow through the Azure Monitor Agent (AMA), not the retired Log Analytics agent. You deploy a Linux forwarder (or point appliances at it), install AMA, and govern what gets collected with a Data Collection Rule (DCR). CEF lands in CommonSecurityLog; plain syslog in Syslog.
# Install the AMA extension on the Linux log forwarder VM
az vm extension set \
  --resource-group rg-sec-collectors \
  --vm-name vm-cef-forwarder \
  --name AzureMonitorLinuxAgent \
  --publisher Microsoft.Azure.Monitor \
  --enable-auto-upgrade true
The DCR is where you filter at the source — set facilities and minimum log levels so you are not paying to ingest debug from every appliance. Define it once and associate it with the forwarder; the agent applies the filter before data leaves the host.
3. Writing scheduled analytics rules in KQL
Scheduled analytics rules are the core detection engine: a KQL query on a timer that raises alerts and groups them into incidents. Two things separate a usable rule from an alert cannon — entity mapping and MITRE tagging.
Here is a rule detecting brute-force success: many failures followed by a sign-in success from the same identity.
let failureThreshold = 10;
let lookback = 1h;
SigninLogs
| where TimeGenerated > ago(lookback)
| summarize
    Failures = countif(ResultType != 0),
    Successes = countif(ResultType == 0),
    IPs = make_set(IPAddress, 50),
    LastSuccess = maxif(TimeGenerated, ResultType == 0)
  by UserPrincipalName, AppDisplayName
| where Failures >= failureThreshold and Successes > 0
| extend AccountName = tostring(split(UserPrincipalName, "@")[0])
Create it with entity mapping and ATT&CK technique tags so incidents arrive enriched and correlatable:
az sentinel alert-rule create \
  --resource-group rg-sec-sentinel \
  --workspace-name law-sentinel-prod \
  --rule-id "bruteforce-success" \
  --scheduled-alert-rule \
  --display-name "Successful sign-in after repeated failures" \
  --enabled true \
  --severity Medium \
  --query @bruteforce.kql \
  --query-frequency PT1H \
  --query-period PT1H \
  --trigger-operator GreaterThan \
  --trigger-threshold 0 \
  --tactics CredentialAccess \
  --techniques T1110
Entity mapping binds query columns to entities (Account, IP, Host, etc.). Without it, Sentinel cannot deduplicate, correlate across rules, or feed the investigation graph. Map
AccountNameto Account andIPsto IP at minimum — this is what makes “show me everything this user did” work later.
Set query period >= frequency to avoid coverage gaps, and prefer event grouping = single alert per result row when each row is a distinct incident.
4. Tuning out noise
A SOC drowns in false positives before it misses a real one. Three levers, in order of preference:
- Tighten the query. Most noise is a missing
where. Exclude known scanners, service accounts, and sanctioned automation in the KQL itself using a watchlist join rather than hardcoded values. - Near-real-time (NRT) rules for the handful of detections that must fire within a minute (e.g., break-glass account sign-in). NRT rules run roughly every minute but carry constraints — one table, no
jointo other tables. Reserve them for true time-critical cases. - Automation rules for triage logic that does not belong in a playbook: auto-close known-benign patterns, set severity, assign an owner, or add tags based on incident properties.
// Suppress sanctioned automation via a watchlist instead of inline strings
let allowed = _GetWatchlist('SanctionedServiceAccounts') | project SearchKey;
SigninLogs
| where ResultType == 0
| where UserPrincipalName !in (allowed)
Automation rules run on incident creation or update and execute conditions top-down — order them so cheap suppressions run before expensive playbook calls. Use them to auto-close, then to route, then to enrich.
5. Building SOAR playbooks with Logic Apps
Playbooks are Logic Apps triggered by Sentinel. The recommended pattern is the incident trigger (the playbook receives the full incident with mapped entities) wired up through an automation rule. Three high-value playbooks:
Disable a compromised user via Microsoft Graph. The Logic App’s managed identity (or a connection) needs the Graph User.ReadWrite.All permission.
{
  "method": "PATCH",
  "uri": "https://graph.microsoft.com/v1.0/users/@{triggerBody()?['object']?['properties']?['relatedEntities'][0]['properties']['aadUserId']}",
  "headers": { "Content-Type": "application/json" },
  "body": { "accountEnabled": false }
}
Isolate a device through the Defender for Endpoint connector action (Isolate machine), passing the device entity’s machine ID and an isolation type of Full. Always pair containment actions with an approval step or scope them to high-severity incidents only — auto-isolating production boxes on a medium-confidence alert is how SOAR earns a bad name.
Post to Teams for human-in-the-loop. Use the Teams connector to send an adaptive card to the SOC channel with the incident title, severity, entities, and Confirm / Dismiss buttons that call back into Sentinel.
Wire any playbook to incidents with an automation rule:
az sentinel automation-rule create \
  --resource-group rg-sec-sentinel \
  --workspace-name law-sentinel-prod \
  --automation-rule-id "run-disable-user" \
  --display-name "High severity -> disable user playbook" \
  --order 1 \
  --triggering-logic '{
    "isEnabled": true,
    "triggersOn": "Incidents",
    "triggersWhen": "Created",
    "conditions": [{
      "conditionType": "Property",
      "conditionProperties": {
        "propertyName": "IncidentSeverity",
        "operator": "Equals",
        "propertyValues": ["High"]
      }
    }]
  }' \
  --actions '[{
    "order": 1,
    "actionType": "RunPlaybook",
    "actionConfiguration": {
      "logicAppResourceId": "/subscriptions/<sub-id>/resourceGroups/rg-sec-soar/providers/Microsoft.Logic/workflows/pb-disable-user",
      "tenantId": "<tenant-id>"
    }
  }]'
Sentinel’s automation service principal needs the Microsoft Sentinel Automation Contributor role on the resource group holding your playbooks, or the run silently fails to launch.
6. UEBA and anomaly-based detections
User and Entity Behavior Analytics profiles normal behavior and surfaces deviations no static rule would catch. Enable it from Settings -> Entity behavior; it requires the identity sources — at minimum SigninLogs, AuditLogs, SecurityEvent, and the Azure Activity log.
Once enabled, UEBA enriches events into BehaviorAnalytics with peer-group context and investigation priority scores. Query it directly in detections and hunts:
BehaviorAnalytics
| where ActivityType == "LogOn"
| where InvestigationPriority >= 7
| project TimeGenerated, UserPrincipalName, SourceIPAddress,
          ActivityInsights, InvestigationPriority
| order by InvestigationPriority desc
Sentinel also ships anomaly rule templates (ML-based, customizable thresholds) for things like anomalous data egress and rare process execution. Turn the relevant ones to production after observing them in flight mode — they are tuned on your own baseline, so give them data before trusting them.
7. Controlling cost
Ingestion is the bill. The discipline is simple: ingest high-fidelity data to Analytics, dump high-volume low-value data to Basic/Auxiliary, and filter the rest at the source.
- Data Collection Rules drop noise before ingestion — the cheapest GB is the one you never send.
- Basic / Auxiliary logs cut per-GB cost dramatically for tables you only query during an investigation (firewall, DNS, proxy). You trade interactive query power for price.
- Commitment tiers switch you from pay-as-you-go to a discounted daily capacity reservation once you sustain ~100 GB/day or more.
# Move a verbose table to the Basic tier
az monitor log-analytics workspace table update \
  --resource-group rg-sec-sentinel \
  --workspace-name law-sentinel-prod \
  --name CommonSecurityLog \
  --plan Basic
Watch spend with the Usage table and review it weekly — ingestion creep is gradual and nobody notices until the invoice.
Usage
| where TimeGenerated > ago(30d)
| where IsBillable == true
| summarize BillableGB = sum(Quantity) / 1000 by DataType
| order by BillableGB desc
8. Hunting, workbooks, and validating detections
Proactive hunting queries run on demand against your full data to find what scheduled rules missed; bookmark interesting results and promote recurring ones into analytics rules. Workbooks turn KQL into operational dashboards — start from the built-in templates (Security Operations Efficiency, Identity & Access) and customize.
Crucially, validate that detections fire. Do not wait for a real attacker. Generate benign, controlled signal — for example, a deliberate burst of failed sign-ins from a test account, or running attack-simulation tooling in a lab subscription — and confirm the rule produces an incident with the right entities and severity. A detection you have never seen trigger is a detection you do not have.
Enterprise scenario
A retail platform team onboarded their Palo Alto firewalls to Sentinel and watched ingestion jump to ~280 GB/day overnight — almost all of it TRAFFIC allow logs nobody queried. The reflex was to drop the table, but the SOC still needed those flows for occasional egress investigations, and compliance required 12 months of retention. Deleting the connector was off the table.
The fix was tiering plus source-side filtering, not deletion. CommonSecurityLog was already feeding two analytics rules, so blindly moving the whole table to Basic would have broken them (Basic tier can’t back scheduled rules). They split the stream: keep THREAT and deny events on Analytics where detections live, and route the high-volume allow TRAFFIC rows to Auxiliary with long-term archive. The DCR did the filtering before the bytes ever left the forwarder:
source
| where DeviceVendor == "Palo Alto Networks"
| where not(DeviceProduct == "PAN-OS"
    and Activity == "TRAFFIC"
    and DeviceAction == "allow")
Allowed-traffic rows were sent to a separate Auxiliary-tier custom table (PaloAltoTraffic_CL) via a second DCR with --plan Basic retention extended to 365 days. Net effect: billable Analytics ingestion fell roughly 70%, the brute-force and egress rules kept firing on the THREAT stream, and investigators could still search the archived flows when a case demanded it. The lesson — never tier or drop a table without first checking which rules depend on it; split the stream by fidelity instead.
Verify
Confirm the pipeline end to end before declaring victory:
// Data is flowing on every key table
union withsource=Tbl SigninLogs, AzureActivity, CommonSecurityLog, DeviceEvents
| where TimeGenerated > ago(1h)
| summarize Events = count(), Latest = max(TimeGenerated) by Tbl
# List enabled analytics rules and their severities
az sentinel alert-rule list \
  --resource-group rg-sec-sentinel \
  --workspace-name law-sentinel-prod \
  --query "[?enabled].{name:displayName, severity:severity}" -o table
- Connectors show Connected and their tables return recent rows.
- A test trigger produces an incident with mapped entities and MITRE tactics.
- The bound automation rule launches the playbook (check the Logic App run history).
- The
Usagequery matches your expected daily ingestion.
Deployment checklist
Pitfalls
- Ingesting everything to Analytics. The fastest way to a six-figure bill. Tier and filter from day one.
- Skipping entity mapping. Without it, correlation, deduplication, and the investigation graph all break — your SIEM becomes a log search box.
- Auto-remediation without guardrails. Containment playbooks on low-confidence alerts will isolate production. Gate them behind severity, approval, or both.
- Missing automation permissions. No Sentinel Automation Contributor role on the playbook resource group means rules fire but playbooks never run — and the failure is silent.
- Detections that never trigger. Validate with simulated attacks; an untested rule is a false sense of security, not coverage.
Sentinel rewards discipline. Decide your tiers, ingest the telemetry that matters, write detections that map to ATT&CK and carry entities, automate the response with guardrails, and watch the bill weekly. Do that and you have a SOC platform that scales — not a log graveyard with a security label on it.
Going deeper
Sentinel is a layer, not a database — what you actually pay for
Sentinel has no storage of its own. It is a set of rules, workbooks, and metadata that Azure layers onto a Log Analytics workspace, exposed through the Microsoft.SecurityInsights resource provider. That has three practical consequences.
- Two meters, one pipe. Every ingested GB is billed once by Log Analytics (data ingestion) and again by the Sentinel analytics surcharge on top; retention beyond the free window is a third meter. When you estimate cost, add both — a “cheap” 200 GB/day workspace is two line items, not one. Tables covered by a Defender for Servers P2 or an E5/A5 grant come with a per-node data allowance, so a chunk of your identity/Defender telemetry is often partly “free.”
- Everything is a resource. The workspace is
Microsoft.OperationalInsights/workspaces; onboarding isMicrosoft.SecurityInsights/onboardingStatesnameddefault; rules and automation arealertRulesandautomationRulesunder the same provider. That is why Sentinel is fully deployable as Bicep or Terraform, not just clicks:
resource workspace 'Microsoft.OperationalInsights/workspaces@2023-09-01' existing = {
  name: 'law-sentinel-prod'
}

resource onboarding 'Microsoft.SecurityInsights/onboardingStates@2023-11-01' = {
  scope: workspace
  name: 'default'
  properties: {}
}
- You can transform data before it lands. A workspace transformation DCR runs a KQL transform at ingestion time on any table (not only AMA sources) — drop columns you never query, redact a PII field, or filter rows. The cheapest, least-queried GB is the one you never keep, and this is the one filter that works even for connectors whose agent you do not control.
The commitment-tier cost model, with numbers
Pay-as-you-go bills per GB with no floor. Commitment tiers trade that for a fixed daily reservation at a discount — available at 100, 200, 300, 400, 500, 1000, 2000, and 5000 GB/day (and higher by arrangement). You pay for that capacity whether or not you fill it; overage bills at the tier’s effective per-GB rate. Both the Log Analytics and the Sentinel meters have their own commitment tiers, and you set them independently.
The decision is a break-even: if sustained ingestion sits above a tier’s daily volume, the discount (typically ~15–30% depending on tier) beats PAYG. A workspace steadily doing ~180 GB/day is usually cheaper on the 100 or 200 GB commitment tier than on PAYG — model it on your own 30-day Usage numbers first, because a tier set too high burns money on unused capacity. (Figures are illustrative; always check current regional pricing.)
Below the Analytics tier sit two cheaper homes for high-volume, low-fidelity data:
| Tier | Ingestion cost | Interactive query | Backs analytics rules? | Best for |
|---|---|---|---|---|
| Analytics | Full price | Full KQL, up to 2 yrs | Yes | Detections, correlation, hunting |
| Basic | Fraction of Analytics | KQL subset, 8-day, per-query search charge | No | Firewall/proxy/DNS you query during an investigation |
| Auxiliary | Cheapest | KQL subset + search/restore jobs | Summary rules only | Very high-volume verbose logs, compliance |
| Archive | Storage-only | Restore or search job | No | 2–12 year retention |
The trap the Enterprise scenario above hit: Basic and Auxiliary tables cannot back a scheduled analytics rule. Move a table a rule depends on and the rule silently stops matching. Split the stream by fidelity instead — keep the rows detections need on Analytics, send the bulk to Auxiliary.
Analytics rule types — the whole engine, not just scheduled
Scheduled rules are the workhorse, but Sentinel runs several rule engines, and knowing which to reach for is half the skill.
- Scheduled — your KQL on a
query-frequency/query-period. Full KQL, joins, entity mapping, event and alert grouping. Set period ≥ frequency or you leave coverage gaps. - NRT (Near-Real-Time) — runs roughly every minute for the handful of detections that must fire fast (break-glass sign-in). Constraints: effectively one table, no cross-table
join/union, and a reduced feature set. Reserve for genuinely time-critical cases; NRT is not a faster version of every rule. - Anomaly (ML templates) — Microsoft-tuned machine-learning models with customizable thresholds. Run them in flighting mode first so they learn your baseline, then flip to production.
- Fusion — a built-in ML correlation engine that stitches low-fidelity signals across products into high-fidelity multistage attack incidents. On by default; you tune it, you do not author it.
- Microsoft Security — pass-through rules that turn alerts from Microsoft security products (Defender for Cloud, MDE, MDI) into Sentinel incidents.
- Threat Intelligence — matches your logs against threat-intel indicators (IOCs) imported through the TI connectors.
Entity mapping is the single feature that turns alerts into an investigable graph. It binds query columns to typed entities (Account, IP, Host, URL, FileHash, …). Without it Sentinel cannot deduplicate, correlate across rules, drive the investigation graph, or let a playbook read “the user” from the incident. Layered on top:
- Custom details surface chosen columns on the alert for triage without opening the query.
- Event grouping — single alert per rule run (default) vs an alert per result row (when each row is its own case).
- Alert grouping — how alerts fold into one incident: by matching entities, by selected details, or all into one, within a lookback window. This is your main lever against incident sprawl.
- Suppression — after a rule fires, stop it re-firing for N hours.
A KQL performance note that matters at SOC scale: filter on TimeGenerated first, prefer has over contains (it is term-indexed), project early to shrink the pipeline, use arg_max()/summarize to collapse to the latest row, and avoid bare search *. A scheduled rule that scans too wide will time out or throttle before it ever raises an alert.
Incidents, investigation, and UEBA under the hood
An incident is a container of one or more alerts plus their entities, MITRE tactics, a severity, an owner, and a status (New → Active → Closed, closed with a classification: TruePositive / BenignPositive / FalsePositive / Undetermined). The investigation graph walks entity relationships visually; tasks give analysts a repeatable checklist per incident.
When the Defender XDR connector is on, incidents sync bidirectionally: close it in Sentinel and it closes in the Defender portal, and vice versa. That is powerful and a footgun — an automation rule that auto-closes on the Sentinel side also resolves the XDR incident, so scope such rules tightly.
UEBA builds behavioural baselines from the identity sources (SigninLogs, AuditLogs, SecurityEvent, AzureActivity) into three tables: BehaviorAnalytics (scored activities), IdentityInfo (the enriched directory), and UserPeerAnalytics (peer groups). Each activity gets an InvestigationPriority (0–10) blending rarity, peer-group deviation, and blast radius, so a hunt can sort by “most anomalous” rather than “most recent.” UEBA is enrichment, not a rule — you query it inside detections and hunts, as the BehaviorAnalytics example above shows.
SOAR internals: automation rules vs playbooks
These are two different things people conflate.
- Automation rules are no-code orchestration inside Sentinel. They trigger on incident create/update (or alert create), evaluate ordered conditions on incident properties, and take actions: change severity/status/owner, add tags or tasks, and/or run a playbook. Because they run in
order, put cheap suppressions (auto-close known-benign) before expensive playbook calls. - Playbooks are Logic Apps — the actual workflow that talks to the outside world (Graph, Defender, Teams, ServiceNow). Two flavours: Consumption (per-action billing, simplest) and Standard (single-tenant, VNet integration, better economics at high run volume). The modern auth pattern is a managed identity on the Logic App granted the target API’s role (Graph
User.ReadWrite.Allto disable a user), rather than a stored connection.
The permission that silently breaks SOAR: Sentinel’s automation service principal needs Microsoft Sentinel Automation Contributor on the resource group holding the playbooks, and the playbook’s own identity needs rights on whatever it acts against. Miss either and the automation rule “runs” but nothing happens. Design containment playbooks to be idempotent (disabling an already-disabled user must be a no-op) and gated (a severity threshold or a Teams approval) so a false positive can never isolate production.
Content hub, solutions, and detections-as-code
You rarely start from a blank rule. The Content hub is an in-product marketplace of solutions — packaged bundles per product (say, Palo Alto or Okta) that install the data connector, analytics and hunting rules, workbooks, playbooks, and parsers together. Install from the portal or as ARM. For teams that treat detections like code, the Repositories feature connects the workspace to GitHub or Azure DevOps and deploys content through CI/CD, so rules are version-controlled and promoted across environments rather than hand-edited in the portal.
Workspace architecture, RBAC, and Lighthouse for MSSP
Default to one regional workspace per environment; cross-workspace queries (workspace("law-b").SigninLogs | union …) exist but add friction and hit a workspace-count ceiling per query. Split only for data residency, hard RBAC isolation, or ownership boundaries.
RBAC is layered: Microsoft Sentinel Reader / Responder / Contributor govern Sentinel actions, but a user also needs Log Analytics read on the workspace to run queries. For least privilege, resource-context and table-level RBAC scope who sees which rows or tables — for example, app teams see only their own resources’ logs.
For an MSSP or any multi-tenant estate, keep each customer’s workspace in the customer’s own tenant and use Azure Lighthouse to project delegated access into your SOC tenant. Your analysts run cross-tenant hunting, triage incidents, and launch playbooks without customer logs ever leaving the customer tenant — the compliance and blast-radius story that copying data into a central workspace cannot match.
The Defender portal convergence — where Sentinel is heading
Microsoft has been converging Sentinel into the unified Microsoft Defender portal (security.microsoft.com) as the single SecOps surface, merging Sentinel’s incidents and hunting with Defender XDR’s. You onboard a workspace to the unified portal and get one incident queue across SIEM and XDR, advanced hunting with KQL over both data sets, and unified RBAC. As of this writing the standalone Azure-portal experience for Sentinel is being retired in favour of the Defender portal, so plan new deployments around security.microsoft.com and treat the Azure-portal blades as legacy. Convergence is ongoing — confirm the current GA or retirement status for any feature you depend on.
Practice challenges
Work these in a lab subscription. No live runs are shown — every command is schema-correct and current; replace each <placeholder> with your own value. Solutions are collapsed; try first, then expand.
1. Stand up the platform (beginner). Create a Log Analytics workspace law-lab in rg-sec-lab with 90-day retention and onboard Sentinel.
<details> <summary>Show solution</summary>
az extension add --name sentinel   # once per machine

az group create --name rg-sec-lab --location eastus
az monitor log-analytics workspace create \
  --resource-group rg-sec-lab --workspace-name law-lab \
  --location eastus --retention-time 90
az sentinel onboarding-state create \
  --resource-group rg-sec-lab --workspace-name law-lab --name default
Why: every rule, connector, and playbook is a child of the workspace and its onboarding state — nothing else in this lesson works until these two exist. </details>
2. Get the free, high-value telemetry flowing (beginner). Route the subscription Activity log into the workspace and confirm rows land in AzureActivity.
<details> <summary>Show solution</summary>
az monitor diagnostic-settings subscription create \
  --name send-activity-to-sentinel --location eastus \
  --logs '[{"category":"Administrative","enabled":true},{"category":"Security","enabled":true}]' \
  --workspace "/subscriptions/<sub-id>/resourceGroups/rg-sec-lab/providers/Microsoft.OperationalInsights/workspaces/law-lab"
Then, in Logs:
AzureActivity | where TimeGenerated > ago(1h) | summarize count() by OperationNameValue
Why: AzureActivity is a built-in, no-agent connector and one of the cheapest sources of real control-plane signal — the fastest way to prove your pipeline actually carries data.
</details>
3. Detect a privileged role assignment (intermediate). Write a scheduled rule that fires when a user is added to an Entra directory role, mapped to the Account entity and tagged to MITRE Privilege Escalation.
<details> <summary>Show solution</summary>
AuditLogs
| where OperationName == "Add member to role" and Result == "success"
| extend Initiator  = tostring(InitiatedBy.user.userPrincipalName)
| extend TargetUser = tostring(TargetResources[0].userPrincipalName)
| mv-apply mp = TargetResources[0].modifiedProperties on (
    where tostring(mp.displayName) == "Role.DisplayName"
    | extend RoleName = trim('"', tostring(mp.newValue)))
| project TimeGenerated, Initiator, TargetUser, RoleName
az sentinel alert-rule create \
  --resource-group rg-sec-lab --workspace-name law-lab \
  --rule-id "priv-role-added" --scheduled-alert-rule \
  --display-name "User added to a privileged directory role" \
  --enabled true --severity Medium --query @privrole.kql \
  --query-frequency PT1H --query-period PT1H \
  --trigger-operator GreaterThan --trigger-threshold 0 \
  --tactics PrivilegeEscalation --techniques T1098
Map Initiator and TargetUser to the Account entity in the rule.
Why: role grants are a classic persistence/escalation step; without entity mapping and tactics the alert cannot correlate with the user’s other activity or slot into the ATT&CK view. </details>
4. Find and tame your biggest table (intermediate → advanced). Identify the top 5 billable tables over 30 days, then move the noisiest verbose table to the Basic tier.
<details> <summary>Show solution</summary>
Usage
| where TimeGenerated > ago(30d) and IsBillable == true
| summarize BillableGB = sum(Quantity) / 1000 by DataType
| top 5 by BillableGB desc
az monitor log-analytics workspace table update \
  --resource-group rg-sec-lab --workspace-name law-lab \
  --name CommonSecurityLog --plan Basic
Why: ingestion is the bill; you cannot tune what you have not measured, and moving a verbose, investigation-only table off Analytics is the single biggest cost lever — but only for tables no analytics rule depends on. </details>
5. Auto-close known-benign noise before it reaches a human (advanced). Create an automation rule that closes incidents whose title marks them as a sanctioned scan, running first (order 1).
<details> <summary>Show solution</summary>
az sentinel automation-rule create \
  --resource-group rg-sec-lab --workspace-name law-lab \
  --automation-rule-id "autoclose-sanctioned-scan" \
  --display-name "Auto-close sanctioned vulnerability scans" --order 1 \
  --triggering-logic '{"isEnabled":true,"triggersOn":"Incidents","triggersWhen":"Created",
    "conditions":[{"conditionType":"Property","conditionProperties":{
      "propertyName":"IncidentTitle","operator":"Contains","propertyValues":["Sanctioned vulnerability scan"]}}]}' \
  --actions '[{"order":1,"actionType":"ModifyProperties","actionConfiguration":{
      "status":"Closed","classification":"BenignPositive","classificationComment":"Approved internal scanner"}}]'
Why: automation rules run in order; putting cheap suppressions before any RunPlaybook action keeps benign noise off the analyst queue — and stops it triggering expensive downstream playbooks.
</details>
6. Respond automatically — with a guardrail (advanced). Wire a “disable user” playbook to fire only on High-severity incidents, and state the exact roles required.
<details> <summary>Show solution</summary>
az sentinel automation-rule create \
  --resource-group rg-sec-lab --workspace-name law-lab \
  --automation-rule-id "run-disable-user" \
  --display-name "High severity -> disable user playbook" --order 2 \
  --triggering-logic '{"isEnabled":true,"triggersOn":"Incidents","triggersWhen":"Created",
    "conditions":[{"conditionType":"Property","conditionProperties":{
      "propertyName":"IncidentSeverity","operator":"Equals","propertyValues":["High"]}}]}' \
  --actions '[{"order":1,"actionType":"RunPlaybook","actionConfiguration":{
      "logicAppResourceId":"/subscriptions/<sub-id>/resourceGroups/rg-sec-soar/providers/Microsoft.Logic/workflows/pb-disable-user",
      "tenantId":"<tenant-id>"}}]'
Roles required: Sentinel’s automation service principal needs Microsoft Sentinel Automation Contributor on rg-sec-soar; the playbook’s managed identity needs Graph User.ReadWrite.All. The IncidentSeverity == High condition is the guardrail.
Why: this is SOAR done safely — the severity condition prevents a medium-confidence alert from disabling an account, and those two roles are the exact reason a rule can “run” while nothing actually happens. </details>
Common beginner mistakes
- “Sentinel is a separate database from Log Analytics.” It is not — Sentinel is a layer on a Log Analytics workspace. Retention, table tiers, and half your bill live in Log Analytics, not in “Sentinel.” Manage them there.
- “Turn on every connector for maximum coverage.” Volume is not fidelity, and you pay per GB. Onboard identity and endpoint first (that is where attacks show), then add sources deliberately behind a filtering DCR — not all of them on day one.
- “More analytics rules means better detection.” A hundred untuned rules is an alert cannon nobody triages. A handful of entity-mapped, MITRE-tagged, validated rules beats a wall of noise. An untested rule is not coverage.
- “Basic tier is just cheaper Analytics.” Basic and Auxiliary cannot back scheduled analytics rules, expose only a KQL subset, keep a short interactive window, and add a per-query search charge. Use them for investigation-only data, never for tables a rule reads.
- “Playbooks are scripts I write in code.” Playbooks are Logic Apps — low-code workflows — triggered by automation rules, and they will not run at all without the right RBAC (Automation Contributor) and a managed identity holding the target API’s permissions.
- “Closing an incident deletes the logs.” Closing is workflow state; the underlying events stay in Log Analytics for their retention period. And with Defender XDR sync on, closing in Sentinel also closes the incident in the Defender portal.
- “I’ll skip entity mapping and add it later.” Without entities there is no correlation, no deduplication, no investigation graph, and playbooks cannot read “the user” or “the IP” from the incident. Map entities when you write the rule, not after it is noisy.
Glossary
- SIEM — Security Information and Event Management: a system that centralises logs and runs detections over them. Sentinel is the SIEM half.
- SOAR — Security Orchestration, Automation and Response: automated reaction to incidents. In Sentinel, automation rules plus playbooks.
- Log Analytics workspace (LAW) — the Azure Monitor data store Sentinel is built on; it holds the tables you query with KQL.
- Data connector — a packaged integration that streams a source’s logs into the workspace (Entra ID, Defender XDR, Azure Activity, CEF, and so on).
- KQL (Kusto Query Language) — the read-only query language for Log Analytics; every detection and hunt is written in KQL.
- AMA (Azure Monitor Agent) — the current log-collection agent (it replaced the retired Log Analytics agent) for Syslog/CEF and VM telemetry.
- DCR (Data Collection Rule) — configuration that tells AMA, or ingestion itself, what to collect, filter, and transform before data lands.
- Workspace transformation DCR — a DCR that applies a KQL transform at ingestion time to any table, to drop, mask, or filter data before it is billed.
- CEF / Syslog — Common Event Format and Syslog: standard formats network and security appliances emit; they land in
CommonSecurityLogandSyslog. - Analytics rule — a saved detection. Types: Scheduled (KQL on a timer), NRT (~1/min), Anomaly (ML), Fusion, Microsoft Security, and Threat Intelligence.
- Entity mapping — binding query columns to typed entities (Account, IP, Host, …) so incidents correlate, deduplicate, and feed the investigation graph.
- MITRE ATT&CK — an industry taxonomy of adversary tactics (the why, e.g. Credential Access) and techniques (the how, e.g. T1110 Brute Force) used to tag detections.
- Alert / Incident — an alert is one firing of a rule; an incident is one or more grouped alerts with entities, tactics, severity, owner, and status — the unit analysts triage.
- UEBA — User and Entity Behaviour Analytics: baselines normal behaviour into
BehaviorAnalyticsand scores anomalies with an InvestigationPriority (0–10). - Automation rule — no-code orchestration inside Sentinel that runs on incident or alert events to modify properties or run a playbook, in order.
- Playbook — a Logic App triggered by Sentinel to respond (disable user, isolate device, post to Teams); billed as Consumption or Standard.
- Managed identity — an Azure-managed credential a Logic App uses to call Graph, Defender, and other APIs without any stored secret.
- Watchlist — an uploaded reference list (allowlists, VIP users, asset inventory) joined into KQL via
_GetWatchlist(). - Hunting query / Bookmark — an on-demand KQL sweep for threats scheduled rules missed; interesting results are bookmarked and can be promoted to rules.
- Workbook — an interactive, KQL-backed dashboard for SOC operations.
- Content hub / Solution — the in-product marketplace and its packaged bundles (connector, rules, workbooks, and playbooks per product).
- Repositories — the CI/CD feature connecting the workspace to GitHub or Azure DevOps for detections-as-code.
- Table tier — Analytics (full, feeds rules), Basic/Auxiliary (cheap, query-limited), Archive (long-term); set per table.
- Commitment tier — a discounted fixed daily ingestion reservation (100–5000+ GB/day) that replaces pay-as-you-go.
- Azure Lighthouse — delegated cross-tenant management; it lets an MSSP SOC operate a customer’s Sentinel without moving the customer’s data.
- MSSP — Managed Security Service Provider: a firm running SOC operations across multiple customer tenants.
- Defender XDR — Microsoft’s extended detection and response suite (endpoint, email, identity, apps); it connects to Sentinel and converges in the unified Defender portal.
- Sentinel Automation Contributor — the role Sentinel’s service principal needs on a playbook’s resource group for automation rules to launch it.
- Entra ID — Microsoft’s cloud identity service, formerly Azure Active Directory (Azure AD); the top source of security-relevant sign-in and audit logs.