A payments platform team is drowning in trace cost. They run a managed APM whose per-host, per-span pricing has crossed six figures a month, and 95% of the traces it ingests are never looked at — yet the 5% that matter, the ones behind a checkout latency spike at 02:00, are exactly the ones sampled away before an engineer can pull them. The mandate from the platform lead is precise: own the tracing backend, store the raw spans cheaply enough to keep everything for a useful window, and still get the dashboards and SLO alerts the old vendor gave for free. This guide builds that. Grafana Tempo is a distributed tracing backend with one radical design choice: it indexes only by trace ID and stores the trace bodies as columnar Parquet blocks in object storage, so a terabyte of retained traces costs roughly the price of a terabyte of S3 rather than the price of a search cluster. You run it as a set of independently-scalable microservices, point it at an S3 bucket as the only durable store, turn on the metrics-generator so it derives RED metrics (Rate, Errors, Duration) and service-graph metrics from the span stream and remote_writes them to Prometheus, and query it in TraceQL — a language purpose-built for traces where “show me every checkout span over 2s that errored” is one line and “the p95 of the database calls” is an aggregate computed over raw spans.
This is an advanced, hands-on guide, and the deployment is the point. We will not narrate Tempo from a slide; we will stand up a horizontally-scaled cluster on Kubernetes, land traces in S3 in the vParquet4 block format, watch the compactor merge blocks in the background, wire the generator’s RED metrics into Prometheus with exemplars so a latency graph links straight to the trace that caused the spike, and then break things on purpose and read the exact metrics and logs that name the failure. Along the way every component gets its own section — what it does, the config that matters, the limits that bite, and the metric you watch to scale it — because in distributed mode “Tempo is slow” is never a useful sentence; the useful sentence is “the query-frontend’s job queue is backing up because the queriers are S3-read-bound,” and this guide teaches you to say that.
By the end you will have a production-shaped Tempo cluster: traces in S3 under a compaction and retention policy you chose deliberately, RED and service-graph metrics flowing to Prometheus, TraceQL search and TraceQL metrics both working, exemplars closing the loop from a metric spike to a trace, multitenancy and per-tenant limits configured, tail-based sampling at the collector cutting the bill by an order of magnitude, and a clear mental model of when Tempo is the right backend and when Jaeger still wins. You will also have the sizing math to defend the design in a review and the troubleshooting table to keep open at 02:14.
What problem this solves
Distributed tracing has a cost shape that punishes the naive backend. A trace is cheap to produce — the OpenTelemetry SDK adds a span at negligible overhead — but expensive to store and search if you index every attribute, because a full-text or attribute index over high-cardinality span data (URLs, user IDs, request bodies) grows faster than the traces themselves and forces you onto expensive, memory-hungry search infrastructure (this is the Elasticsearch-behind-Jaeger cost curve that drove teams to managed APM in the first place). Managed APM solves the operational pain but replaces it with a pricing model — per host, per span, per GB ingested — that makes keeping traces the enemy. So teams sample aggressively at the head (drop 90% of traces before they are recorded), and then discover during an incident that the trace they need was one of the 90% thrown away.
Tempo attacks the cost curve directly: do not build a big index. Index only the trace ID (and, since recent versions, a small set of block-level metadata Tempo uses to prune which blocks a search must touch), store the trace bodies as compressed columnar Parquet in object storage, and answer “give me trace X” with a cheap object fetch. Search that used to require an index is instead a scan of the columnar blocks — parallelised across queriers and pruned by block metadata — which is slower per query than a hot index but astronomically cheaper to store, and fast enough when you shard the query and let object storage serve the bytes. That single trade — accept scan-based search to eliminate the index — is what lets you keep 100% of sampled traces for 30 days at object-storage prices.
What breaks without this: you either pay APM per-span pricing to keep traces (and sample away the ones you need to control the bill), or you run Jaeger on Elasticsearch and pay for and operate a search cluster whose cost scales with retention. Who hits it: any team past the toy stage of tracing — enough services and enough traffic that trace volume is a real line item, and enough incidents that “we sampled that trace away” has cost them a postmortem. It bites hardest on cost-sensitive platforms with bursty traffic (flash sales, batch jobs) where head sampling is a blunt instrument and the traces that matter cluster exactly in the moments you are tempted to sample harder.
To frame the whole system before the deep dive, here is every Tempo component, what it does, whether it holds state, and the signal you scale it on:
| Component | Read or write path | Stateful? | What it does | Scale signal |
|---|---|---|---|---|
| Distributor | Write | No | Receives spans (OTLP/Jaeger/Zipkin), validates, shards by trace ID to ingesters | Incoming span rate (CPU-bound) |
| Ingester | Write | Yes (WAL + local blocks) | Batches spans into blocks in memory, flushes complete blocks to S3 | Active trace volume; flush pressure |
| Metrics-generator | Write (tap) | Yes (local WAL) | Derives RED + service-graph metrics from the span stream, remote_writes to Prometheus |
Span rate (memory-heavy) |
| Compactor | Background | No (leases blocks) | Merges small S3 blocks into larger ones; enforces block retention | S3 outstanding-blocks backlog |
| Query-frontend | Read | No | Splits a TraceQL query into sub-jobs, queues and schedules them, assembles results | Query queue length; query latency |
| Querier | Read | No | Pulls sub-jobs, searches ingesters (recent) + S3 blocks (older), returns partials | Query concurrency; S3 read throughput |
Learning objectives
By the end of this article you can:
- Explain Tempo’s microservices architecture end to end — distributor, ingester, metrics-generator, compactor, query-frontend, querier — and name the hash rings that bind the stateful ones together.
- Configure an S3 backend correctly, choose the vParquet block-format version deliberately, and reason about how the columnar block layout makes scan-based search viable without a big index.
- Write TraceQL fluently: structural span selectors, attribute and intrinsic filters,
&&/||scoping across spans, and the metrics extensions (rate,quantile_over_time,count_over_time) that aggregate over raw spans. - Turn on the metrics-generator with the
service-graphs,span-metrics, andlocal-blocksprocessors, and rebuild the RED dashboards an APM gave you in PromQL against the generated series. - Wire trace-to-metrics, trace-to-logs, and exemplars so a Prometheus spike links to the exact trace and a trace’s spans link to their logs in Loki.
- Set retention and tune compaction so blocks stay searchable for exactly your window and object counts stay sane — and know why
block_retention(not an S3 lifecycle rule) owns deletion. - Configure multitenancy and per-tenant ingestion/read limits, and place tail-based sampling at the collector so you keep every error and slow trace while cutting the bill by ~10×.
- Size each component from real signals, and decide when Tempo is the right backend versus when Jaeger (or a managed APM) still wins.
Prerequisites & where this fits
You should already operate Kubernetes and Prometheus in anger. Specifically: a cluster (EKS, GKE, AKS, or self-managed) with at least 16 vCPU / 32 GiB of schedulable headroom and kubectl + helm 3.14+ configured against it; an S3 bucket (or S3-compatible store — MinIO, GCS via the S3 API, Cloudflare R2) in the same region as the cluster, plus an IAM role you can attach to pods via IRSA (EKS), Workload Identity (GKE), or a Vault-issued dynamic credential; a running Prometheus (or Grafana Mimir / Grafana Cloud) reachable via remote_write to receive the generator’s output; a Grafana 10.4+ instance where you can add data sources; and an OpenTelemetry Collector (or apps already emitting OTLP) as the trace source. CLI tooling: aws v2, helm, kubectl, and jq. You should be comfortable reading Prometheus metric names and writing basic PromQL, since half the value of Tempo lands in Prometheus.
Where this sits: it is the trace pillar of a self-hosted observability stack. The metrics pillar is Prometheus/Mimir (or VictoriaMetrics for high-cardinality metrics at scale); the logs pillar is Loki in distributed mode on S3 — and Tempo, Loki, and Mimir are deliberately architecturally identical (distributor → ingester → compactor → querier → query-frontend on object storage), so operating one teaches you the others. Traces enter this system from the OpenTelemetry Operator with the target allocator and auto-instrumentation, which is upstream of everything here. The metrics Tempo generates feed the same alerting and on-call flow as the rest of the stack — Grafana OnCall for rotation management and PagerDuty event orchestration off Alertmanager — and the same GitOps controller, Argo CD with SSO and RBAC, reconciles this Helm release from Git.
A quick map of who owns which layer during an incident, so you page the right person:
| Layer | What lives here | Who usually owns it | Failure classes it causes |
|---|---|---|---|
| App / SDK | OTLP export, span attributes, sampling head | App / dev team | Missing spans, broken parent-child, wrong service.name |
| OTel Collector | Batching, tail sampling, PII scrubbing, routing | Platform / SRE | Dropped traces, sampling-away the useful ones, backpressure |
| Distributor | Ingest, validate, shard by trace ID | Platform (Tempo) | 429 rate-limit, malformed-span rejects |
| Ingester / generator | Block build + flush; metric derivation | Platform (Tempo) | Lost recent traces, empty RED metrics, OOM |
| S3 backend | Durable block storage | Platform + cloud | AccessDenied, block-not-found, compaction stall |
| Query path | TraceQL search + assembly | Platform (Tempo) | Slow/timed-out search, empty TraceQL metrics |
| Grafana | Data source wiring, exemplars, links | Platform | Broken trace→metric jumps, no service graph |
Core concepts
Six mental models make every later decision obvious.
Tempo indexes trace ID, not attributes — that is the whole cost story. A traditional trace store builds a searchable index over span attributes so service = checkout AND status = error is a fast index lookup; that index is what costs money to store and RAM to serve. Tempo builds no such index. It stores trace bodies as columnar Parquet blocks keyed by trace ID and answers attribute searches by scanning the relevant columns of the relevant blocks, pruning which blocks to touch via lightweight block-level metadata. Scan is slower per query than an index hit but is parallelised across queriers and served straight from object storage, so it stays fast enough while the storage bill collapses to object-storage prices. Every trade-off in Tempo descends from this: cheap storage, cheap “get trace by ID,” and a search path that scales by throwing queriers and read bandwidth at a scan.
Distributed mode is a set of microservices bound by hash rings, not one process. The single-binary tempo chart runs everything in one pod — fine for a demo, useless at scale. The tempo-distributed chart runs each component as its own deployment/statefulset. The stateful ones — ingesters and the metrics-generator — coordinate through a hash ring (a consistent-hashing membership structure, backed by memberlist/gossip by default) so the distributor knows which ingesters own a given trace ID and so ownership rebalances when a replica joins or leaves. An ingester that is UNHEALTHY in the ring is not just down — it black-holes the spans hashed to it until it is forgotten or replaced. Reading the ring is therefore the first health check of the whole system.
The write path and the read path are fully decoupled. Spans flow write-side: distributor → ingester → S3 (with the generator tapping the same stream). Queries flow read-side: query-frontend → queriers → (ingesters for recent, S3 for older). These share nothing but the S3 backend and the ingesters’ recent-data window, which is the point — a query storm cannot starve ingestion, and an ingest spike cannot slow search, because they scale on independent signals. When someone says “Tempo is slow,” the first fork is write or read, because they are different subsystems with different bottlenecks.
The metrics-generator turns traces into metrics — it is a second output, not the storage path. The generator receives the same spans the distributor sees and, instead of storing them, computes aggregates: span-metrics (call counts, error counts, latency histograms per service/operation — the RED metrics) and service-graphs (edges between services with request/error/duration per edge). It remote_writes these as Prometheus series. This is how you keep your dashboards after leaving an APM: the dashboards are PromQL over generator output, not queries against traces. Critically, the generator also needs the local-blocks processor if you want TraceQL metrics — rate()/quantile_over_time() computed inside Tempo over raw spans — because those aggregate live spans the generator has buffered, not the Prometheus series.
Retention is owned by the compactor’s block_retention, not by S3. Tempo blocks are immutable objects in S3. The compactor does two jobs: it merges many small blocks into fewer large ones (so search touches fewer objects and LIST costs stay low), and it deletes blocks older than block_retention. If you instead expire objects with an S3 lifecycle rule, you will delete blocks Tempo still believes exist and get “block not found” errors on search. Set block_retention to your real query window and set the S3 lifecycle rule (as a safety net only) a few days longer, so the compactor always owns deletion.
Sampling is upstream and it is where the real cost lever lives. Tempo stores what it receives; it does not sample. Head sampling (decide at the root span, in the SDK) is cheap but blind — it drops traces before it knows if they errored. Tail sampling (buffer the whole trace at the collector, then decide) sees the finished trace and can keep 100% of errors and slow traces while dropping boring fast-200s. Tail sampling at the collector is the single biggest cost lever in this entire build: it cuts ingest and storage by ~10× while keeping every trace an engineer would actually pull. Tempo’s job is to store the survivors cheaply; the collector’s job is to choose the survivors well.
The vocabulary in one table
Before the deep sections, pin down every moving part. The glossary at the end repeats these for lookup; this table is the mental model side by side:
| Concept | One-line definition | Where it lives | Why it matters |
|---|---|---|---|
| Distributed mode | Each component is its own scalable deployment | tempo-distributed Helm chart |
Independent scaling of ingest vs query |
| Hash ring | Consistent-hash membership of stateful components | Ingesters, metrics-generator | Ownership + rebalance; UNHEALTHY = data loss |
| Block (vParquet) | Immutable columnar Parquet file of traces | S3 | The storage + search unit; scan target |
| WAL | Write-ahead log before a block is flushed | Ingester / generator local disk | Crash recovery for un-flushed spans |
| TraceQL | Query language for traces (+ metrics) | Query path | One-line filters and span aggregates |
| Metrics-generator | Derives RED + service-graph metrics from spans | Its own deployment | Keeps your dashboards after leaving APM |
| Span-metrics | Per-service RED series (traces_spanmetrics_*) |
Prometheus (via remote_write) | Rate/errors/duration dashboards |
| Service-graph | Per-edge request/error/duration series | Prometheus | The auto-drawn service map |
| local-blocks | Generator processor buffering raw spans | Generator | Required for TraceQL metrics queries |
| Exemplar | A trace ID stamped on a metric sample | Prometheus + Grafana | Jump from a metric spike to a trace |
| Compaction | Merging small blocks into large ones | Compactor | Fewer objects, cheaper LIST, faster search |
block_retention |
How long blocks stay before deletion | Compactor config | Owns deletion — not an S3 lifecycle rule |
| Multitenancy | X-Scope-OrgID isolates data + limits per tenant |
All components | One cluster, many teams, per-tenant quotas |
| Tail sampling | Decide per-trace after it completes | OTel Collector | The ~10× cost lever; keeps errors/slow |
The Tempo microservices, component by component
Distributed mode exists so each tier scales on its own signal and fails in isolation. Enumerate them.
Distributor — the ingest front door
The distributor is stateless and CPU-bound. It terminates the receiver protocols (OTLP/gRPC on 4317, OTLP/HTTP on 4318, plus legacy Jaeger and Zipkin if enabled), validates each span against the tenant’s limits, and shards spans to ingesters by trace ID so that every span of a trace lands on the same replica set (default replication factor 3). It holds nothing durably: if a distributor dies mid-flight, in-flight spans on that pod are lost, which is why you run several and let the collector retry. Its defining failure is the 429 — when a tenant exceeds ingestion_rate_limit_bytes, the distributor rejects spans with a rate-limit error, and the fix is to raise the limit or fix a client sending too much.
Distributor knobs that matter and how to reason about them:
| Setting | What it does | Default | When to change | Gotcha |
|---|---|---|---|---|
distributor.receivers.otlp |
Enable OTLP gRPC/HTTP receivers | on (chart) | Almost always keep on | Disabling both = no ingest |
ingestion_rate_limit_bytes (override) |
Per-tenant bytes/sec accepted | ~15 MB/s | Raise before real load bites | Enforced per distributor × replicas |
ingestion_burst_size_bytes (override) |
Burst allowance above the rate | ~20 MB/s | Bursty traffic (batch flushes) | Too low → 429 on spikes |
max_bytes_per_trace (override) |
Cap a single trace’s size | ~5 MB | Raise for wide fan-out traces | A runaway trace is dropped, not truncated silently |
log_received_spans |
Debug-log every received span | off | Never in prod | Floods logs; huge cost |
replicas |
Distributor pod count | 3 (this guide) | Scale on span-rate CPU | Stateless — scale freely |
The metric to watch is tempo_distributor_spans_received_total (throughput) against distributor CPU; when spans-received outpaces CPU headroom, add replicas. tempo_discarded_spans_total with its reason label tells you why spans are being dropped (rate-limited, too-large, out-of-order) — a non-zero rate here is your first ingest alarm.
Ingester — batch spans into blocks, flush to S3
The ingester is stateful and the most delicate component. It accumulates spans in memory (backed by a WAL on local disk for crash recovery), assembles them into blocks, and when a block is complete (by age or size) it flushes the block to S3 and cuts a new one. A trace is queryable from the ingester the moment its spans arrive (the “recent data” window) and remains so until the block is flushed and the ingester’s local copy is dropped, after which it is served from S3. Because ingesters own trace-ID ranges via the ring, scaling them is deliberate: adding a replica triggers a ring rebalance and the new member must warm up; removing one must flush its blocks first (a graceful shutdown) or you lose un-flushed recent data.
Ingester lifecycle knobs:
| Setting | What it does | Default | Trade-off |
|---|---|---|---|
max_block_duration |
Max age before a block is cut and flushed | ~30 min | Shorter = fresher in S3, more small blocks; longer = fewer, larger blocks, more RAM held |
max_block_bytes |
Max block size before cutting | ~500 MB | Larger blocks = better compression + fewer objects; more RAM per block |
complete_block_timeout |
How long a flushed block stays queryable locally | ~15 min | Covers the window before S3 is authoritative |
flush_check_period |
How often the ingester checks for flushable blocks | ~10 s | Rarely changed |
persistence.size (PVC) |
WAL + local block disk | 20 Gi (this guide) | Undersize → WAL fills, ingest stalls |
replicas / RF |
Ingester count and replication factor | 3 / 3 | RF 3 needs ≥3 ingesters; fewer = data-loss risk |
The trap: ingesters hold recent data in RAM, so an ingestion spike (or a max_block_duration set too long) drives memory up and can OOM the pod, which drops its un-flushed spans and forces a ring rebalance mid-incident. Give ingesters memory headroom, watch tempo_ingester_bytes_metric_total/live-trace counts, and never scale them down without a graceful drain.
Metrics-generator — RED metrics and service graphs from spans
The metrics-generator is the component that makes Tempo more than a trace lookup. It subscribes to the same span stream and runs processors that each emit a family of Prometheus series:
span-metrics— for every span it sees, incrementstraces_spanmetrics_calls_total(labelled by service, span name, status) and observestraces_spanmetrics_latency_bucket(a latency histogram). These are the RED metrics: rate from the call counter, errors from the error-status counter, duration from the histogram.service-graphs— pairs client and server spans of the same request to infer an edge between two services, emittingtraces_service_graph_request_total,_request_failed_total, and a latency histogram per edge. This is what draws the service map.local-blocks— buffers recent raw spans in the generator so TraceQL metrics queries (rate,quantile_over_time,count_over_time) can be computed inside Tempo. Without it you get the Prometheus series but not in-Tempo span aggregation, and TraceQL metrics queries silently return nothing.
It remote_writes to Prometheus and, when told, stamps exemplars (a trace ID on a metric sample) so a graph links to a trace. It is the priciest component to run because it processes every span, and it holds a local WAL, so it is stateful and the most likely to OOM under a surge — give it the most memory headroom of any component.
Generator processors and what each costs you:
| Processor | Emits | Enables | Cost profile | Turn on when |
|---|---|---|---|---|
span-metrics |
traces_spanmetrics_* (RED) |
Rate/error/duration dashboards | Moderate; series cardinality grows with span-name × service | Always — this replaces the APM dashboards |
service-graphs |
traces_service_graph_* (edges) |
The service map / node graph | Higher; must pair client+server spans (memory) | You want the auto-drawn topology |
local-blocks |
(buffers raw spans) | TraceQL rate/quantile_over_time |
Memory to hold recent spans | You want in-Tempo span aggregation |
Cardinality is the generator’s danger. span-metrics labels series by span name and service; if apps put high-cardinality values in span names (a raw URL with an ID in it, say) the series count explodes and Prometheus pays the price. Use the collector to normalise span names before they reach the generator, and cap metrics_generator.processor.span_metrics.dimensions to the labels you actually chart.
Compactor — merge blocks, enforce retention
The compactor is a background worker that fights entropy in S3. Ingesters produce many small blocks (one per ingester per max_block_duration); left alone, search would have to open thousands of objects and LIST costs would climb. The compactor leases blocks (so multiple compactors do not fight over the same ones — but you must shard leasing or run a single compactor per tenant shard) and merges small blocks into larger ones, improving compression and cutting object count. It also enforces block_retention: blocks older than the window are deleted here, which is why retention is a compactor setting and not an S3 lifecycle rule. Run one un-sharded compactor per tenant shard; multiple un-sharded compactors race over the same blocks and waste work.
Compactor knobs:
| Setting | What it does | Default | Guidance |
|---|---|---|---|
compaction.block_retention |
Delete blocks older than this | ~336h (14d) | Set to your real query window; owns deletion |
compaction.compacted_block_retention |
Keep the source block briefly after compaction | ~1h | Safety window; rarely changed |
compaction.compaction_window |
Time bucket compacted together | ~1h | Larger = bigger merged blocks |
compaction.max_compaction_objects |
Max objects merged per pass | large | Bound memory of a compaction pass |
compaction.max_block_bytes |
Cap the size of a compacted block | ~100 GB | Prevents unwieldy mega-blocks |
replicas |
Compactor count | 1 (per shard) | More only with sharding configured |
Watch tempo_compactor_blocks_total (should rise as work is done) and the outstanding-blocks / compaction-backlog metrics; a growing backlog with a flat blocks_total means the compactor is under-provisioned or wedged, and search will slow as small blocks pile up.
Query-frontend and querier — the read path
The query-frontend is the read-side scheduler. A TraceQL search over a wide time range is not one operation — the frontend shards it into sub-jobs (by block, by time slice), puts them on an in-memory queue, and hands them to queriers that pull work. It also caches results and enforces per-query limits. The querier does the actual work: for each sub-job it searches the ingesters (recent, un-flushed data) and/or S3 blocks (older data), scans the relevant Parquet columns, and returns partial matches the frontend assembles. Both are stateless, so they scale freely — but the querier’s real ceiling is S3 read throughput and concurrency, not CPU, because a big search is bytes-from-object-storage-bound.
Read-path knobs:
| Setting | Component | What it does | Default | When to change |
|---|---|---|---|---|
max_outstanding_per_tenant |
query-frontend | Queue depth per tenant | ~2000 | Raise for heavy concurrent search |
query_frontend.max_retries |
query-frontend | Retry failed sub-jobs | ~2 | Flaky S3 / transient errors |
querier.max_concurrent_queries |
querier | Parallel sub-jobs per querier | ~20 | Raise to use more S3 bandwidth |
querier.frontend_worker.parallelism |
querier | Worker connections to the frontend | tuned | Match to querier count |
search.max_duration (override) |
frontend | Longest searchable time span | ~0 (unbounded) | Cap to protect the cluster |
search.max_bytes_per_trace (override) |
frontend | Cap trace size on read | matches ingest | Guard against giant traces |
replicas |
both | Pod counts | 2 frontend / 3 querier | Scale querier on search latency |
The signal for the frontend is queue length (tempo_query_frontend_queue_length); a persistently deep queue means the queriers cannot keep up — add queriers. The signal for queriers is search latency and S3 read metrics; if latency is high but querier CPU is idle, you are S3-read-bound and the fix is more queriers (more parallel readers) and/or block/results caching, not bigger querier pods.
S3 as the block backend, and the block format
Tempo’s durability is entirely in S3; the ingesters and generator hold only transient recent data. Getting the backend right is therefore load-bearing.
What the S3 identity actually needs
Tempo needs read, write, list, and delete on the bucket — delete is not optional, because the compactor removes superseded and expired blocks; a policy missing s3:DeleteObject produces a compactor that can never clean up, and S3 object count and cost climb until search degrades. Create the bucket with versioning off (Tempo manages its own immutable block lifecycle; versioning just doubles storage and confuses deletion) and put a lifecycle rule in only as a safety net set longer than block_retention.
export AWS_REGION=ap-south-1
export TEMPO_BUCKET=kloudvin-tempo-traces-prod

aws s3api create-bucket \
  --bucket "$TEMPO_BUCKET" \
  --region "$AWS_REGION" \
  --create-bucket-configuration LocationConstraint="$AWS_REGION"

# Block all public access — traces contain request internals.
aws s3api put-public-access-block \
  --bucket "$TEMPO_BUCKET" \
  --public-access-block-configuration \
    BlockPublicAcls=true,IgnorePublicAcls=true,BlockPublicPolicy=true,RestrictPublicBuckets=true

# Default SSE-KMS encryption at rest, with a bucket key to cut KMS request cost.
aws s3api put-bucket-encryption \
  --bucket "$TEMPO_BUCKET" \
  --server-side-encryption-configuration '{
    "Rules":[{"ApplyServerSideEncryptionByDefault":{"SSEAlgorithm":"aws:kms"},"BucketKeyEnabled":true}]
  }'
The minimal IAM policy Tempo needs on that bucket:
{
  "Version": "2012-10-17",
  "Statement": [
    {
      "Sid": "TempoBucketList",
      "Effect": "Allow",
      "Action": ["s3:ListBucket", "s3:GetBucketLocation"],
      "Resource": "arn:aws:s3:::kloudvin-tempo-traces-prod"
    },
    {
      "Sid": "TempoObjectRW",
      "Effect": "Allow",
      "Action": ["s3:GetObject", "s3:PutObject", "s3:DeleteObject"],
      "Resource": "arn:aws:s3:::kloudvin-tempo-traces-prod/*"
    }
  ]
}
Create an IRSA role so Tempo pods assume this without any static keys — static AWS keys in a values file are exactly the leak we refuse to repeat:
eksctl create iamserviceaccount \
  --cluster kloudvin-prod \
  --namespace tracing \
  --name tempo \
  --attach-policy-arn arn:aws:iam::123456789012:policy/TempoS3Access \
  --role-name kloudvin-tempo-irsa \
  --approve
For non-AWS clusters or where you centralize secrets, HashiCorp Vault is the alternative: enable Vault’s AWS secrets engine and have the Vault Agent sidecar inject a short-lived, dynamically-leased S3 credential into the pod, so Tempo never holds a long-lived key. The pattern is the same as the External Secrets Operator with Vault and AWS Secrets flow you likely already run. We use IRSA below because it removes the credential entirely.
The S3-compatibility matrix — Tempo speaks the S3 API, so many backends work, but the knobs differ:
| Backend | endpoint example |
forcePathStyle |
Delete support | Notes |
|---|---|---|---|---|
| AWS S3 | s3.ap-south-1.amazonaws.com |
false | yes | IRSA for credential-free auth |
| MinIO (self-host) | minio.storage.svc:9000 |
true | yes | Set insecure if HTTP in-cluster |
| GCS (S3 API) | storage.googleapis.com |
false | yes | HMAC keys, or prefer native GCS backend |
| Cloudflare R2 | <acct>.r2.cloudflarestorage.com |
true | yes | No egress fees; check request-rate limits |
| Ceph RGW / on-prem | rgw.internal:7480 |
true | yes | Validate multipart + delete behaviour |
The block format: vParquet and why columnar matters
Tempo has evolved its on-disk block format; the modern format is vParquet (currently vParquet4), where each block is an Apache Parquet file — a columnar layout in which all values of one field (all durations, all service.names) are stored contiguously. Columnar is what makes scan-based search viable: a TraceQL filter on duration > 2s reads only the duration column of the candidate blocks, not the whole trace body, so the scan touches a fraction of the bytes and compresses far better (like values sit together). Older formats (v2, earlier vParquet versions) exist mainly for migration; new clusters should use the latest vParquet the version supports, and Tempo can read older blocks while writing new ones so upgrades are non-disruptive.
Block-format choices at a glance:
| Format | Layout | TraceQL search | Compression | Use it for |
|---|---|---|---|---|
| v2 | Row-oriented (legacy) | Limited / slow | Lower | Legacy blocks only; do not choose new |
| vParquet2/3 | Columnar Parquet (older) | Yes | Good | Existing clusters mid-migration |
| vParquet4 | Columnar Parquet (current) | Yes, richest (dedicated columns, better pruning) | Best | New clusters — the default choice |
The practical rule: pick vParquet4 for a new build, let the compactor rewrite older blocks forward over time, and never expire blocks with an S3 lifecycle rule that could delete a format Tempo still references. The columnar layout is also why caching helps so much on the read path — a block’s column chunks are cacheable, so a hot time range that many queries scan can be served from a memcached/Redis block cache instead of re-reading S3 every time.
TraceQL — the query language, in depth
TraceQL is what makes Tempo usable by humans and dashboards rather than only by “give me trace ID X.” It has two halves: structural trace search (find traces/spans matching conditions) and metrics (aggregate over the matched spans). Learn both.
Structural search: selecting spans and scoping conditions
A TraceQL query is a set of span-set filters in { }. Inside the braces you match intrinsics (properties every span has: name, duration, status, kind) and attributes namespaced by scope: resource. (from the resource, e.g. resource.service.name) and span. (span attributes, e.g. span.http.status_code). Conditions combine with && (both true on the same span) and ||. The subtlety is scope: && inside one { } means one span satisfies both conditions; to relate different spans in the same trace you chain span-sets.
The queries that motivate the whole project:
# Every checkout span slower than 2s that errored — one span, three conditions.
{ resource.service.name = "checkout" && duration > 2s && status = error }
# Traces where the frontend called checkout AND checkout hit a slow DB span —
# two different spans in the same trace, related with the descendant operator.
{ resource.service.name = "frontend" } >> { resource.service.name = "checkout" && name = "db.query" && duration > 500ms }
# Filter by a custom span attribute (e.g. a tenant or a feature flag).
{ span.http.route = "/api/checkout" && span.app.tenant = "acme" && status = error }
The core TraceQL selectors you use daily:
| Selector | Matches | Example |
|---|---|---|
name (intrinsic) |
Span/operation name | { name = "HTTP POST /checkout" } |
duration (intrinsic) |
Span duration | { duration > 2s } |
status (intrinsic) |
Span status | { status = error } (also ok, unset) |
kind (intrinsic) |
Span kind | { kind = server } |
resource.<key> |
Resource attribute | { resource.service.name = "checkout" } |
span.<key> |
Span attribute | { span.http.status_code = 500 } |
&& / || |
Both / either on the same span | { status = error && duration > 1s } |
{A} >> {B} |
B is a descendant of A (any depth) | ancestor→descendant relation |
{A} > {B} |
B is a direct child of A | parent→child relation |
| select(...) |
Return specific attributes on results | | select(span.http.url) |
TraceQL metrics: aggregating over raw spans
The second half of TraceQL computes metrics from the matched spans inside Tempo — this is what needs the local-blocks processor. Pipe a span-set into an aggregate:
# p95 latency of the checkout service's DB calls, from raw spans.
{ resource.service.name = "checkout" && name = "db.query" } | quantile_over_time(duration, .95)
# Request rate of errored checkout spans, by HTTP route.
{ resource.service.name = "checkout" && status = error } | rate() by (span.http.route)
# Count of slow spans over a window, grouped by service.
{ duration > 1s } | count_over_time() by (resource.service.name)
TraceQL metrics functions and what they compute:
| Function | Computes | Typical use |
|---|---|---|
rate() |
Per-second rate of matching spans | Ad-hoc error/throughput rate without pre-building a metric |
count_over_time() |
Count of matching spans per step | “How many slow spans in the last hour?” |
quantile_over_time(attr, q) |
Quantile of an attribute (usually duration) |
p50/p95/p99 latency straight from spans |
histogram_over_time(attr) |
Histogram of an attribute over time | Latency distribution shape |
... by (labels) |
Group the aggregate by attributes | Per-route, per-service breakdowns |
The distinction that trips people up: generator span-metrics live in Prometheus and are always-on, pre-aggregated, and cheap to query for dashboards; TraceQL metrics are computed on demand inside Tempo over recent buffered spans and are for exploration, bounded by how much the local-blocks processor retains. Use generator metrics for standing dashboards and alerts; use TraceQL metrics to slice a question no pre-built metric answers — “p99 of only the spans with span.app.tenant = acme,” which no fixed Prometheus series carries.
Where each answer lives — the routing table:
| Question | Answer from | Why |
|---|---|---|
| “Show me the trace behind this spike” | TraceQL search ({ ... }) + exemplar |
Structural search returns the trace |
| “Rate/errors/p95 per service for a dashboard” | Prometheus (traces_spanmetrics_*) |
Pre-aggregated, cheap, always-on |
| “The service map” | Prometheus (traces_service_graph_*) |
Edge metrics from service-graphs |
| “p99 of spans filtered by a rare attribute” | TraceQL metrics (| quantile_over_time) |
No fixed Prometheus series carries it |
| “Every error span on service X right now” | TraceQL search | Ad-hoc structural filter |
Correlation: trace-to-metrics, trace-to-logs, and exemplars
The reason to co-locate Tempo with Prometheus and Loki is correlation — the ability to pivot from a metric to a trace to a log without changing tools. Three wires make it work, and all three are configured on Grafana’s Tempo data source plus the generator.
Exemplars are the metric→trace pivot. When the generator writes a span-metric sample, it can stamp a trace ID on that sample as an exemplar (a representative data point). In Grafana, an exemplar renders as a diamond on the latency graph, and clicking it opens that trace. This requires two things: send_exemplars: true on the generator’s remote_write, and a Prometheus started with --enable-feature=exemplar-storage (exemplars are off by default). Miss either and the diamonds never appear.
Trace-to-metrics (tracesToMetrics on the data source) is the trace→metric pivot: from a span in a trace, jump to the RED metrics for its service. Trace-to-logs (tracesToLogsV2) is the trace→log pivot: from a span, jump to Loki filtered by the same trace ID or service, which is why your logs must carry the trace ID (the OTel Collector or your logging library injects it). Service map (serviceMap) points Grafana at the Prometheus holding the service-graphs series so it can draw the topology.
The correlation wires and what each buys:
| Wire | Config location | Direction | Requires | Buys you |
|---|---|---|---|---|
| Exemplars | Generator remote_write.send_exemplars + Prometheus feature flag |
Metric → trace | exemplar-storage enabled |
Click a latency spike → the trace |
| Trace-to-metrics | tracesToMetrics on data source |
Trace → metric | Prometheus with span-metrics | From a span → its service’s RED |
| Trace-to-logs | tracesToLogsV2 on data source |
Trace → logs | Trace ID in log lines + Loki | From a span → its logs |
| Service map | serviceMap on data source |
(renders) | service-graphs in Prometheus |
The auto-drawn service topology |
| Node graph | nodeGraph.enabled |
(renders) | service-graph metrics | Interactive graph view |
The data source provisioning that wires all of it:
# grafana-datasource-tempo.yaml (provisioning)
apiVersion: 1
datasources:
  - name: Tempo
    type: tempo
    access: proxy
    uid: tempo
    url: http://tempo-query-frontend.tracing.svc:3200
    jsonData:
      tracesToMetrics:
        datasourceUid: prometheus        # trace → metric
        spanStartTimeShift: '-2m'
        spanEndTimeShift: '2m'
      tracesToLogsV2:
        datasourceUid: loki              # trace → logs (by trace ID)
        spanStartTimeShift: '-2m'
        spanEndTimeShift: '2m'
        filterByTraceID: true
      serviceMap:
        datasourceUid: prometheus        # renders the service graph
      nodeGraph:
        enabled: true
      search:
        hide: false                      # enables the TraceQL search tab
Retention, compaction, and multitenancy
Three operational disciplines keep a Tempo cluster healthy and cheap over months, not just on day one.
Retention: block_retention owns deletion
Set retention where it belongs — on the compactor — and let S3 lifecycle be a backstop only:
compactor:
  config:
    compaction:
      block_retention: 720h      # 30 days queryable; the compactor deletes older blocks
Then set the S3 lifecycle rule a few days longer (say 33 days) so the compactor, not S3, is always the thing that deletes a live block. Retention is a cost-and-value dial: 30 days is generous; many teams keep 7–14 for cost, and some keep a short window for most traces and a long window for a separate low-volume “keep everything” tenant.
Retention design choices:
| Choice | Setting | Effect | When |
|---|---|---|---|
| Uniform 30-day | block_retention: 720h |
All traces 30d | Simple, generous, single tenant |
| Cost-lean 7-day | block_retention: 168h |
All traces 7d | Cost-sensitive; incidents caught fast |
| Per-tenant split | override block_retention per tenant |
Long for a “keep-all” tenant, short for the noisy one | Multitenant with mixed value |
| S3 lifecycle backstop | bucket rule > block_retention |
Deletes only if compactor fails to | Always, as a safety net (longer than block_retention) |
Compaction discipline
The compactor is a background component but not a fire-and-forget one. Run one un-sharded compactor per tenant shard; if you need more compaction throughput, enable compactor sharding (which partitions block ownership) rather than adding un-sharded replicas that race. Watch the compaction backlog: a steadily growing count of outstanding uncompacted blocks means search will slow (more objects to open) and LIST/request costs will climb, and the fix is more compaction capacity (sharded) or a larger compaction window. The block-format matters here too — the compactor rewrites merged blocks in the current vParquet version, so compaction is also how a cluster migrates its historical blocks to the newest format.
Multitenancy: one cluster, many teams
Tempo is natively multitenant via the X-Scope-OrgID header. When multitenancy is enabled, every write and read must carry the header naming the tenant; Tempo namespaces the tenant’s blocks in S3 under a per-tenant prefix and applies per-tenant overrides (ingestion limits, retention, generator processors). This is how one Tempo cluster serves every team with isolation and independent quotas, rather than running a cluster per team.
Multitenancy and per-tenant override knobs:
| Aspect | Mechanism | Notes |
|---|---|---|
| Tenant identity | X-Scope-OrgID: <tenant> header on read+write |
Injected by the collector/gateway per team |
| Enabling it | multitenancy_enabled: true (auth config) |
Once on, the header is mandatory |
| Per-tenant limits | overrides per tenant (rate, burst, max-trace) |
Different quotas per team |
| Per-tenant retention | block_retention override |
Long-keep tenant vs noisy tenant |
| Per-tenant processors | metrics_generator.processors override |
Only generate RED for teams that want it |
| Storage isolation | Per-tenant S3 prefix | Namespaced; not separate buckets |
| Single-tenant default | tenant anonymous when auth off |
Fine for one team; enable auth for many |
The gotcha: turn multitenancy on and every client must send X-Scope-OrgID or writes and reads fail — so you enable it at the same time you configure the collector (write side) and Grafana/the gateway (read side) to inject the header. For a single team, leave it off and Tempo uses the anonymous tenant.
Sampling interplay: head vs tail, and where it lives
Tempo stores what arrives; the volume that arrives is decided upstream, and getting that decision right is the single biggest cost and fidelity lever in the system. Two strategies, at two places:
Head sampling happens in the application SDK at the root span: a probabilistic decision (keep 10%) made before the trace exists, propagated to children so the whole trace is consistently kept or dropped. It is cheap (no buffering) and consistent, but blind — it cannot keep errors or slow traces preferentially because it decides before it knows the outcome. Good for cutting a firehose to a manageable base rate.
Tail sampling happens at the OTel Collector after the whole trace has arrived and been buffered for a decision window: now you can inspect the finished trace and keep 100% of traces that errored or exceeded a latency threshold while probabilistically sampling the boring rest. It costs memory (buffer every trace for the window) and requires all spans of a trace to reach the same collector instance (so you shard by trace ID with a load-balancing exporter), but it is how you beat an APM’s cost without losing the traces that matter.
The sampling matrix:
| Strategy | Where | Sees outcome? | Cost | Keeps errors/slow? | Use for |
|---|---|---|---|---|---|
| Head (probabilistic) | SDK root span | No | Negligible | No (blind) | Cutting a firehose to a base rate |
| Head (parent-based) | SDK | No | Negligible | No | Consistent keep/drop across a trace |
| Tail (status/latency) | Collector | Yes | Memory (buffer window) | Yes | The cost lever — keep what matters |
| Rate-limiting | Collector/distributor | N/A | Low | N/A | Hard cap to protect the backend |
The collector tail-sampling config that keeps every error and slow trace, samples the rest:
# otel-collector-config.yaml (Collector running in the cluster)
receivers:
  otlp:
    protocols:
      grpc: { endpoint: 0.0.0.0:4317 }

processors:
  batch: {}
  tail_sampling:
    decision_wait: 10s
    policies:
      - name: keep-errors
        type: status_code
        status_code: { status_codes: [ERROR] }
      - name: keep-slow
        type: latency
        latency: { threshold_ms: 2000 }
      - name: sample-rest
        type: probabilistic
        probabilistic: { sampling_percentage: 10 }

exporters:
  otlp/tempo:
    endpoint: tempo-distributor.tracing.svc:4317
    tls: { insecure: true }   # in-cluster; mTLS via service mesh in prod

service:
  pipelines:
    traces:
      receivers: [otlp]
      processors: [tail_sampling, batch]
      exporters: [otlp/tempo]
The interplay to remember: generator metrics should be computed on the full stream, before tail sampling drops traces, or your RED metrics undercount. Best practice is to run the metrics-generator on the un-sampled stream (or compute span-metrics at the collector) so dashboards reflect all traffic, while only the stored traces are sampled. If the generator sits behind the sampler, your rates and error counts reflect the 10% survivors, not reality — a subtle, costly mistake.
Architecture at a glance
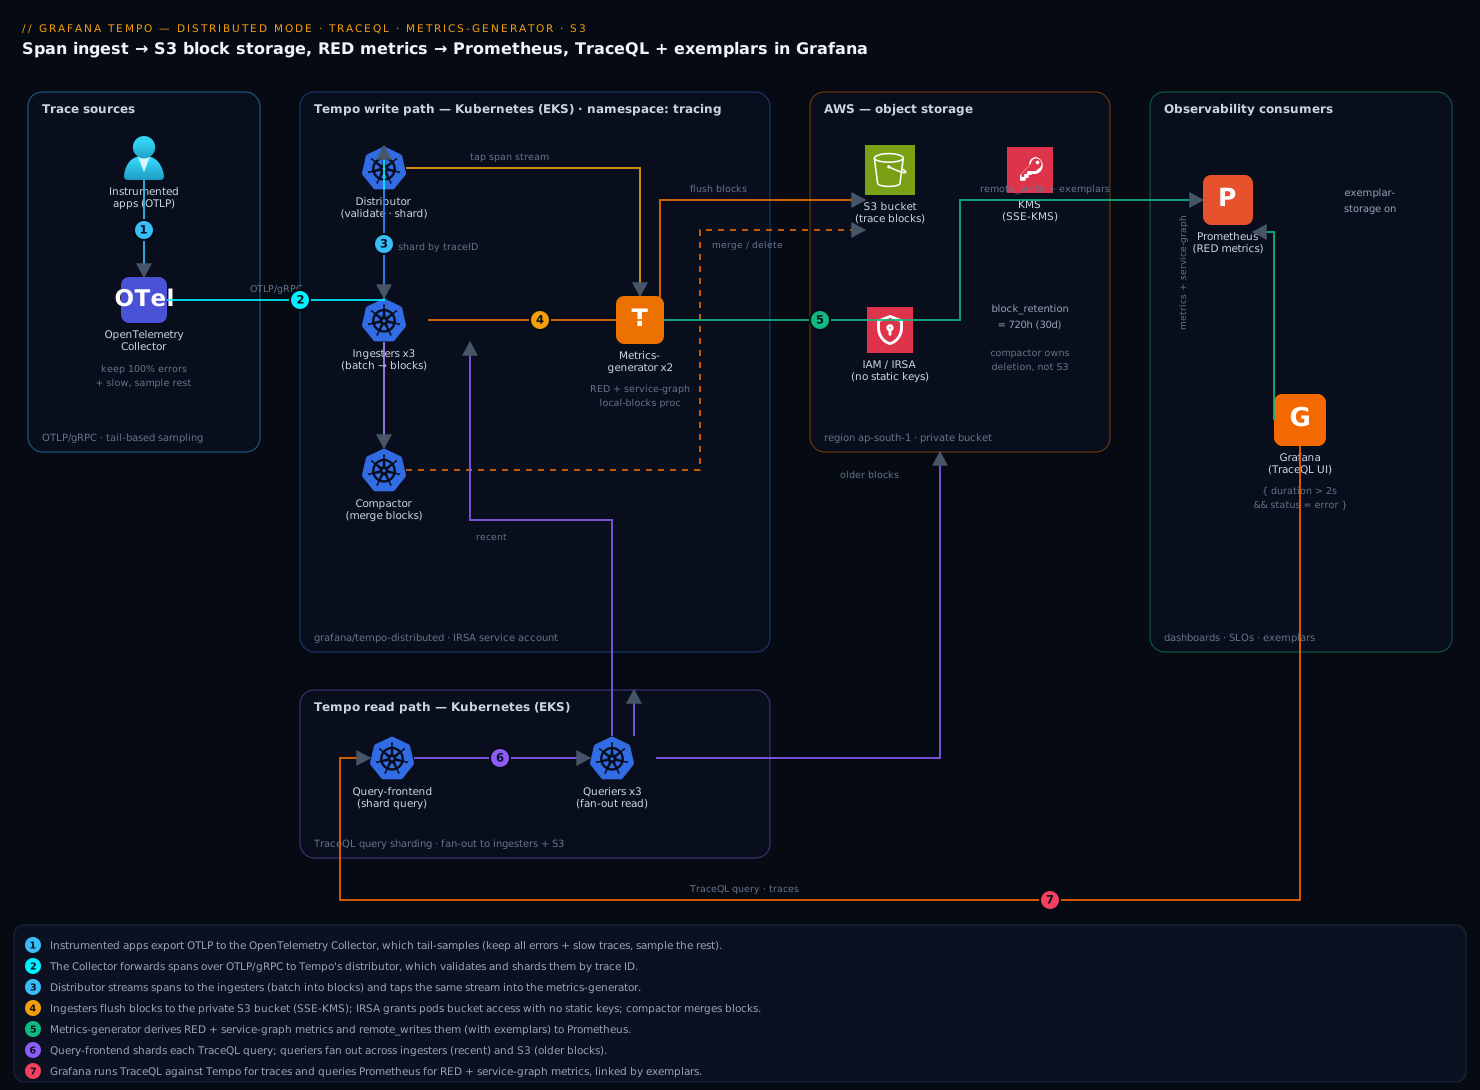
Tempo in distributed mode is a set of independently-scalable microservices, not one process, and the diagram traces both the write path and the read path so you can localise any problem to a hop. Read it left to right on the write side: spans leave the app SDKs, pass through the OpenTelemetry Collector (which batches, tail-samples, and scrubs PII), and enter Tempo at the distributor, which validates and shards them by trace ID to the ingesters. The ingesters batch spans into vParquet blocks and flush them to S3, while the metrics-generator taps the same span stream and — instead of storing traces — derives RED metrics and service-graph metrics that it remote_writes to Prometheus with exemplars. In the background the compactor merges small S3 blocks into larger ones and deletes blocks past block_retention, keeping search fast and object count sane.
Now read the read side, which shares nothing with the write side but S3 and the ingesters’ recent window: a TraceQL query enters the query-frontend, which shards it into sub-jobs and queues them; queriers pull the jobs and fan out across the ingesters (for recent data) and S3 blocks (for older data), scanning the relevant Parquet columns and returning partials the frontend assembles. Grafana sits in front of both pillars — it runs TraceQL against Tempo for traces and PromQL against Prometheus for the derived metrics, and stitches them with exemplars so a spike on a latency panel jumps straight to the trace behind it. The whole shape mirrors Loki and Mimir deliberately; learn Tempo’s rings, blocks, and compaction and you have learned all three.
Real-world scenario
Northwind Pay runs a card-processing platform on EKS in ap-south-1: about 140 microservices, ~85,000 spans/second at peak, fronted by a managed APM whose bill had reached $41,000/month and was climbing with traffic. The platform team is six engineers. The APM sampled at the head to control cost — keeping ~8% of traces — and the recurring failure mode was brutal: a checkout latency incident would spike at 02:00, the on-call would open the APM to pull the offending trace, and it would not be there, because head sampling had thrown it away before it knew it was slow. Three postmortems in a quarter ended with “trace not retained.” The mandate was to own the backend, keep everything that mattered for 30 days, and not lose the dashboards.
They built Tempo tempo-distributed on the existing cluster: distributor ×4, ingester ×4 (RF 3, 20 Gi WAL PVCs), querier ×4, query-frontend ×2, compactor ×1, metrics-generator ×3, all pointed at a new SSE-KMS S3 bucket via IRSA, with Prometheus (Mimir, actually) receiving the generator’s RED and service-graph metrics. The key decision was tail sampling at the collector: keep 100% of errors and 100% of traces over 2s, probabilistically sample the fast-200s at 10%. That cut stored trace volume by ~11× — from 85k spans/s to an effective ~7.5k spans/s reaching Tempo — while retaining every trace an engineer would ever pull. Crucially, they ran span-metric generation on the un-sampled stream so the RED dashboards still reflected all 85k spans/s of real traffic.
The first week surfaced two classic mistakes. TraceQL metrics queries (quantile_over_time) returned nothing, and the fix was adding the local-blocks processor they had omitted (span-metrics alone gives the Prometheus series but not in-Tempo aggregation). And exemplars did not link — the Prometheus/Mimir side had not been started with exemplar storage enabled, so the diamonds never rendered; enabling it closed the loop from a p95 panel to the trace. Two weeks in, the generator OOM-ed during a flash sale because span names carried raw URLs with order IDs, exploding series cardinality; they normalised span names at the collector (/checkout/{orderId} instead of the raw path) and gave the generator more memory headroom, and it held.
The outcome: 30 days of all sampled traces in S3 at roughly $900/month of object storage plus compaction compute, the RED and service-graph dashboards rebuilt in PromQL (indistinguishable from the APM’s), exemplars linking every latency spike to its trace, and TraceQL search that answered “every checkout error over 2s in the last 24h” in seconds. The APM was retired. Total observability spend fell from $41,000 to about $6,500/month all-in (Tempo compute + S3 + the Mimir/Grafana they already ran), and — the number that mattered to the platform lead — the next 02:00 checkout incident ended with the offending trace pulled in under a minute, because it had never been sampled away.
The migration as a timeline, because the order of moves is the lesson:
| Phase | Move | Effect | Watch-out |
|---|---|---|---|
| Week 0 | Stand up tempo-distributed on S3, dual-send from collector |
Traces land in both APM and Tempo | Ring health; ingester WAL sizing |
| Week 1 | Add tail sampling (errors + >2s + 10%) | Stored volume ↓ ~11× | Keep generator on un-sampled stream |
| Week 1 | Add local-blocks processor |
TraceQL metrics start working | Silent empty results without it |
| Week 1 | Enable exemplar storage on Prometheus | Metric→trace links render | Off by default |
| Week 2 | Normalise span names at collector | Generator cardinality controlled | Raw URLs explode series |
| Week 3 | Cut APM, Tempo is primary | $41k → ~$6.5k/mo | Validate 30-day retention first |
| Ongoing | Watch compaction backlog, generator memory | Stable search + metrics | Backlog growth = add compaction |
Advantages and disadvantages
The index-only-by-trace-ID design both enables the cost win and constrains how you search. Weigh it honestly:
| Advantages (why Tempo wins) | Disadvantages (where it bites) |
|---|---|
| Storage cost collapses to object-storage prices — keep everything for a long window cheaply | Attribute search is a scan, not an index hit — big searches are read-bandwidth-bound and slower than an indexed store |
| No search cluster to run (no Elasticsearch for Jaeger) — S3 is the only durable store | You must operate the microservices + rings; it is not a single binary at scale |
| Metrics-generator gives RED + service-graph for free from spans — keep your dashboards after leaving APM | Generator processes every span — priciest component, cardinality-sensitive, OOM-prone under surge |
| TraceQL is a real query language (structural + metrics), not a box of filters | TraceQL metrics need local-blocks and are bounded by what the generator buffers |
| Exemplars close the loop metric→trace; native trace→logs/metrics correlation with Loki/Prometheus | Correlation needs deliberate wiring (feature flags, trace IDs in logs) — silent when misconfigured |
| Architecturally identical to Loki/Mimir — operate one, operate all | Same operational surface as three microservice systems if you run the full stack |
| Native multitenancy + per-tenant limits — one cluster, many teams | Multitenancy makes X-Scope-OrgID mandatory everywhere the moment it is on |
Tempo is the right backend when trace volume is a real cost line, you want long retention, and you already run (or will run) Prometheus and object storage — which is most platform teams past the toy stage. It is the wrong first choice when you need rich, indexed, ad-hoc attribute search as the primary access pattern with sub-second latency over huge time ranges (an indexed store or a managed APM serves that better), or when you have neither object storage nor the appetite to operate microservices and a single-binary Jaeger with an in-memory or small backend is enough. The disadvantages are all manageable — but only if you know they exist, which is the point of this guide.
Tempo vs Jaeger — choosing the tracing backend
The most common question in a design review is “why not Jaeger?” — so answer it concretely. Both are open-source distributed tracing backends that ingest OTLP; they differ in how they store and search.
| Dimension | Grafana Tempo | Jaeger |
|---|---|---|
| Primary index | Trace ID only (scan for attributes) | Full attribute index (Elasticsearch/Cassandra/etc.) |
| Durable backend | Object storage (S3/GCS) — cheap | Elasticsearch / Cassandra / OpenSearch — a cluster to run |
| Attribute search | TraceQL scan (read-bandwidth-bound) | Fast indexed search |
| Storage cost at long retention | Very low (object-storage prices) | High (scales with index + retention) |
| Metrics from traces | Built-in metrics-generator (RED + service graph) | SPM via a metrics store; less integrated |
| Query language | TraceQL (structural + metrics) | Tag/duration filters; no aggregation language |
| Operational model | Microservices on object storage (Loki/Mimir-shaped) | Collector + query + a storage cluster |
| Grafana integration | First-class (same vendor) | Good, via the Jaeger data source |
| Best fit | Cheap long retention, keep-everything, Grafana stack | Rich indexed ad-hoc search as the main pattern |
The decision rule, as a table:
| If you need… | It points to… | Because |
|---|---|---|
| Long retention at minimal storage cost | Tempo | Object storage vs an index cluster |
| RED metrics + service map without extra tooling | Tempo | The metrics-generator is built in |
| Fast, rich, indexed ad-hoc attribute search | Jaeger (or APM) | Index beats scan for that access pattern |
| A Grafana-native stack (Loki + Mimir + traces) | Tempo | Same architecture, same vendor, correlation |
| Minimal ops on a small footprint | Jaeger single-binary | No microservices/rings to run at small scale |
Aggregate queries over spans (quantile_over_time) |
Tempo | TraceQL metrics; Jaeger has no such language |
The honest summary: choose Tempo when the constraint is storage cost at retention and you live in the Grafana/Prometheus/object-storage world (the common case that motivated this guide); choose Jaeger when the constraint is indexed search latency and richness as your primary access pattern and you are willing to run and pay for the storage cluster that provides it. They are not mutually exclusive — some teams run Tempo for cheap long-term retention and a small Jaeger or an APM sample for hot indexed search.
Hands-on lab
Stand up Tempo in distributed mode on Kubernetes with an S3 (or MinIO) backend, land traces, prove RED metrics and TraceQL both work, then break one thing on purpose and read the exact signal. This is the centerpiece — do every step. If you do not have AWS S3 handy, the lab notes where MinIO substitutes.
Step 1 — Namespace, repo, and the S3 identity.
export AWS_REGION=ap-south-1
export TEMPO_BUCKET=kloudvin-tempo-lab-$RANDOM
kubectl create namespace tracing
helm repo add grafana https://grafana.github.io/helm-charts
helm repo update

# Create the bucket (skip if using MinIO in-cluster).
aws s3api create-bucket --bucket "$TEMPO_BUCKET" --region "$AWS_REGION" \
  --create-bucket-configuration LocationConstraint="$AWS_REGION" -o json
aws s3api put-public-access-block --bucket "$TEMPO_BUCKET" \
  --public-access-block-configuration \
  BlockPublicAcls=true,IgnorePublicAcls=true,BlockPublicPolicy=true,RestrictPublicBuckets=true
Expected: the bucket is created and public access is blocked. Create the IRSA service account (eksctl create iamserviceaccount ... from the S3 section) or, for the lab, an in-cluster MinIO and a static credential secret — but never a static AWS key in a values file for anything beyond a throwaway lab.
Step 2 — Write the Helm values (S3 backend + generator + per-component replicas).
tempo-values.yaml:
# --- Storage: traces live in S3 (or MinIO), nowhere else durable ---
storage:
  trace:
    backend: s3
    s3:
      bucket: kloudvin-tempo-lab   # match $TEMPO_BUCKET
      endpoint: s3.ap-south-1.amazonaws.com
      region: ap-south-1
      # No access_key/secret_key — IRSA supplies credentials.
    block:
      version: vParquet4           # current columnar format

serviceAccount:
  create: false
  name: tempo                      # the IRSA-annotated SA from step 1

# --- Metrics-generator: derive RED + service-graph from spans ---
metricsGenerator:
  enabled: true
  config:
    storage:
      remote_write:
        - url: http://prometheus.monitoring.svc:9090/api/v1/write
          send_exemplars: true     # required for metric→trace links

# Turn processors on globally and route all tenants to the generator.
global_overrides:
  defaults:
    metrics_generator:
      processors:
        - service-graphs           # node/edge latency between services
        - span-metrics             # the RED metrics (rate, errors, duration)
        - local-blocks             # REQUIRED for TraceQL metrics over spans

# --- Component replicas (scale independently later) ---
distributor:   { replicas: 3 }
ingester:
  replicas: 3
  persistence: { enabled: true, size: 20Gi }
querier:       { replicas: 3 }
queryFrontend: { replicas: 2 }
metricsGenerator: { replicas: 2 }

# --- Compactor: 30-day retention, single replica per shard ---
compactor:
  replicas: 1
  config:
    compaction:
      block_retention: 720h        # 30 days; the compactor owns deletion
Three choices teams get wrong and this file gets right: local-blocks must be in the generator processors or TraceQL metrics queries silently return nothing; send_exemplars: true is what lets a Prometheus latency graph link back to a real trace; and block_retention on the compactor — not an S3 lifecycle rule — governs how long traces are queryable.
Step 3 — Deploy and confirm the cluster is healthy.
helm upgrade --install tempo grafana/tempo-distributed \
  --namespace tracing --values tempo-values.yaml --version 1.18.0

kubectl -n tracing rollout status deploy/tempo-distributor
kubectl -n tracing get pods -l app.kubernetes.io/name=tempo
Expected: distributor, ingester, querier, query-frontend, compactor, and metrics-generator pods all Running. Now confirm each stateful component registered ACTIVE in its hash ring — an UNHEALTHY ingester black-holes the spans hashed to it:
kubectl -n tracing port-forward svc/tempo-distributor 3200:3200 &
curl -s http://localhost:3200/ingester/ring | jq '.shards[] | {id, state}'
curl -s http://localhost:3200/metrics-generator/ring | jq '.shards[] | {id, state}'
Expected: every shard reads ACTIVE. If any is UNHEALTHY, check that pod’s logs before sending traffic.
Step 4 — Point a trace source at Tempo and generate traffic.
Apply the OTel Collector config from the sampling section (or point existing OTLP apps at tempo-distributor.tracing.svc:4317). The fastest smoke test is tracegen, which ships with Tempo and emits synthetic traces:
kubectl -n tracing run tracegen --rm -it --restart=Never \
  --image=ghcr.io/grafana/tempo/tracegen:latest -- \
  -otlp-endpoint tempo-distributor.tracing.svc:4317 \
  -otlp-insecure -duration 60s -workers 4
Expected: tracegen reports spans generated. Confirm the distributor accepted them:
curl -s http://localhost:3200/metrics | grep tempo_distributor_spans_received_total
Expected: a non-zero, rising counter.
Step 5 — Prove blocks are landing in S3 and the compactor is working.
# Blocks should appear under the tenant prefix (may take a flush cycle).
aws s3 ls "s3://$TEMPO_BUCKET/" --recursive | tail -n 10

# Compactor is doing work (count rises over time).
curl -s http://localhost:3200/metrics | grep tempo_compactor_blocks_total
Expected: objects listed in S3 (block files under a per-tenant prefix), and a non-zero tempo_compactor_blocks_total after a few minutes. If S3 is empty after 30+ minutes, jump to the troubleshooting table (almost always IAM/s3:DeleteObject or the IRSA annotation).
Step 6 — Wire Tempo into Grafana and run TraceQL.
Apply the grafana-datasource-tempo.yaml from the correlation section (or add the data source in the UI pointing at http://tempo-query-frontend.tracing.svc:3200). In Grafana Explore, select the Tempo data source and the TraceQL tab, and run a structural search:
{ duration > 100ms }
Expected: tracegen’s synthetic traces appear; click one to see the span tree. Then run a TraceQL metrics query to prove local-blocks is working:
{ } | rate() by (name)
Expected: a rate series per span name. Empty result = you forgot local-blocks (the most common lab failure).
Step 7 — Prove RED metrics reached Prometheus, and rebuild a dashboard.
kubectl -n monitoring port-forward svc/prometheus 9090:9090 &
curl -s 'http://localhost:9090/api/v1/query?query=traces_spanmetrics_calls_total' \
  | jq '.data.result | length'
Expected: a non-zero count — RED metrics are landing. Rebuild the APM’s core panels in PromQL. Request rate per service:
sum by (service) (rate(traces_spanmetrics_calls_total[5m]))
Error rate (fraction of calls with a non-OK span status):
sum by (service) (rate(traces_spanmetrics_calls_total{status_code="STATUS_CODE_ERROR"}[5m]))
/
sum by (service) (rate(traces_spanmetrics_calls_total[5m]))
p95 duration from the generator’s latency histogram:
histogram_quantile(0.95,
  sum by (service, le) (rate(traces_spanmetrics_latency_bucket[5m])))
Because the generator wrote exemplars, a spike on the p95 panel in Grafana shows a diamond; clicking it drops you into the slow trace behind it — the loop the old sampled vendor could never close (this needs Prometheus started with --enable-feature=exemplar-storage).
Step 8 — Break one thing on purpose and read the signal. Trigger a 429 by dropping the ingestion rate limit far below the offered load, then read the exact discard reason:
# Apply a tiny per-tenant rate limit, then run tracegen harder than it allows.
kubectl -n tracing patch cm tempo-overrides --type merge -p \
  '{"data":{"overrides.yaml":"overrides:\n  defaults:\n    ingestion_rate_limit_bytes: 100000\n"}}' 2>/dev/null || true
kubectl -n tracing run tracegen2 --rm -it --restart=Never \
  --image=ghcr.io/grafana/tempo/tracegen:latest -- \
  -otlp-endpoint tempo-distributor.tracing.svc:4317 -otlp-insecure -duration 30s -workers 16

curl -s http://localhost:3200/metrics | grep 'tempo_discarded_spans_total'
Expected: tempo_discarded_spans_total{reason="rate_limited"} climbs — the exact signal a 429 produces. Reverting the limit clears it. This is the muscle memory that matters: a symptom (spans not landing) has a named metric that tells you the cause.
Validation checklist. You deployed distributed Tempo on S3, confirmed rings ACTIVE, landed traces (blocks in S3, compactor working), ran TraceQL structural and metrics queries, saw RED metrics in Prometheus with working exemplars, and reproduced a rate-limit discard and read its metric. Each step proved one hop of the topology:
| Step | What you did | What it proves | Real-world analogue |
|---|---|---|---|
| 3 | Rings ACTIVE |
Stateful components joined; no black-holing | First health check every incident |
| 5 | Blocks in S3 + compactor working | Durable path + entropy control work | The storage half of the system |
| 6 | TraceQL search + | rate() |
Query path + local-blocks work |
Answering “show me the trace” |
| 7 | RED metrics + exemplars | Generator + correlation work | Rebuilding the APM dashboards |
| 8 | Reproduce a 429, read the metric | Failures have named signals | The 90-second diagnosis |
Teardown. One Helm release plus a bucket; S3 data survives an uninstall by design (re-attach a new cluster to existing traces), so delete data only when you mean it:
helm uninstall tempo -n tracing
kubectl delete namespace tracing
# Only when you genuinely want the traces gone:
aws s3 rm "s3://$TEMPO_BUCKET/" --recursive
aws s3api delete-bucket --bucket "$TEMPO_BUCKET" --region "$AWS_REGION"
Cost note. On a lab cluster this is a few pods for an hour plus a near-empty S3 bucket — well under a dollar. Delete the namespace and empty the bucket and everything stops.
Common mistakes & troubleshooting
This is the playbook you bookmark. First as a scannable table you can read at 02:14, then the reasoning for the ones that bite hardest.
| # | Symptom | Root cause | Confirm (exact cmd / path) | Fix |
|---|---|---|---|---|
| 1 | TraceQL metrics (rate/quantile_over_time) return empty |
local-blocks processor not enabled |
Generator config processors list; run {} | rate() (empty) |
Add local-blocks to metrics_generator.processors |
| 2 | Spans accepted but nothing appears in S3 | IAM missing s3:DeleteObject, or IRSA annotation didn’t attach |
kubectl -n tracing logs deploy/tempo-ingester for AccessDenied; aws s3 ls empty |
Add s3:DeleteObject; verify IRSA SA annotation |
| 3 | 429 / spans dropped under load |
Per-tenant ingestion_rate_limit_bytes too low |
tempo_discarded_spans_total{reason="rate_limited"} rising |
Raise rate + burst limits; enable collector batch |
| 4 | Service graph empty in Grafana | service-graphs off, or serviceMap points at wrong Prometheus |
Generator processors; data source serviceMap.datasourceUid |
Enable processor; fix data source UID |
| 5 | S3 object count explodes / search slows | Multiple un-sharded compactors racing, or compactor under-provisioned | Compaction backlog metric rising; tempo_compactor_blocks_total flat |
Run one compactor per shard, or enable sharded compaction |
| 6 | Exemplars don’t link metric → trace | send_exemplars: false, or Prometheus lacks exemplar storage |
Data source; Prometheus flags | Set send_exemplars: true; --enable-feature=exemplar-storage |
| 7 | Ingester OOM, recent traces lost | max_block_duration too long / RAM too low / ingest spike |
Ingester memory near limit before restart; ring rebalance | More RAM; lower max_block_duration; scale ingesters (drained) |
| 8 | Generator OOM under load | Span-name/attribute cardinality explosion | Prometheus series count for traces_spanmetrics_* huge |
Normalise span names at collector; cap dimensions; more memory |
| 9 | “block not found” on search | S3 lifecycle rule deleted a live block | Bucket lifecycle vs block_retention; querier logs |
Set lifecycle > block_retention; let compactor own deletion |
| 10 | Ingester UNHEALTHY in the ring, spans lost |
Pod crashed / not draining / clock skew | curl .../ingester/ring shows UNHEALTHY |
Restart/replace pod; graceful drain on scale-down |
| 11 | RED metrics undercount vs real traffic | Generator sits behind tail sampling | Generator on sampled stream; rates too low | Run generator on un-sampled stream (or metrics at collector) |
| 12 | Writes/reads fail after enabling multitenancy | X-Scope-OrgID header missing on client |
Distributor/querier 401/no-tenant errors | Inject X-Scope-OrgID at collector + Grafana/gateway |
| 13 | Search slow, querier CPU idle | S3 read-bandwidth-bound, too few queriers | Query latency high; querier CPU low; frontend queue deep | Add queriers; enable block/results cache |
| 14 | Query-frontend queue deep, timeouts | Queriers can’t keep up / max_outstanding too low |
tempo_query_frontend_queue_length high |
Add queriers; raise max_outstanding_per_tenant |
The expanded form for the entries that bite hardest:
1. TraceQL metrics queries return empty. Root cause: the local-blocks processor is not enabled, so the generator emits Prometheus series but does not buffer raw spans for in-Tempo aggregation. Confirm: run { } | rate() in Explore — it returns nothing while { } search returns traces. Fix: add local-blocks to metrics_generator.processors (alongside span-metrics); restart the generator. span-metrics alone gives you the dashboards but never the TraceQL rate/quantile_over_time.
2. Spans accepted but nothing lands in S3. Root cause: almost always IAM — the role is missing s3:DeleteObject (so the compactor fails and, depending on version, the write path stalls) or the IRSA annotation never attached the role to the pods. Confirm: kubectl -n tracing logs deploy/tempo-ingester | grep -i accessdenied and aws s3 ls "s3://$TEMPO_BUCKET/" empty. Fix: add s3:DeleteObject to the policy and verify the service account has the eks.amazonaws.com/role-arn annotation and that serviceAccount.name in the values matches it.
5. S3 object count explodes and search slows. Root cause: more than one un-sharded compactor, so replicas fight over the same blocks and waste work, or a single compactor that cannot keep up with block production. Confirm: the compaction-backlog metric climbs while tempo_compactor_blocks_total stays flat. Fix: run exactly one compactor per tenant shard, or enable compactor sharding to partition ownership before adding replicas.
8. Generator OOM under load. Root cause: span names or dimensions carry high-cardinality values (a raw URL with an ID), so span-metrics produces an explosion of Prometheus series and the generator’s memory blows up buffering them. Confirm: the series count for traces_spanmetrics_* is enormous; generator memory pins before the OOM. Fix: normalise span names at the collector (/checkout/{id}), cap processor.span_metrics.dimensions to the labels you actually chart, and give the generator memory headroom. This is the single most common generator failure at scale.
11. RED metrics undercount real traffic. Root cause: the metrics-generator is downstream of the tail sampler, so it only sees the ~10% of traces that were kept, and your rates/error counts reflect survivors, not reality. Confirm: generator input equals sampled output; dashboard rates are suspiciously low versus known traffic. Fix: generate span-metrics on the un-sampled stream — either run the generator on the pre-sampling path or compute span-metrics at the collector — so dashboards reflect all traffic while only stored traces are sampled.
Best practices
- Enable
local-blocksfrom day one if you want TraceQL metrics — it is the silent-failure setting; add it alongsidespan-metrics, not later. - Run the metrics-generator on the un-sampled stream so RED and service-graph metrics reflect all traffic, while tail sampling only reduces what you store.
block_retentionon the compactor owns deletion; S3 lifecycle is a backstop set longer. Never let an S3 rule delete a live block — it produces “block not found” on search.- One un-sharded compactor per tenant shard. Need more throughput? Enable compactor sharding, do not add racing replicas.
- Give ingesters and the generator memory headroom, and drain ingesters before scale-down. Both hold recent data; OOM or an ungraceful shrink loses un-flushed spans and forces a mid-incident ring rebalance.
- Normalise span names at the collector so
service.name/span-name cardinality stays bounded — the generator (and Prometheus) pay for cardinality, not you. - Tail-sample at the collector to keep 100% of errors and slow traces. It is the ~10× cost lever; head sampling is blind and drops the traces you need.
- Enable exemplar storage on Prometheus and
send_exemplars: trueso the metric→trace loop closes — the whole point of co-locating traces and metrics. - Scale on the right signal per tier: distributor on span-rate CPU, ingester on active-trace RAM, querier on search latency / S3 read, query-frontend on queue depth, generator on span-rate memory.
- Choose
vParquet4for new clusters and let the compactor migrate old blocks forward; do not pick a legacy format for a new build. - Put per-tenant limits in
overridesbefore load bites — the defaults 429 under real traffic; sizeingestion_rate_limit_bytes/burstto peak. - Deliver it all via GitOps so
tempo-values.yamlis a reviewed PR reconciled by Argo CD, and manage the S3 bucket/IAM/KMS in Terraform so storage and identity are codified too.
The alerts worth wiring before the next incident — leading indicators, not lagging “search is down”:
| Alert on | Signal | Threshold (starting point) | Why it’s leading |
|---|---|---|---|
| Discarded spans | tempo_discarded_spans_total rate |
> 0 sustained 5 min | First sign of 429 / too-large / out-of-order |
| Ingester memory | container memory % | > 85% for 10 min | Predicts OOM + recent-trace loss |
| Generator memory | container memory % | > 85% for 10 min | Predicts cardinality-driven OOM |
| Compaction backlog | outstanding uncompacted blocks | rising trend | Search will slow; LIST cost climbs |
| Query queue depth | tempo_query_frontend_queue_length |
high + rising | Queriers behind; search latency next |
| Ring health | UNHEALTHY component count | ≥ 1 for 5 min | Black-holed spans / failed reads |
| Exemplar linkage | manual/synthetic check | broken | Correlation quietly stopped working |
Security notes
Traces carry request internals — URLs, headers, sometimes IDs — so treat the pipeline as sensitive data.
- Scrub PII at the OpenTelemetry Collector before spans reach Tempo. Use the
attributes/redaction/transformprocessors to drop or hash sensitive fields, because once a span is in an immutable S3 block it is expensive to selectively delete. Redaction upstream is far cheaper than deletion downstream. - Keep the S3 bucket fully private with SSE-KMS (block-public-access on, KMS default encryption with a bucket key), and never put AWS keys in the values file — use IRSA so pods assume a role, or HashiCorp Vault’s AWS secrets engine for short-lived dynamic credentials. Static keys in a chart is the leak to never repeat.
- Grant the S3 identity least privilege — read/write/list/delete scoped to this bucket only, nothing wildcard. Delete is required for the compactor; scope it tightly rather than granting broad S3 access.
- Front Grafana with your workforce IdP (Okta or Microsoft Entra over OIDC/SAML) and map IdP groups to Grafana roles, so only authenticated engineers reach the TraceQL UI and on-call sees traces while the wider org does not.
- Enforce tenant isolation with
X-Scope-OrgIDinjected by a trusted gateway/collector, not by clients you don’t control, so a team cannot read another tenant’s traces by setting their own header. - mTLS the in-cluster hops in production — the lab uses
tls: insecurefor the collector→distributor link, but a real deployment terminates mTLS via the service mesh so span data is encrypted in transit. - Scan the Terraform that provisions the bucket/IAM/KMS in CI so a public-exposure or over-broad-policy regression is caught in the PR, the same Wiz Code IaC-and-container gate in GitHub Actions you use elsewhere. Secure and reliable pull the same direction: a private, least-privilege bucket is also the one that does not accidentally get its blocks deleted.
The security controls that also prevent incidents:
| Control | Mechanism | Secures against | Also prevents |
|---|---|---|---|
| Collector PII scrubbing | redaction/transform processors |
Sensitive data in S3 blocks | Expensive selective deletion later |
| SSE-KMS + block-public-access | Bucket encryption + BPA | Trace exfiltration | Accidental public exposure regressions |
| IRSA / Vault dynamic creds | Assumed role / leased secret | Long-lived key leak | Credentials in a values file (the leak) |
| Least-privilege S3 policy | Scoped read/write/list/delete | Cross-bucket access | Over-broad delete on other data |
| IdP in front of Grafana | OIDC/SAML + group→role | Anonymous trace access | Wrong-audience data exposure |
Trusted X-Scope-OrgID |
Header set by gateway only | Cross-tenant reads | Tenant data leakage |
Cost & sizing
The entire reason for this build is unit economics, so size it deliberately and instrument the savings.
S3 storage is the cheap part — sampling is the lever. Storing traces in S3 turns the dominant cost from per-span vendor pricing into roughly the price of object storage plus compaction compute; a terabyte of retained traces is single-digit dollars a month at rest. The biggest lever by far is tail sampling at the collector (keep errors + slow, sample the rest): it cuts stored volume by ~10× while keeping every trace that matters, so it dominates both the S3 line and the compute needed to ingest and search.
The metrics-generator is the priciest component to run because it processes every span and its cost scales with span-metric cardinality, not just volume. Right-size its replicas and memory to span rate, control span-name cardinality at the collector, and remember its output lands in Prometheus — where high cardinality costs you on the metrics side. Ingesters cost RAM (they hold recent data); queriers cost S3 read bandwidth on heavy search; the distributor and compactor are comparatively cheap.
Rough component sizing from real signals:
| Component | Scales with | Starting point (mid-size, ~50k spans/s post-sampling) | Right-size by |
|---|---|---|---|
| Distributor | Span-rate CPU | 3 replicas, ~1 vCPU each | Watch spans-received vs CPU |
| Ingester | Active-trace RAM | 3 replicas, 4–8 GiB, 20 Gi WAL | Memory headroom; block flush rate |
| Metrics-generator | Span-rate + cardinality | 2–3 replicas, most memory of any component | Series count; OOM risk |
| Compactor | S3 block backlog | 1 per shard (or sharded) | Compaction backlog trend |
| Query-frontend | Query concurrency | 2 replicas | Queue depth |
| Querier | Search bytes / S3 read | 3+ replicas | Search latency; add for read bandwidth |
| S3 | Retained bytes | Pennies/GB/month | Retention window; block size/compression |
A rough monthly picture, mid-size platform after tail sampling: Tempo compute (the pods above) on existing cluster headroom, plus S3 storage for 30 days of sampled traces (~hundreds of GB to low TB) at object-storage prices, plus the Prometheus/Mimir cost of the generated series. The dominant savings is retiring per-span APM pricing; Northwind Pay went from ~$41,000 to ~$6,500/month all-in. Watch two lines: S3 request/LIST cost (kept low by compaction merging small blocks) and Prometheus series cost from generator cardinality (kept low by normalising span names). Tune block_retention to your real query window — 30 days is generous; 7–14 is common — and let the compactor, not S3, delete.
The cost drivers and what each one buys:
| Cost driver | What you pay for | Rough scale | Lever to control it |
|---|---|---|---|
| Stored trace volume | S3 GB at rest | Pennies/GB/month | Tail sampling (~10×); retention window |
| Metrics-generator compute | CPU/RAM to process every span | Priciest Tempo component | Right-size replicas; control cardinality |
| Prometheus series (generator output) | Metric ingestion/storage | Grows with span-name cardinality | Normalise span names; cap dimensions |
| Querier / S3 read | Bytes scanned on heavy search | Per-GB read + querier CPU | Block/results cache; cap search.max_duration |
| S3 request cost | PUT/GET/LIST operations | Rises with small-object count | Compaction merges blocks → fewer LISTs |
| Ingester RAM | Recent-data buffering | Per-instance memory | Sized to active-trace volume |
Interview & exam questions
1. Why is Grafana Tempo so much cheaper to store traces than Jaeger on Elasticsearch? Tempo indexes only by trace ID and stores trace bodies as columnar Parquet blocks in object storage, so it never builds the big attribute index whose storage and RAM cost dominates an Elasticsearch-backed store. Attribute search becomes a parallelised scan of Parquet columns pruned by block metadata — slower per query than an index hit but astronomically cheaper to retain, since cost tracks object-storage prices, not index size.
2. What is the metrics-generator and what does it produce? A Tempo component that taps the span stream and derives Prometheus series instead of storing traces: span-metrics (traces_spanmetrics_* — the RED call/error counters and latency histogram) via the span-metrics processor, service-graph edge metrics via service-graphs, and buffered raw spans for TraceQL metrics via local-blocks. It remote_writes these to Prometheus, which is how you keep your dashboards after leaving an APM.
3. Why do TraceQL quantile_over_time/rate queries return nothing even though span-metrics are in Prometheus? Because those in-Tempo aggregate queries require the local-blocks processor, which buffers raw spans for computation; span-metrics alone only produces the Prometheus series. Add local-blocks to metrics_generator.processors. This is the single most common Tempo misconfiguration.
4. Head sampling vs tail sampling — where does each live and what can each do? Head sampling is in the SDK at the root span: cheap, consistent, but blind (it decides before it knows if the trace errored or was slow). Tail sampling is at the OTel Collector after the whole trace is buffered: it can keep 100% of errors and slow traces while sampling the rest, at the cost of memory and requiring all spans of a trace to reach the same collector. Tail sampling is the ~10× cost lever that keeps the traces you actually need.
5. Retention: what deletes old traces, and what is the classic mistake? The compactor’s block_retention deletes blocks older than the window — retention is a compactor setting, not an S3 lifecycle rule. The classic mistake is expiring objects with an S3 lifecycle rule, which deletes a block Tempo still references and produces “block not found” on search. Set the S3 lifecycle backstop longer than block_retention so the compactor always owns deletion.
6. Which Tempo components are stateful, and why does it matter? The ingesters and the metrics-generator — they hold recent data (WAL + in-memory blocks / buffered spans) and coordinate via a hash ring. It matters because an UNHEALTHY ring member black-holes the traces hashed to it, an OOM or ungraceful scale-down loses un-flushed recent data, and adding a replica triggers a rebalance that must warm up. You drain them before scale-down and give them memory headroom.
7. How do exemplars close the loop between metrics and traces, and what two things must be enabled? An exemplar stamps a representative trace ID onto a metric sample, so a spike on a latency panel in Grafana renders a clickable diamond that opens that exact trace. Two prerequisites: send_exemplars: true on the generator’s remote_write, and Prometheus started with --enable-feature=exemplar-storage (exemplars are off by default). Miss either and no diamonds appear.
8. Why can the metrics-generator undercount your real traffic, and how do you prevent it? If the generator sits downstream of the tail sampler it only sees the sampled survivors (say 10%), so its RED rates and error counts reflect a fraction of reality. Prevent it by generating span-metrics on the un-sampled stream — run the generator on the pre-sampling path or compute span-metrics at the collector — so dashboards reflect all traffic while only stored traces are sampled.
9. What is TraceQL and how is its metrics half different from its search half? TraceQL is Tempo’s query language: structural search finds traces/spans matching conditions in { } (intrinsics like duration/status, resource./span. attributes, &&/||, and ancestor/descendant operators), while its metrics half aggregates over matched spans (rate, count_over_time, quantile_over_time ... by (labels)). Search returns traces; metrics compute values inside Tempo over spans the local-blocks processor buffers.
10. When would you choose Jaeger over Tempo? When your primary access pattern is fast, rich, indexed ad-hoc attribute search over large time ranges and you are willing to run and pay for the storage cluster (Elasticsearch/Cassandra) that provides it, or when you want a minimal single-binary footprint at small scale. Tempo wins when the constraint is storage cost at long retention and you live in the Grafana/Prometheus/object-storage world with built-in RED metrics from traces.
11. How does compaction affect both cost and search, and how many compactors do you run? Compaction merges the many small blocks ingesters produce into fewer large ones, which cuts LIST/request cost, improves compression, and speeds search (fewer objects to open); it also enforces retention. Run one un-sharded compactor per tenant shard — multiple un-sharded compactors race over the same blocks; scale compaction by enabling sharding, not by adding racing replicas.
12. Why do the read path and write path scale independently, and what signal drives each? They share only the S3 backend and the ingesters’ recent window, so a query storm cannot starve ingestion and vice versa. Write-side: distributor on span-rate CPU, ingester on active-trace RAM. Read-side: query-frontend on queue depth, querier on search latency / S3 read bandwidth. “Tempo is slow” first forks into write or read because they are different subsystems.
These map to vendor-neutral observability and SRE competencies rather than a single cert, but the concepts appear across the Grafana Certified Observability material, CNCF/CKA-adjacent platform-ops knowledge, and any OpenTelemetry-focused assessment. A compact mapping:
| Question theme | Competency area |
|---|---|
| Index-by-trace-ID, block format, cost model | Observability architecture / storage design |
| Metrics-generator, RED, service graphs | Telemetry-to-metrics; SRE golden signals |
| TraceQL search + metrics | Query languages / trace analysis |
| Head vs tail sampling | Telemetry pipeline design (OpenTelemetry) |
| Rings, stateful scaling, compaction, retention | Distributed-systems operations |
| Exemplars, trace↔metric↔log correlation | Full-stack observability integration |
Quick check
- TraceQL search (
{ status = error }) returns traces, but{ } | rate()returns nothing. What is missing and where do you add it? - Spans are accepted (distributor counter rising) but S3 stays empty after 30 minutes. Name the single most likely cause and the log line to look for.
- True or false: to keep your RED dashboards accurate, the metrics-generator should sit after the tail sampler so it only counts the traces you store.
- What actually deletes traces older than your retention window, and what is the mistake that causes “block not found” errors on search?
- A latency graph in Grafana shows the p95 climbing but there are no clickable exemplar diamonds. Name the two things that must be enabled for exemplars to link to traces.
Answers
- The
local-blocksprocessor is missing. Add it tometrics_generator.processors(alongsidespan-metrics) and restart the generator —span-metricsalone gives the Prometheus series but not in-Temporate/quantile_over_time. - IAM — almost always the role is missing
s3:DeleteObjector the IRSA annotation didn’t attach the role to the pods. Look forAccessDeniedinkubectl -n tracing logs deploy/tempo-ingester, and verify the service account annotation and thatserviceAccount.namematches. - False. If the generator sits after the sampler it only sees the ~10% survivors and undercounts real traffic. Run it on the un-sampled stream (or compute span-metrics at the collector) so dashboards reflect all traffic while only stored traces are sampled.
- The compactor’s
block_retentiondeletes old blocks. The mistake is expiring objects with an S3 lifecycle rule (which deletes blocks Tempo still references → “block not found”); set the lifecycle backstop longer thanblock_retentionso the compactor owns deletion. send_exemplars: trueon the generator’sremote_write, and Prometheus started with--enable-feature=exemplar-storage. Exemplars are off by default; miss either and the diamonds never render.
Glossary
- Grafana Tempo — a distributed tracing backend that indexes only by trace ID and stores trace bodies as columnar Parquet blocks in object storage, trading scan-based search for very cheap retention.
- Distributed mode — the
tempo-distributeddeployment model where each component (distributor, ingester, generator, compactor, query-frontend, querier) is its own independently-scalable workload. - Distributor — stateless ingest front door; receives OTLP/Jaeger/Zipkin spans, validates them, and shards by trace ID to ingesters.
- Ingester — stateful component that batches spans into blocks (backed by a WAL) and flushes complete blocks to S3; serves recent data before it’s in object storage.
- Metrics-generator — component that derives RED and service-graph metrics from the span stream and
remote_writes them to Prometheus; needslocal-blocksfor TraceQL metrics. - Compactor — background worker that merges small S3 blocks into larger ones and enforces
block_retention(owns deletion). - Query-frontend — read-side scheduler that shards a TraceQL query into sub-jobs, queues them, and assembles results.
- Querier — stateless worker that runs sub-jobs against ingesters (recent) and S3 blocks (older), scanning Parquet columns; usually S3-read-bandwidth-bound on big searches.
- Hash ring — consistent-hash membership structure binding stateful components; an
UNHEALTHYmember black-holes the data hashed to it. - WAL (write-ahead log) — on-disk log of un-flushed spans in ingesters/generator for crash recovery.
- Block / vParquet — an immutable columnar Parquet file of traces in S3;
vParquet4is the current format and the reason scan-based attribute search is viable. - TraceQL — Tempo’s query language: structural span search (
{ ... }) plus a metrics half (rate,count_over_time,quantile_over_time). local-blocks— generator processor that buffers raw spans so TraceQL metrics can be computed inside Tempo; without it those queries return nothing.- Span-metrics — per-service RED series (
traces_spanmetrics_calls_total,traces_spanmetrics_latency_bucket) emitted by thespan-metricsprocessor. - Service-graph — per-edge request/error/duration series (
traces_service_graph_*) that draw the service map. - Exemplar — a trace ID stamped on a metric sample so a metric spike links to a representative trace.
block_retention— the compactor setting that deletes blocks older than the window; the correct owner of trace deletion (not an S3 lifecycle rule).- Compaction — merging many small blocks into fewer large ones to cut LIST cost, improve compression, and speed search.
- Multitenancy /
X-Scope-OrgID— the header that isolates a tenant’s data and applies per-tenant limits; mandatory on every read/write once multitenancy is enabled. - Head sampling — a keep/drop decision made in the SDK at the root span; cheap but blind to outcome.
- Tail sampling — a per-trace decision at the collector after the trace completes; can keep errors and slow traces preferentially — the main cost lever.
Next steps
You can now stand up, wire, and defend a distributed Tempo cluster on S3. Build outward across the stack:
- Next: Deploy the OpenTelemetry Operator with the Target Allocator and Auto-Instrumentation — the upstream that produces the spans Tempo stores, and where head sampling and instrumentation live.
- Related: Deploy Loki in Distributed Mode on S3 Chunk Storage — the logs pillar, architecturally identical to Tempo, that Tempo’s trace-to-logs correlation targets.
- Related: Configure a VictoriaMetrics Cluster for High-Cardinality Storage — a metrics backend for the generator’s output when Prometheus cardinality gets expensive.
- Related: Deploy Vector for Log Routing, Transformation & Multi-Sink — shaping and enriching telemetry (including injecting trace IDs into logs) before it lands.
- Related: Set Up Grafana OnCall for Alerting & Rotation Management — route the SLO alerts you build from Tempo’s RED metrics to the right on-call engineer.