A SaaS company runs forty-odd microservices across three EKS clusters, and its single-binary Grafana Loki has hit a wall. At 9 a.m. every weekday the ingest path falls over; queries spanning more than a day time out; and the on-call engineer cannot tell whether the payments team’s log flood is starving the checkout team’s queries because everything shares one process, one disk, and one fake tenant. Loki is the log-aggregation system that indexes only your stream labels and stores the raw log lines as compressed chunks in object storage — which is exactly what makes it cheap and exactly what makes it scale, if you run it in the right topology. The single binary is the wrong topology past a few hundred GB/day: it couples the read path to the write path, so a query storm takes down ingest, and a log flood slows every query.
This guide deploys Loki in distributed microservices mode on Kubernetes to fix that for good. You decompose the single binary into separately-scaled workloads — distributor, ingester, querier, query-frontend, query-scheduler, compactor, index-gateway, and ruler — that share nothing but an S3 bucket and a hash ring. Chunks and the TSDB index live in S3, so storage is effectively infinite and roughly an order of magnitude cheaper per GB than the EBS volumes a single binary would burn. Read and write scale independently, so a query storm never touches ingest and a flood never slows queries. And with auth_enabled: true every product team becomes a hard-isolated tenant with its own rate limits, retention, and chunk prefix — the multi-tenant log platform the single binary could never be.
By the end you will be able to author the real Helm values for every component, wire S3 with IRSA (no static keys), tune the ring and memberlist so the cluster forms cleanly, reason about replication and quorum on both the write and read paths, set per-tenant overrides without a restart, run the compactor for retention and dedup, place the three caches that make queries fast, write the LogQL you will actually run during an incident, and diagnose the dozen failure modes that bite distributed Loki in production. The hands-on lab is the spine: you stand the whole topology up, push and read logs as a tenant, prove chunks land in S3, prove the index-gateway (not the queriers) serves the index, and tear it down — without losing a byte, because compute is now separate from storage.
What problem this solves
A single-binary Loki is one process that does everything: it accepts writes, holds the in-memory chunks, serves reads, runs compaction, and evaluates alerting rules. That is wonderful for a homelab and a trap for a platform. The instant your volume or query concurrency grows, the coupling hurts: a heavy 30-day query pins CPU that ingest needs, an ingest spike delays query results, and a single OOM takes the entire logging system down — writes and reads at once. You cannot give the payments team more ingest headroom without also handing them more query capacity, because there is only one knob. And as one process with one local index and (often) local chunks, you cannot lose the node without losing data, nor scale storage without scaling compute.
What breaks without distributed mode, concretely: ingest backpressure during a deploy storm rejects logs with 429, so the very logs you need to debug the deploy are dropped; a query_range over a week times out at the gateway because one querier scans every chunk serially; the disk fills because chunks never left the node; and “multi-tenancy” is a polite fiction because every team writes to the same un-isolated stream space. Teams paper over this by scaling the binary up to an enormous instance — which masks the problem for a quarter and then fails harder, because vertical scaling has a ceiling and does nothing for the read/write coupling.
Who hits this: anyone running Loki past roughly a few hundred GB/day, anyone who needs real per-tenant isolation (rate limits, retention, RBAC), and anyone whose query patterns (long ranges, high concurrency, ad-hoc LogQL during incidents) compete with steady ingest. Distributed mode is the answer, but it is genuinely a distributed system — eight components, a hash ring, replication factor, three caches, and a runtime overrides file — and getting it wrong produces its own class of incident (split-brain rings, corrupted shared index from two compactors, queriers that ignore the index-gateway, schema dates in the past that silently break reads). This guide enumerates every one.
To frame the whole field before the deep dive, here is each component, the path it serves, whether it holds state, and the one thing that breaks it:
| Component | Path | Workload type | Stateful? | Scales with | Breaks if… |
|---|---|---|---|---|---|
| Distributor | Write | Deployment | No | Ingest rate (lines/s, MB/s) | Ring can’t see ingesters → all writes 500 |
| Ingester | Write | StatefulSet | Yes (WAL) | Active streams, ingest MB/s | No WAL/PVC → un-flushed chunks lost on restart |
| Compactor | Background | StatefulSet | Yes | Index file count, retention | >1 replica → shared index corruption |
| Querier | Read | Deployment | No | Query concurrency × range | Points at ClusterIP gateway → tail-latency cliffs |
| Query-frontend | Read | Deployment | No | Concurrent users, range length | No splitting/caching → giant unsharded scans |
| Query-scheduler | Read | Deployment | No | Number of queriers/frontends | Missing → frontend queue caps concurrency |
| Index-gateway | Read | StatefulSet | Yes (cache) | Index size (active streams) | Each querier downloads index → S3 LIST storms |
| Ruler | Read+alert | Deployment/STS | Optional | Number of recording/alert rules | No object-store rule store → rules vanish on restart |
Learning objectives
By the end of this article you can:
- Decompose Loki into its read-path, write-path, and background components and explain exactly what each one does, what it talks to, and how it scales — distributor, ingester, querier, query-frontend, query-scheduler, compactor, index-gateway, and ruler.
- Trace a log line end to end on the write path (agent → distributor → replicated ingesters → chunk + TSDB index → S3 → compactor) and a query end to end on the read path (frontend → scheduler → querier → index-gateway → S3 chunks → LogQL eval), naming the failure mode at each hop.
- Configure S3 chunk + TSDB index storage correctly: schema
v13, thetsdbstore, bucket layout, encryption, lifecycle for aborted multipart uploads, and IRSA so no static keys ever exist. - Tune the ring and memberlist so the cluster forms cleanly, choose a replication factor, and reason about write quorum and read deduplication.
- Operate real multi-tenancy:
auth_enabled, theX-Scope-OrgIDheader end to end, and a hot-reloaded runtime overrides file giving each tenant its own ingestion rate, stream cap, and retention. - Run retention and compaction with exactly one compactor, place the three caches (results, chunks, index) that make queries fast, and write the LogQL (label filters, line filters,
|=/!~, parsers, metric queries) you will use during an incident. - Size the cluster from a logs-per-day number, author production Helm values for every component, and diagnose the dozen real failure modes — split-brain ring, index corruption, port/scheme mistakes on the index-gateway client, WAL-full, schema-date errors, S3 throttling — each with the exact command to confirm and the fix.
Prerequisites & where this fits
You should already understand Kubernetes fundamentals — Deployments vs StatefulSets, headless Services, PersistentVolumeClaims, ConfigMaps, and how Helm renders a chart — and have a working kubectl context. You should be comfortable with S3 concepts (buckets, prefixes, server-side encryption, lifecycle rules) and with IAM roles. Familiarity with how Loki differs from Elasticsearch (Loki indexes labels, not the full log text) and a basic grasp of LogQL help, but this guide builds the LogQL you need. Knowing what a hash ring and a gossip protocol are is useful; the Core concepts section makes them concrete.
Concretely, this guide assumes:
- A Kubernetes cluster — EKS 1.29+ here — with at least three nodes spread across availability zones and a default
StorageClass(gp3) for the StatefulSet PVCs. helm3.14+,kubectl, and theawsCLI v2 configured against the target account.- An IAM OIDC provider associated with the cluster (
eksctl utils associate-iam-oidc-provider) so Loki pods use IRSA (IAM Roles for Service Accounts) instead of static keys. - Permission to create an S3 bucket, an IAM role/policy, and a DNS/ingress path.
- A running Grafana (or Grafana Cloud) to point at the Loki gateway as a data source, and at least one log agent — Grafana Alloy, Promtail, or the OpenTelemetry Collector — to push logs.
This sits in the observability platform track. It is the logs pillar; the metrics analog is Running Grafana Mimir: Multi-Tenant, Horizontally Scalable Prometheus Storage and the traces analog is Configure Grafana Tempo with TraceQL, Metrics-Generator, and S3 Block Storage — all three share the same microservices shape and S3 backing. Upstream of operating Loki is understanding what to send it: Deploy Vector for High-Throughput Log Routing, Transformation, and Multi-Sink Delivery shapes the log stream before it arrives. The deep companion on the query and cost side is Grafana Loki Deep Dive: LogQL, Label Cardinality, and Chunk Storage Tuning. The whole thing is one third of DevOps Observability: Logs, Metrics, Traces and SLOs.
A quick map of who confirms what during an incident, so you open the right component’s logs first:
| Layer | What lives here | Who usually owns it | Failure classes it causes |
|---|---|---|---|
| Agent (Alloy/Promtail/OTel) | Scrape, label, batch, tenant header | App / platform team | Wrong X-Scope-OrgID, label explosion, drops at source |
| Distributor | Validation, rate limit, ring forward | Platform | 429 (rate limit), 500 (ring unhealthy), label errors |
| Ingester | In-memory chunks, WAL, flush, TSDB write | Platform | WAL-full, OOM, un-flushed loss on crash |
| Object store (S3) | Chunks + TSDB index + rule store | Platform + cloud | 403 (IAM), 503 SlowDown (throttle), missing objects |
| Compactor | Merge/dedup index, enforce retention | Platform | Index corruption (>1 replica), retention not applied |
| Read path (frontend/scheduler/querier) | Split, queue, fetch, evaluate | Platform | Query timeouts, OOM on huge ranges, slow tail |
| Index-gateway | Serve TSDB index to queriers | Platform | S3 LIST storms if bypassed, stale index |
| Caches (results/chunks/index) | Memcached tiers | Platform | Cold cache = slow + expensive S3 GETs |
Core concepts
Seven mental models make every later decision obvious. Read them once; they are the spine of the whole system.
Loki indexes labels, not log text. A stream is the unique combination of labels ({app="checkout", namespace="prod", level="error"}). Loki builds a tiny index mapping each stream’s labels to the chunks holding its lines, and stores the raw lines compressed inside those chunks. Queries find streams by label (cheap, indexed), then brute-force scan the chunk contents for line filters (|= "timeout"). This is why label cardinality is the master variable: a label with thousands of values (a request_id, a churning pod name) explodes the stream count and the index. The corollary throughout: keep labels low-cardinality, push everything else into the line, let the read path scan.
The single binary is decomposed along the read and write paths. On the write path, agents push to a distributor, which validates and rate-limits per tenant, then forwards each entry — replicated across the ring — to ingesters. Ingesters accumulate entries into compressed chunks in memory and periodically flush them to S3, while writing the TSDB index that maps labels→chunks. On the read path, a query hits the query-frontend, which splits it by time and shards it; sub-queries queue (in the query-scheduler); queriers pull work, fetch the index from the index-gateway, fetch matching chunks from S3, and run the LogQL. A compactor runs in the background merging per-ingester index files into shared, deduplicated ones and enforcing retention. They share only S3 and the ring.
The ring is how stateless components find stateful ones. Loki uses a consistent-hash ring (membership shared via memberlist, a gossip protocol) so a distributor knows which ingesters own a given stream, and a querier knows which ingesters and index-gateways to ask. Each component joins the ring on startup and is marked ACTIVE, JOINING, LEAVING, or UNHEALTHY. If memberlist is misconfigured (wrong port, pods can’t reach each other), components form separate rings — split-brain — and writes fail because the distributor can’t see a quorum of ingesters. This is the single most common “the cluster won’t form” pain.
Replication factor buys durability before the flush. Chunks live only in ingester memory until they flush (up to chunk_idle_period or max_chunk_age). To survive an ingester crash in that window, the distributor writes each entry to replication_factor ingesters (default 3). A write succeeds when a quorum (floor(RF/2)+1 = 2 of 3) acknowledges; on read, queriers query the relevant ingesters and dedupe the replicated copies. RF=3 needs ≥3 ingesters; RF=1 means a single ingester restart loses its un-flushed chunks. The WAL (write-ahead log) on a durable PVC is the second durability layer: a restarted ingester replays un-flushed entries.
Chunks and the TSDB index both live in object storage. Modern Loki uses the TSDB index format (successor to boltdb-shipper) with schema v13. Both index files and chunks are objects in S3 under tenant-scoped prefixes. The index-gateway exists so queriers don’t each download the whole index from S3 — it holds the TSDB index and answers index queries over gRPC, turning thousands of querier LIST/GETs into a handful. This is the component that keeps your S3 request bill and query latency sane at scale.
Multi-tenancy is a header, enforced everywhere. With auth_enabled: true, every request must carry X-Scope-OrgID: <tenant>. Loki has no built-in user auth; it trusts that header, so a trusted proxy must inject and validate it. The tenant ID becomes the S3 prefix (<tenant>/...), the rate-limit bucket, the retention scope, and the query partition. A runtime overrides file sets per-tenant limits (ingestion rate, stream cap, retention) and hot-reloads them without restarting Loki — the mechanism that turns “one Loki” into “N isolated tenants.”
Reads are split, sharded, and cached. The query-frontend turns one big query into many small ones three ways: it splits by time (split_queries_by_interval, e.g. 15m slices of a 24h query), shards by stream (TSDB query sharding lets N queriers scan disjoint stream subsets in parallel), and caches results so an overlapping repeat is instant. Three Memcached tiers back this: the results cache (query answers), the chunks cache (fetched chunk bytes), and the index cache (index lookups). Without splitting and caching, a 7-day query is one serial scan; with them it is dozens of parallel cached scans.
The vocabulary in one table
Before the deep sections, pin down every moving part — the glossary at the end repeats these for lookup; this table is the mental model side by side:
| Concept | One-line definition | Where it lives | Why it matters |
|---|---|---|---|
| Stream | A unique label-set; the unit Loki indexes | Defined by labels at ingest | High cardinality → stream explosion |
| Chunk | Compressed block of log lines for a stream | Ingester memory → S3 | Size tuning trades S3 requests vs object count |
| TSDB index | Maps stream labels → chunks | Ingester local → S3, served by index-gateway | Wrong store/schema breaks reads |
| Ring | Consistent-hash membership of a component | Shared via memberlist (gossip) | Split-brain → writes fail |
| Memberlist | Gossip protocol carrying ring state | Port 7946 between all pods | Misconfig → separate rings |
| Replication factor | Copies of each entry across ingesters | Distributor setting (default 3) | Durability before flush; needs ≥RF ingesters |
| WAL | Write-ahead log of un-flushed entries | Ingester PVC | Survives ingester restart |
X-Scope-OrgID |
Header naming the tenant | Every request | The whole isolation boundary |
| Runtime overrides | Per-tenant limits, hot-reloaded | ConfigMap → mounted file | Per-team rate/retention without restart |
| Compactor | Merges/dedupes index, enforces retention | Exactly one StatefulSet | >1 corrupts the shared index |
| Index-gateway | Serves the TSDB index to queriers | StatefulSet, gRPC :9095 | Stops S3 LIST storms |
| Query-frontend | Splits/shards/caches queries | Read-path Deployment | No split = giant serial scans |
| Query-scheduler | Holds the sub-query queue | Read-path Deployment | Decouples queue from frontend |
Component architecture: what each piece does
Distributed mode is exactly the set of components below, each its own Kubernetes workload with its own replica count, resources, and (where stateful) PVC. The chart’s deploymentMode: Distributed renders all of them. Walk them in path order.
Write-path components
Distributor (Deployment, stateless). The write front door. It receives pushes on /loki/api/v1/push, validates each stream (label syntax, line size, timestamp ordering), enforces per-tenant rate limits and stream caps, and uses the ring to forward entries to the right ingesters — replicated replication_factor times. Being stateless, you scale it horizontally with ingest rate. A key subtlety: it returns 429 when a tenant exceeds its rate, and 500 when it cannot reach a quorum of ingesters (ring unhealthy) — two very different failures behind nearby status codes.
Ingester (StatefulSet, stateful). The heart of the write path. It holds the active in-memory chunks for the streams it owns, appends each entry, and flushes a chunk to S3 when it reaches chunk_target_size, idles for chunk_idle_period, or ages past max_chunk_age — writing the TSDB index as it goes. It is a StatefulSet because it owns a WAL on a PVC and replays it on restart so un-flushed entries survive. Drain it gracefully (flush on shutdown) and never lose more than a quorum at once.
Compactor (StatefulSet, exactly one). A background worker that periodically downloads the many small per-ingester index files from S3, merges and deduplicates them into shared index files, and applies retention (deleting index entries past each tenant’s retention_period). It also processes delete requests (GDPR-style per-line deletion). It must run as a single replica — two compactors rewriting the same shared index files corrupt the index, the most dangerous scaling mistake in the system.
Read-path components
Query-frontend (Deployment, stateless). The read front door. It splits LogQL queries by time, shards them by stream (with TSDB), pushes sub-queries onto a queue, and owns the results cache so overlapping queries return cached answers. It orchestrates, it does not execute. Scale with concurrent users and range length.
Query-scheduler (Deployment, stateless). An optional-but-recommended component that externalizes the sub-query queue out of the frontend, so frontends and queriers scale independently and the frontend never becomes the concurrency bottleneck. In distributed mode you almost always run it.
Querier (Deployment, stateless). The read workhorse. It pulls a sub-query from the queue, asks the index-gateway which chunks match, fetches those chunks from S3 (plus recent un-flushed ones from ingesters), runs the LogQL filter/parser/metric evaluation, dedupes replicated copies, and returns the partial result. Its max_concurrent caps concurrent sub-queries per querier — the knob protecting querier memory.
Index-gateway (StatefulSet, stateful cache). Holds the TSDB index locally (from S3, kept on a PVC for warm restarts) and answers index queries from queriers over gRPC on port 9095, so no querier independently scans the whole index from S3 (which would generate enormous LIST/GET volume). Queriers must reach it via the headless service with dns:/// so gRPC load-balances across all gateway pods.
Ruler (Deployment or StatefulSet). Evaluates LogQL recording and alerting rules (e.g. alert if rate({app="api"} |= "5xx" [5m]) > 10), reading definitions from an object-store rule store (an S3 prefix), and sends alerts to Alertmanager. Run ≥2 for HA; it shards rule groups across replicas via its own ring.
The gateway (NGINX) and how it routes
The chart ships a gateway (NGINX Deployment) as the single client entry point. It routes write paths (/loki/api/v1/push) to distributors and read paths (/loki/api/v1/query*, /labels, etc.) to query-frontends, forwarding X-Scope-OrgID. It is the trust boundary: terminate TLS here and front it with a proxy or mesh that injects/validates the tenant header so a tenant cannot spoof another’s.
Here is every component as a scaling-and-failure reference — keep it open when you size or debug:
| Component | Default replicas (prod start) | Scale signal | Resource pressure | PVC | Graceful-shutdown concern |
|---|---|---|---|---|---|
| Distributor | 3 | Ingest MB/s, lines/s | CPU (validation, compression handoff) | No | None (stateless) |
| Ingester | 3 (RF=3 floor) | Active streams, ingest MB/s | Memory (in-flight chunks) | Yes (WAL) | Must flush on shutdown |
| Compactor | 1 (never more) | Index file count | CPU/IO during compaction | Yes | Finish in-flight compaction |
| Query-frontend | 2 | Concurrent queries, range | CPU (planning), small mem | No | Drain in-flight |
| Query-scheduler | 2 | Number of queriers/frontends | Tiny | No | None |
| Querier | 4+ | Query concurrency × scan size | Memory (chunk scan) | No | Finish in-flight sub-queries |
| Index-gateway | 2 | Index size (stream count) | Memory + disk (index cache) | Yes (warm cache) | None critical (re-downloads) |
| Ruler | 2 | Number of rule groups | CPU (rule eval) | Optional | Finish eval cycle |
| Gateway (NGINX) | 2 | Inbound request rate | CPU | No | None |
And the ports each component listens on — you will reference these when wiring services and debugging connectivity:
| Port | Protocol | Used by | Purpose |
|---|---|---|---|
| 3100 | HTTP | All components | API + /ready, /metrics, /ring, /config |
| 9095 | gRPC | Distributor↔ingester, querier↔index-gateway, frontend↔querier | Internal RPC (writes, index, query work) |
| 7946 | TCP/UDP | All ring members | Memberlist gossip (ring state) |
| 9093 | HTTP | Ruler → Alertmanager | Alert delivery (Alertmanager side) |
| 80 (gateway) | HTTP | Clients → gateway | Public read/write entry point |
S3 chunk and TSDB index storage
The economic and operational core of distributed mode is that both the chunks and the index live in S3, and the only credentials are an IAM role assumed via IRSA. Get the schema, the bucket layout, and the access model right and the rest follows.
Schema and store: TSDB v13
Loki’s storage is governed by a schema config — a list of configs, each valid from a date. The production choice is the tsdb index store with schema v13 and object_store: s3; the deprecated boltdb-shipper still works but don’t start new clusters on it. Two rules are absolute: a new schema entry’s from date must be in the future (a past date silently breaks reads over the overlap), and you never edit a past entry — you append a new one.
schemaConfig:
  configs:
    - from: "2026-01-01"
      store: tsdb            # TSDB index (successor to boltdb-shipper)
      object_store: s3
      schema: v13
      index:
        prefix: index_       # object key prefix for index files
        period: 24h          # one index table per day
The schema/store options and when each matters:
| Field | Values | Recommended | Why / gotcha |
|---|---|---|---|
store |
tsdb, boltdb-shipper |
tsdb |
TSDB = query sharding, smaller index; boltdb-shipper is legacy |
schema |
v11, v12, v13 |
v13 |
v13 is current; required for newest TSDB features |
object_store |
s3, gcs, azure, filesystem |
s3 |
Must match storage.type |
index.period |
24h (rarely 168h) |
24h |
Daily tables keep compaction and retention granular |
index.prefix |
any string | index_ |
The S3 key prefix for index objects |
from |
a date | future date on changes | Past date silently breaks reads over the overlap |
Bucket layout and what lands where
One bucket is enough; Loki keys everything by tenant and type. With auth_enabled: true, chunks land under <tenant>/... and the index under the index_ prefix. Knowing the layout makes “did it actually flush?” a one-line aws s3 ls:
| S3 key pattern | Contents | Written by | Read by |
|---|---|---|---|
<tenant>/<fingerprint>/<chunk-id> |
Compressed chunk for a stream | Ingester (flush) | Querier |
index_<table>/<...>.tsdb.gz |
Per-day TSDB index files | Ingester + compactor | Index-gateway |
index_<table>/compactor-* |
Merged/deduped index | Compactor | Index-gateway |
<tenant>/rules/<namespace>/<group> |
Ruler rule definitions | Ruler API / GitOps | Ruler |
loki_cluster_seed.json |
Cluster identity seed | First component | All (sanity/UUID) |
IRSA: zero static keys
Provision the bucket and the IRSA role in Terraform so the bucket policy, encryption, and lifecycle are reviewable. No credentials live here — the pods assume the role.
# loki-storage.tf
resource "aws_s3_bucket" "loki" {
  bucket = "kloudvin-loki-chunks-prod-use1"
}

resource "aws_s3_bucket_server_side_encryption_configuration" "loki" {
  bucket = aws_s3_bucket.loki.id
  rule {
    apply_server_side_encryption_by_default { sse_algorithm = "aws:kms" }
    bucket_key_enabled = true   # cuts KMS request cost on high object counts
  }
}

# Abort incomplete multipart uploads left by crashed ingesters
resource "aws_s3_bucket_lifecycle_configuration" "loki" {
  bucket = aws_s3_bucket.loki.id
  rule {
    id     = "abort-mpu"
    status = "Enabled"
    abort_incomplete_multipart_upload { days_after_initiation = 3 }
  }
}

resource "aws_iam_policy" "loki_s3" {
  name   = "loki-s3-prod"
  policy = data.aws_iam_policy_document.loki_s3.json
}

data "aws_iam_policy_document" "loki_s3" {
  statement {
    actions   = ["s3:ListBucket", "s3:GetObject", "s3:PutObject", "s3:DeleteObject"]
    resources = [aws_s3_bucket.loki.arn, "${aws_s3_bucket.loki.arn}/*"]
  }
}

# IRSA role assumed by every Loki SA in the "loki" namespace
module "loki_irsa" {
  source    = "terraform-aws-modules/iam/aws//modules/iam-role-for-service-accounts-eks"
  role_name = "loki-s3-prod"
  oidc_providers = {
    main = {
      provider_arn               = var.cluster_oidc_provider_arn
      namespace_service_accounts = ["loki:loki"]
    }
  }
  role_policy_arns = { s3 = aws_iam_policy.loki_s3.arn }
}
terraform apply -target=aws_s3_bucket.loki -target=module.loki_irsa
terraform output -raw loki_irsa_role_arn
# arn:aws:iam::123456789012:role/loki-s3-prod
The IAM actions Loki needs and why each — least privilege, scoped to one bucket:
| Action | Why Loki needs it | Component |
|---|---|---|
s3:PutObject |
Flush chunks; write index; write compacted index | Ingester, compactor |
s3:GetObject |
Fetch chunks for queries; download index | Querier, index-gateway |
s3:ListBucket |
Discover index tables and chunk prefixes | Index-gateway, compactor |
s3:DeleteObject |
Retention deletes; process delete requests | Compactor |
(no s3:*) |
Never grant broad; scope to the one bucket ARN | — |
The storage block in Helm values references the bucket and region only — IRSA supplies the credentials, so there is no accessKeyId/secretAccessKey anywhere:
storage:
  type: s3
  bucketNames:
    chunks: kloudvin-loki-chunks-prod-use1
    ruler:  kloudvin-loki-chunks-prod-use1
  s3:
    region: us-east-1
    # no static keys — IRSA on the "loki" service account supplies credentials
storage_config:
  tsdb_shipper:
    active_index_directory: /var/loki/tsdb-index
    cache_location:         /var/loki/tsdb-cache
    index_gateway_client:
      # MUST be the headless svc with dns:/// so gRPC load-balances across gateways
      server_address: dns:///loki-index-gateway-headless.loki.svc.cluster.local:9095
Common object-store config mistakes and their symptoms:
| Misconfig | Symptom | Fix |
|---|---|---|
| Static keys in values instead of IRSA | Keys in Git; rotation breaks Loki; audit fail | Annotate SA with role ARN; remove keys |
| Wrong region | PermanentRedirect / 301 on every PUT |
Set s3.region to the bucket’s region |
| Bucket policy denies the role | All flushes 403; no chunks appear | Grant the four actions to the role on the bucket ARN |
| No abort-MPU lifecycle | Orphaned multipart parts inflate the bill | Add abort_incomplete_multipart_upload rule |
index_gateway_client at ClusterIP |
One gateway hammered; tail-latency cliffs | Use dns:///...headless...:9095 |
Ring, memberlist, and replication
The ring makes a pile of stateless distributors and stateful ingesters into one coordinated cluster, and it is the thing most likely to go wrong on first bring-up. Three ideas: how membership is shared (memberlist), what replication factor buys, and how reads dedupe.
Memberlist: the gossip layer
Every ring-participating component (distributor, ingester, querier, compactor, index-gateway, ruler) joins a memberlist cluster — a gossip protocol on port 7946 — over which ring state propagates. The chart wires this via a headless loki-memberlist service. Two failure modes matter: if pods cannot reach each other on 7946 (NetworkPolicy, wrong service), components form separate rings, the distributor cannot find a quorum of ingesters, and every write returns 500; and if join_members points at the wrong DNS name, new pods never join. Confirm the ring is whole by hitting any component’s /ring and counting ACTIVE members.
loki:
  common:
    ring:
      kvstore:
        store: memberlist     # gossip-based ring (no external etcd/consul needed)
  memberlist:
    join_members:
      - loki-memberlist.loki.svc.cluster.local:7946
Ring KV-store options and when to use each:
| KV store | How it works | Use when | Trade-off |
|---|---|---|---|
memberlist |
Gossip between pods (port 7946) | Default for Loki on k8s | Eventually consistent; needs pod-to-pod reachability |
consul |
External Consul cluster | Already run Consul; want central view | Extra dependency to operate |
etcd |
External etcd cluster | Strong consistency preference | Extra dependency; overkill for Loki |
inmemory |
Single-process only | Single-binary / tests | No clustering — never in distributed mode |
Ring member states and what each means during an incident:
| State | Meaning | Normal? | If stuck here |
|---|---|---|---|
ACTIVE |
Healthy, owns tokens, serving | Yes | — |
JOINING |
Coming up, claiming tokens | Briefly | Slow PVC/WAL replay; check ingester logs |
LEAVING |
Draining (flushing) before exit | Briefly | Graceful shutdown in progress — wait for flush |
UNHEALTHY |
Missed heartbeats | No | Pod crashed/unreachable; check memberlist 7946 |
PENDING |
Registered, not yet active | Briefly | Token handoff stuck; check ring KV |
Replication factor and write quorum
Because chunks are only durable once flushed to S3, the distributor replicates each entry to replication_factor ingesters (default 3) so an ingester crash before flush does not lose data. A write needs a quorum to succeed: floor(RF/2)+1. Pick RF with eyes open — RF=3 triples ingester ingest work and memory but tolerates one ingester down with no data loss; RF=1 halves cost but a single restart loses that ingester’s un-flushed chunks (mitigated only partly by the WAL replay window).
loki:
  common:
    replication_factor: 3   # needs >= 3 ingesters; quorum = 2
  ingester:
    chunk_target_size: 1572864   # ~1.5 MB compressed before flush
    chunk_idle_period: 30m       # flush a stream idle this long
    max_chunk_age: 1h            # hard cap so chunks reach S3
    wal:
      enabled: true              # replay un-flushed entries after restart
      dir: /var/loki/wal
Replication factor trade-offs:
| RF | Min ingesters | Write quorum | Tolerates | Cost (ingest/mem) | Use for |
|---|---|---|---|---|---|
| 1 | 1 | 1 | Nothing (relies on WAL) | 1× | Dev/test, cost-first non-critical |
| 2 | 2 | 2 | No loss only if both ack | 2× | Rare; awkward quorum math |
| 3 | 3 | 2 | 1 ingester down, no loss | 3× | Production default |
| 5 | 5 | 3 | 2 ingesters down | 5× | Very high durability needs |
The two durability layers and what each protects against:
| Layer | Protects against | Window | Cost |
|---|---|---|---|
| Replication factor (RF=3) | One ingester crash before flush | Until flush | 3× ingest/memory |
| WAL on PVC | Ingester pod restart (replay un-flushed) | Until flush | A PVC per ingester |
| S3 flush | Everything after flush (durable) | Permanent | S3 storage + requests |
Read-path deduplication
Because RF writes N copies, a querier asking ingesters for recent data gets the same entry up to N times; Loki dedupes on read so you see each line once. This is automatic but explains a subtlety: queriers must be able to reach a quorum of ingesters and the index-gateway; if some ingesters are unreachable, recent (un-flushed) data may be incomplete in the result even though older (S3-backed) data is fine.
Multi-tenancy and per-tenant limits
Multi-tenancy is the whole reason the SaaS company in the intro is here. It is enforced by one header and one hot-reloaded file.
auth_enabled and the tenant header
Set auth_enabled: true and Loki requires X-Scope-OrgID: <tenant> on every read and write; the tenant ID becomes the S3 prefix, the rate-limit bucket, the retention scope, and the query partition. There is no built-in user authentication — Loki trusts the header — so a trusted proxy must inject and validate it. Retrofitting tenancy onto data ingested with auth_enabled: false (everything in a single fake tenant) means re-keying chunk prefixes; set it from day one.
loki:
  auth_enabled: true   # require X-Scope-OrgID — real multi-tenancy
Global limits and per-tenant overrides
limits_config sets the global default for every tenant; the runtime overrides file sets per-tenant ceilings and is hot-reloaded (no restart). This is how payments gets 24 MB/s and 90-day retention while sandbox gets 2 MB/s and 7 days, on the same cluster.
loki:
  limits_config:
    retention_period: 744h          # 31 days default; per-tenant overrides below
    ingestion_rate_mb: 8
    ingestion_burst_size_mb: 16
    max_global_streams_per_user: 50000
    max_query_parallelism: 64
    split_queries_by_interval: 15m
    tsdb_max_query_parallelism: 128
    max_query_length: 721h           # cap a single query at ~30 days
    volume_enabled: true             # enables the /volume endpoint for usage
    reject_old_samples: true
    reject_old_samples_max_age: 168h # drop logs older than 7 days (clock-skew guard)

  # Hot-reloaded per-tenant overrides (rendered to a ConfigMap, mounted as a file)
  runtimeConfig: |
    overrides:
      payments:
        ingestion_rate_mb: 24
        ingestion_burst_size_mb: 48
        retention_period: 2160h        # 90 days for a regulated tenant
        max_global_streams_per_user: 100000
      checkout:
        ingestion_rate_mb: 12
        retention_period: 744h         # 31 days
      sandbox:
        ingestion_rate_mb: 2
        retention_period: 168h         # 7 days, cheap and disposable
The most-used limits, their defaults, and the trade-off of each:
| Limit | What it caps | Sensible default | Raise when | Lower when |
|---|---|---|---|---|
ingestion_rate_mb |
Per-tenant MB/s of logs | 8 | Tenant legitimately ingests more | Tenant is noisy/cheap |
ingestion_burst_size_mb |
Short spike allowance | 2× rate | Bursty deploys/batch jobs | Want hard smoothing |
max_global_streams_per_user |
Active streams (cardinality) | 50,000 | High legit label cardinality | Suspect a label explosion |
per_stream_rate_limit |
MB/s for a single stream | 3MB | One hot stream is legit | Protect from a runaway pod |
max_query_parallelism |
Sub-queries per query | 64 | More queriers available | Queriers OOM/overloaded |
split_queries_by_interval |
Time-slice size for splitting | 15m | Very long ranges common | Many tiny queries |
max_query_length |
Longest single query range | 721h | Compliance needs longer | Protect from 90-day scans |
retention_period |
How long to keep a tenant’s logs | 744h (31d) | Regulated tenants | Disposable/dev tenants |
reject_old_samples_max_age |
Drop logs older than this | 168h | Backfill jobs | Strict freshness |
What happens when a tenant hits each limit — so you read the symptom correctly:
| Limit exceeded | Client sees | Where logged | Operator action |
|---|---|---|---|
ingestion_rate_mb |
429 Too Many Requests |
Distributor logs/metrics | Raise override or fix noisy source |
max_global_streams_per_user |
429 “max streams” |
Distributor | Hunt the high-cardinality label |
per_stream_rate_limit |
429 for that stream |
Distributor | Find the runaway stream |
max_query_length |
400 “query too long” |
Frontend | Narrow range or raise cap |
max_query_parallelism |
Slower query (queued) | Frontend/scheduler | Add queriers or raise |
reject_old_samples_max_age |
Entry dropped silently | Distributor metric | Fix source clock / backfill window |
Pointing agents and Grafana at the right tenant
Agents push to the gateway with the tenant header. Grafana Alloy:
loki.write "default" {
  endpoint {
    url       = "http://loki-gateway.loki.svc.cluster.local/loki/api/v1/push"
    tenant_id = "checkout"     // sets X-Scope-OrgID
  }
}
In Grafana, add one Loki data source per tenant, each carrying its X-Scope-OrgID header, and gate access behind SSO so a member of checkout cannot select the payments data source. Map your IdP groups to Grafana teams and use data-source permissions for read isolation. The data source URL is the gateway; the custom header is the boundary:
# Grafana data source
#   URL:                http://loki-gateway.loki.svc.cluster.local
#   Custom HTTP Header: X-Scope-OrgID = checkout
Retention, compaction, and deletes
Retention and compaction are one job done by the single compactor. Getting them right controls both your S3 bill and your compliance posture.
Why exactly one compactor
The compactor downloads the many small per-ingester index files, merges and deduplicates them, and rewrites them in place. Two compactors rewriting the same files corrupt the shared index — the single most damaging scaling mistake in Loki. The chart defaults to one; never scale it. Compaction also keeps the index file count low, directly cutting S3 LIST cost and speeding index-gateway lookups.
loki:
  compactor:
    retention_enabled: true        # actually delete past retention (not just compact)
    delete_request_store: s3       # where per-line delete requests live
    compaction_interval: 10m       # merge often → fewer tiny files → lower LIST cost
    retention_delete_delay: 2h     # grace before a chunk is truly removed
    retention_delete_worker_count: 150
compactor:
  replicas: 1                      # EXACTLY one — never scale
  persistence:
    enabled: true
    size: 20Gi
Compaction/retention settings and their effect:
| Setting | Effect | Default-ish | Tune |
|---|---|---|---|
retention_enabled |
Whether retention deletes happen at all | false | true in prod or logs grow forever |
compaction_interval |
How often index is merged | 10m | Shorter = fewer files, more compactor CPU |
retention_period (per tenant) |
Age past which logs are deleted | 744h | Per-tenant override |
retention_delete_delay |
Grace before physical delete | 2h | Safety window before chunks vanish |
delete_request_store |
Backend for line-level deletes | s3 | Required for compliance deletes |
delete_request_cancel_period |
Window to cancel a delete request | 24h | Time to undo a mistaken delete |
Per-line deletes (compliance)
Beyond age-based retention, Loki supports delete requests that remove specific log lines matching a selector (e.g. lines containing a user ID) — the mechanism for GDPR/CCPA erasure. Submit a request to the compactor’s delete API; it queues, can be cancelled within delete_request_cancel_period, then processes.
# Submit a delete request for a tenant (compactor delete API)
curl -s -X POST -H "X-Scope-OrgID: payments" \
  "http://loki-compactor.loki.svc.cluster.local:3100/loki/api/v1/delete" \
  --data-urlencode 'query={app="checkout"} |= "user_id=42"' \
  --data-urlencode "start=$(date -d '7 days ago' +%s)" \
  --data-urlencode "end=$(date +%s)"
Caching the read path
Three Memcached tiers turn distributed Loki from “correct but slow” into “fast.” Each caches a different thing.
# In the chart, enable the three cache tiers (each a memcached StatefulSet)
chunksCache:
  enabled: true
  allocatedMemory: 8192     # MB; chunk bytes fetched from S3
resultsCache:
  enabled: true
  allocatedMemory: 2048     # MB; query answers (frontend)
# index/query cache for TSDB lookups
loki:
  storage_config:
    index_queries_cache_config:
      memcached:
        batch_size: 100
        parallelism: 100
The three caches, what they hold, and what they save:
| Cache | Holds | Backs | Saves | Sizing signal |
|---|---|---|---|---|
| Results cache | Final/sub-query answers | Query-frontend | Repeat/overlapping queries become instant | Dashboard refresh rate |
| Chunks cache | Decompressed chunk bytes from S3 | Querier | Re-scanning the same chunks; S3 GETs | Hot-data working-set size |
| Index cache | TSDB index lookup results | Index-gateway/querier | Repeat index resolution; S3 LISTs | Active stream count |
How to reason about cache effect on cost and latency:
| Symptom | Likely cold cache | Confirm | Fix |
|---|---|---|---|
| Dashboards slow on every refresh | Results cache off/small | loki_cache_request_duration_seconds low hit |
Enable/grow results cache |
| High S3 GET bill, queries re-scan | Chunks cache too small | S3 GET metrics vs chunk reuse | Grow chunks cache memory |
| Index lookups slow under load | Index cache cold | Index-gateway latency | Grow index cache; warm gateways |
| Memory pressure on cache pods | Over-allocated | memcached evictions/OOM | Right-size allocatedMemory |
LogQL basics for operators
You will write LogQL during incidents, so learn the shape. A query has two stages: a log stream selector (label matchers in {}, which use the index — keep these tight) and a pipeline of filters/parsers applied to the lines (brute-force, but parallelized by the read path).
# 1. All error lines for one app in prod (label selector only)
{app="checkout", namespace="prod", level="error"}

# 2. Add a line filter: only lines containing "timeout" (|= is substring)
{app="checkout", namespace="prod"} |= "timeout"

# 3. Exclude noise, then regex-match: drop healthchecks, keep 5xx
{app="api", namespace="prod"} != "/healthz" |~ `status=5\d\d`

# 4. Parse structured logs (logfmt/json) and filter on an extracted field
{app="api"} | json | status_code >= 500 | line_format "{{.method}} {{.path}}"

# 5. Metric query: error rate per pod over 5m (turns logs into a graph)
sum by (pod) (rate({app="api"} |= "ERROR" [5m]))

# 6. Top noisy streams (find a label explosion)
topk(10, sum by (stream) (count_over_time({namespace="prod"} [5m])))
The line/label operators you actually use:
| Operator | Meaning | Stage | Note |
|---|---|---|---|
{label="v"} |
Exact label match | Selector (indexed) | Keep tight; this is the cheap part |
{label=~"re"} |
Regex label match | Selector | Still indexed; broad regex widens scan |
| ` | = “s”` | Line contains substring | Pipeline |
!= "s" |
Line does not contain | Pipeline | Drop noise early |
| ` | ~ “re”` | Line matches regex | Pipeline |
!~ "re" |
Line does not match regex | Pipeline | — |
| ` | json/ |
logfmt` | Parse structured line into labels |
rate(... [5m]) |
Per-second rate of matching lines | Metric | Turns logs into a time series |
count_over_time(... [5m]) |
Count of lines in window | Metric | Volume/cardinality hunting |
sum by (l) (...) |
Aggregate a metric query | Metric | Group by a label |
LogQL performance rules — the difference between a 2-second and a 2-minute query:
| Do | Don’t | Why |
|---|---|---|
Put as many label matchers in {} as possible |
Select {} with one broad label then filter |
Selectors use the index; filters scan |
Filter !=/` |
=before |
~` regex |
| Narrow the time range | Run 30-day ad-hoc scans | Range × streams = work |
| Use ` | json/logfmt` only when needed |
Parse every line unconditionally |
| Watch for high-cardinality labels | Add request_id as a label |
Explodes streams and index |
Architecture at a glance
The diagram traces both paths as they actually flow, sharing only the S3 bucket and the ring. Read it as two lanes converging on storage. On the write lane (top), agents — Grafana Alloy, Promtail, the OTel Collector — push to the gateway, which routes to distributors. Each distributor validates the stream, enforces the tenant’s rate limit, and forwards entries across the ring to ingesters (replication factor 3, quorum 2). Ingesters batch entries into ~1.5 MB chunks and flush them to S3, simultaneously writing the TSDB index; a WAL on each ingester’s PVC survives restarts. The single compactor then merges the per-ingester index files into shared, deduplicated ones in S3 and enforces per-tenant retention.
On the read lane (bottom), a query enters the gateway and lands on a query-frontend, which splits it by time and shards it by stream, queueing the sub-queries in the query-scheduler. Queriers pull work, ask the index-gateway (over gRPC on the headless service) which chunks match — so they never each scan the whole index from S3 — then fetch those chunks from S3, run the LogQL evaluation, dedupe the replicated copies, and hand partial results back to the frontend, which stitches and caches them. Three Memcached tiers (results, chunks, index) sit alongside the read lane. The defining property the diagram shows: the two lanes touch only at S3 and the ring, so scaling queriers for a query storm leaves ingest untouched, and scaling ingesters for a flood leaves queries untouched — with X-Scope-OrgID partitioning every byte by tenant end to end.
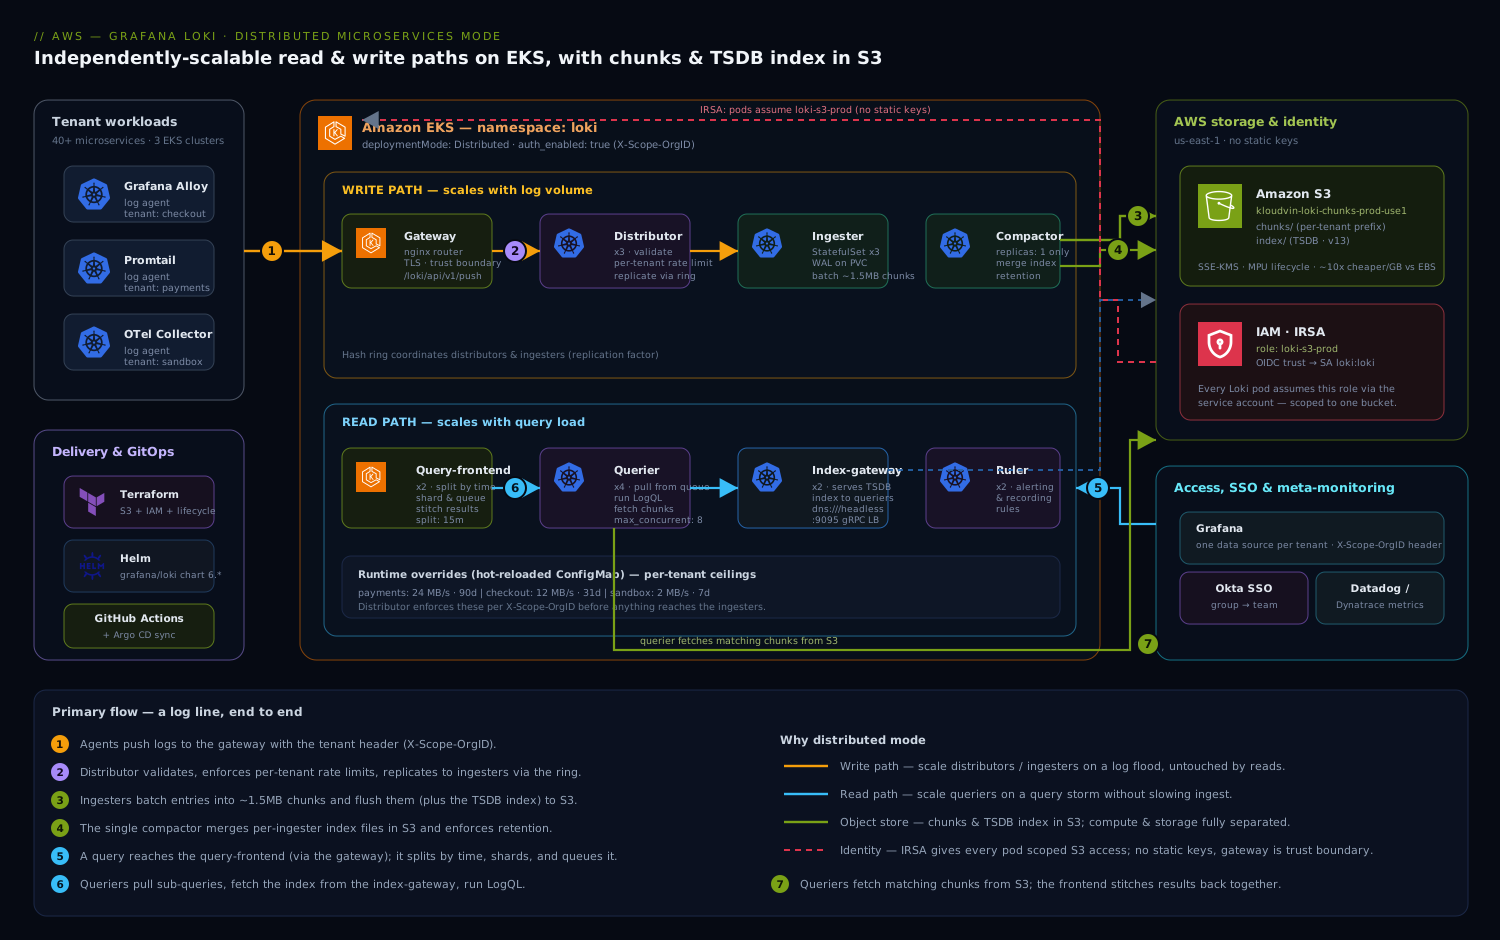
Real-world scenario
Northwind Cloud is a B2B SaaS company with forty-two microservices spread across three EKS clusters (prod-use1, prod-euw1, prod-aps1), ingesting about 1.4 TB of logs per day across six product teams. They started on single-binary Loki on a single r6i.4xlarge with a 2 TB gp3 volume, costing roughly ₹95,000/month for the node and disk. It worked until it didn’t.
The breaking pattern was a daily 9 a.m. cliff. Every weekday a fleet-wide deploy rolled out, every service logged startup and migration noise at once, and ingest spiked to ~4× baseline. The single binary — doing ingest and serving the morning dashboard load and running compaction — would saturate CPU, the WAL disk would creep toward full, and the on-call engineer’s query_range over the previous 24 hours (needed to confirm the deploy was healthy) would time out at the 30-second gateway limit because one process scanned every chunk serially. Worse, the payments team’s verbose audit logging (a regulated requirement) consumed so much of the shared ingest budget that checkout’s logs were intermittently rejected with 429 during the spike — the logs they needed to debug their own deploy were the ones being dropped. One knob; turning it (a bigger node) bought a quarter before the cliff returned, sharper.
The platform team (three SREs) moved to distributed mode over two sprints. They provisioned one S3 bucket per region with IRSA, set auth_enabled: true, and made each team a tenant with its own override: payments got 24 MB/s and 90-day retention (compliance), checkout 12 MB/s and 31 days, three internal/dev tenants 2–4 MB/s and 7 days. They deployed the chart in Distributed mode with 4 distributors, 6 ingesters (RF=3), 8 queriers, 3 query-frontends, 2 query-schedulers, 2 index-gateways, 1 compactor, 2 rulers, and the three Memcached tiers. The first attempt failed with wild querier tail latency: index_gateway_client.server_address was left at the ClusterIP service, pinning every querier to one gateway pod — switching it to dns:///loki-index-gateway-headless...:9095 fixed it in one line. The second snag was a day-one 429 storm from payments — not a low limit but a high-cardinality trace_id label exploding the stream count; moving trace_id into the line dropped active streams 30×.
The outcome held. The 9 a.m. cliff vanished because ingest now scaled on distributors/ingesters while reads scaled on queriers — morning dashboard load no longer competed with the deploy spike. The payments flood was capped to its own 24 MB/s and could never again starve checkout, enforced per tenant before anything reached the ingesters. A 24-hour query_range that used to time out returned in ~3 seconds, split into ninety-six 15-minute shards across eight queriers with a warm results cache. And the bill fell: chunks in S3 cost about ₹22,000/month for 1.4 TB/day at mixed retention (the dev tenants aging out at 7 days pulled the average down hard), and compute — sized to actual load and scaled independently — landed around ₹61,000/month, near ₹83,000 total versus the old ₹95,000, with vastly more headroom and real isolation. The lesson on the wall: “One knob is not a platform. Separate the paths, separate the tenants, put the bytes in S3.”
The migration as a before/after, because the contrast is the lesson:
| Dimension | Single binary (before) | Distributed + S3 (after) |
|---|---|---|
| Read/write coupling | One process; query storm hurt ingest | Separate workloads; fully decoupled |
| Tenant isolation | One fake tenant; teams collided |
Per-tenant rate/retention/RBAC |
| 9 a.m. ingest spike | 429 drops on the team that needed logs |
Each tenant capped to its own quota |
| 24h query | Timed out at gateway (serial scan) | ~3 s (96 shards, warm cache) |
| Storage | 2 TB gp3, capacity-planned | S3, effectively infinite, mixed retention |
| Failure blast radius | Whole logging system down | One component; rest serves |
| Monthly cost | ~₹95,000 (node + disk) | ~₹83,000 (compute + S3), more headroom |
Advantages and disadvantages
Distributed mode is the right answer at scale and genuinely a distributed system to operate. Weigh it honestly:
| Advantages (why distributed + S3 wins) | Disadvantages (why it costs you) |
|---|---|
| Read and write paths scale independently — a query storm never touches ingest, a flood never slows queries | Eight components, a ring, replication, three caches — far more operational surface than one binary |
| S3 chunk storage is ~10× cheaper per GB than EBS and scales without capacity planning | Object-store request costs (PUT/GET/LIST) are a new bill line you must tune (chunk size, compaction) |
Real multi-tenancy: per-tenant rate, retention, and RBAC via X-Scope-OrgID + runtime overrides |
Loki has no built-in user auth — you must front it with a proxy that injects/validates the header |
| Per-component failure: lose a querier and writes keep flowing; compute is separate from durable storage | New failure classes: split-brain ring, index corruption from two compactors, schema-date mistakes |
| Hot-reloaded overrides change a tenant’s limits with no restart | Misconfigurations are subtle (ClusterIP vs headless gateway, RF vs ingester count) and bite under load |
| TSDB index + query sharding make long-range queries fast across many queriers | The index-gateway, caches, and scheduler are extra moving parts you must size and monitor |
| Compute and storage decoupled: a fresh cluster on the same bucket reads all history | Operational expertise required; the single binary is genuinely simpler below a few hundred GB/day |
The model is right when you ingest past a few hundred GB/day, need true per-tenant isolation, or have read patterns that compete with ingest. It is over-engineered below that — a single binary (or the chart’s SingleBinary/SimpleScalable modes) is simpler and cheaper for a homelab or a small team with one tenant. The disadvantages are all manageable, but only if you know they exist — which is the point of the troubleshooting section.
Hands-on lab
Stand up the full distributed topology, push and read logs as a tenant, prove chunks land in S3, prove the index-gateway serves the index, exercise tenant isolation, then tear down without losing data. This assumes an EKS cluster with IRSA already configured (the Terraform from the S3 section applied). Run in your shell with kubectl, helm, and aws configured.
Cost note: this lab provisions ~20+ pods plus a few small PVCs and an S3 bucket. On EKS the dominant cost is the nodes (assume you already run them) plus negligible S3. Tear down at the end; the whole lab costs a few rupees of S3 and whatever your nodes cost for the hour.
Step 1 — Variables and the namespace.
export AWS_REGION=us-east-1
export BUCKET=kloudvin-loki-chunks-prod-use1
export ROLE_ARN=arn:aws:iam::123456789012:role/loki-s3-prod   # from terraform output

kubectl create namespace loki
Step 2 — Create the IRSA-annotated service account. Every Loki component pod uses this SA, so each gets scoped S3 access with no static keys.
kubectl -n loki create serviceaccount loki
kubectl -n loki annotate serviceaccount loki \
  eks.amazonaws.com/role-arn=$ROLE_ARN

kubectl -n loki get sa loki -o jsonpath='{.metadata.annotations}' ; echo
# Expect: {"eks.amazonaws.com/role-arn":"arn:aws:iam::123456789012:role/loki-s3-prod"}
Step 3 — Write the distributed Helm values. This is the production-shaped values file in miniature: Distributed mode, TSDB v13 on S3, RF=3, per-component replicas, multi-tenancy on, and per-tenant overrides.
cat > loki-values.yaml <<'YAML'
deploymentMode: Distributed

loki:
  auth_enabled: true
  schemaConfig:
    configs:
      - from: "2026-01-01"
        store: tsdb
        object_store: s3
        schema: v13
        index:
          prefix: index_
          period: 24h
  storage:
    type: s3
    bucketNames:
      chunks: kloudvin-loki-chunks-prod-use1
      ruler:  kloudvin-loki-chunks-prod-use1
    s3:
      region: us-east-1
  storage_config:
    tsdb_shipper:
      active_index_directory: /var/loki/tsdb-index
      cache_location:         /var/loki/tsdb-cache
      index_gateway_client:
        server_address: dns:///loki-index-gateway-headless.loki.svc.cluster.local:9095
  common:
    replication_factor: 3
  ingester:
    chunk_target_size: 1572864
    chunk_idle_period: 30m
    max_chunk_age: 1h
    wal:
      enabled: true
      dir: /var/loki/wal
  limits_config:
    retention_period: 744h
    ingestion_rate_mb: 8
    ingestion_burst_size_mb: 16
    max_global_streams_per_user: 50000
    max_query_parallelism: 64
    split_queries_by_interval: 15m
    tsdb_max_query_parallelism: 128
    volume_enabled: true
  compactor:
    retention_enabled: true
    delete_request_store: s3
    compaction_interval: 10m
  runtimeConfig: |
    overrides:
      payments:
        ingestion_rate_mb: 24
        retention_period: 2160h
      checkout:
        ingestion_rate_mb: 12
        retention_period: 744h
      sandbox:
        ingestion_rate_mb: 2
        retention_period: 168h

serviceAccount:
  create: false
  name: loki

distributor:   { replicas: 2 }
ingester:
  replicas: 3
  persistence: { enabled: true, size: 10Gi }
querier:       { replicas: 2 }
queryFrontend: { replicas: 2 }
queryScheduler:{ replicas: 2 }
indexGateway:
  replicas: 2
  persistence: { enabled: true, size: 10Gi }
compactor:
  replicas: 1
  persistence: { enabled: true, size: 10Gi }
ruler:         { replicas: 0 }

chunksCache:   { enabled: true, allocatedMemory: 2048 }
resultsCache:  { enabled: true, allocatedMemory: 1024 }

gateway:       { enabled: true }
YAML
echo "values written"
Step 4 — Install the chart.
helm repo add grafana https://grafana.github.io/helm-charts
helm repo update

helm upgrade --install loki grafana/loki \
  --namespace loki \
  --version 6.* \
  --values loki-values.yaml \
  --wait --timeout 12m
Expected: Helm reports the release deployed. If it times out, that is almost always the ring not forming — jump to troubleshooting row 1.
Step 5 — Watch every component come up.
kubectl -n loki get pods -l app.kubernetes.io/instance=loki
# Expect (names abbreviated):
# loki-distributor-...      1/1 Running   (x2)
# loki-ingester-0/1/2       1/1 Running   (StatefulSet, x3)
# loki-querier-...          1/1 Running   (x2)
# loki-query-frontend-...   1/1 Running   (x2)
# loki-query-scheduler-...  1/1 Running   (x2)
# loki-index-gateway-0/1    1/1 Running
# loki-compactor-0          1/1 Running
# loki-gateway-...          1/1 Running
# loki-chunks-cache-0       1/1 Running
# loki-results-cache-0      1/1 Running
Step 6 — Confirm the ring is healthy. Port-forward a distributor and count ACTIVE ingesters — there must be 3 (RF=3 floor).
kubectl -n loki port-forward svc/loki-distributor 3100:3100 >/dev/null 2>&1 &
PF=$!
sleep 3
curl -s localhost:3100/ring | grep -o ACTIVE | wc -l    # expect 3
curl -s localhost:3100/ready                            # expect: ready
Step 7 — Push a log line as the checkout tenant. The X-Scope-OrgID header is the whole isolation boundary.
NOW=$(date +%s)000000000
curl -s -o /dev/null -w "push status: %{http_code}\n" \
  -H "X-Scope-OrgID: checkout" -H "Content-Type: application/json" \
  -XPOST "http://localhost:3100/loki/api/v1/push" \
  --data-raw "{\"streams\":[{\"stream\":{\"app\":\"smoke\",\"env\":\"lab\"},\"values\":[[\"$NOW\",\"hello loki distributed\"]]}]}"
# Expect: push status: 204
Step 8 — Read it back through the gateway (the real read path).
kubectl -n loki port-forward svc/loki-gateway 8080:80 >/dev/null 2>&1 &
PF2=$!
sleep 3
curl -s -G -H "X-Scope-OrgID: checkout" \
  "http://localhost:8080/loki/api/v1/query_range" \
  --data-urlencode 'query={app="smoke"}' \
  --data-urlencode "start=$(($(date +%s)-300))000000000" \
  --data-urlencode "end=$(date +%s)000000000" \
  | grep -o "hello loki distributed" | head -1
# Expect: hello loki distributed
Step 9 — Prove tenant isolation. The same query with a different tenant must return nothing.
curl -s -G -H "X-Scope-OrgID: payments" \
  "http://localhost:8080/loki/api/v1/query_range" \
  --data-urlencode 'query={app="smoke"}' \
  --data-urlencode "start=$(($(date +%s)-300))000000000" \
  --data-urlencode "end=$(date +%s)000000000" \
  | grep -c "hello loki distributed"
# Expect: 0  (streams are partitioned by tenant)
Step 10 — Force a flush and confirm chunks landed in S3. Rather than wait 30 minutes, hit the ingester flush endpoint, then list the bucket under the tenant prefix.
# Flush all ingesters' in-memory chunks to S3
for i in 0 1 2; do
  kubectl -n loki exec loki-ingester-$i -- \
    wget -q -O- --post-data='' http://localhost:3100/flush >/dev/null 2>&1 || true
done
sleep 10

aws s3 ls s3://$BUCKET/checkout/ --recursive | head
# Expect: checkout/<fingerprint>/<chunk>  objects
aws s3 ls s3://$BUCKET/ | grep index_ | head
# Expect: index_<table>/ prefixes
Step 11 — Prove the index-gateway is serving (not the queriers). Querier logs should reference the index-gateway address; the gateway should show index requests.
kubectl -n loki logs deploy/loki-querier | grep -i "index.gateway\|index-gateway" | tail -3
# Expect lines referencing dns:///loki-index-gateway-headless... :9095

kubectl -n loki logs loki-index-gateway-0 | grep -i "query\|index" | tail -3
# Expect index-serving activity
Validation checklist. You proved each independent property — do not declare victory on a green kubectl get pods:
| # | What you validated | The proof | Why it matters |
|---|---|---|---|
| 6 | Ring formed, 3 ingesters ACTIVE | /ring shows 3 ACTIVE; /ready = ready |
RF=3 quorum is possible; memberlist works |
| 7 | Write path accepts a tenant | push status: 204 with X-Scope-OrgID |
Distributor → ingester forwarding works |
| 8 | Read path returns the line | Query through gateway finds it | Frontend→querier→index→chunk works end to end |
| 9 | Tenant isolation holds | Wrong tenant returns 0 | Streams are partitioned by X-Scope-OrgID |
| 10 | Chunks reached S3 | Objects under checkout/ prefix |
Flush + S3 backing actually works |
| 11 | Index-gateway serves the index | Querier logs reference the gateway | Queriers aren’t each scanning S3 |
Teardown — without losing data. Because state lives in S3 and the WAL, rollback and teardown are safe.
kill $PF $PF2 2>/dev/null || true

# Uninstall the workloads
helm -n loki uninstall loki
kubectl delete namespace loki     # removes WAL/index-gateway/compactor PVCs

# The S3 data is intentionally NOT deleted by Helm. Remove it only when sure:
aws s3 rm s3://$BUCKET/ --recursive
# Then destroy the bucket + IRSA role via Terraform if done for good:
# terraform destroy -target=aws_s3_bucket.loki -target=module.loki_irsa
Keep the bucket if you might restore — a fresh Loki pointed at the same bucket and schema reads every historical chunk. That separation of compute from storage is the safety net distributed mode buys.
Common mistakes & troubleshooting
This is the playbook — bookmark it. First as a scannable table you read mid-incident, then the worst offenders expanded.
| # | Symptom | Root cause | Confirm (exact cmd) | Fix |
|---|---|---|---|---|
| 1 | Every write 500s; Helm install times out | Ring split-brain — components in separate rings (memberlist broken) | curl distributor:3100/ring shows <RF ingesters; check 7946 reachability |
Fix join_members/NetworkPolicy on 7946; one memberlist |
| 2 | Writes 429 for one tenant under load | Tenant over its ingestion_rate_mb |
Distributor logs “rate limit”; loki_discarded_samples_total |
Raise that tenant’s override or fix the noisy source |
| 3 | 429 “max streams” though rate is low | Label explosion (high-cardinality label) | topk(10, count by (...) ...); active streams metric |
Move the high-card label into the line; raise cap only if legit |
| 4 | Queries time out / wild tail latency | index_gateway_client at ClusterIP, not headless |
Querier logs show one gateway IP; latency uneven | Set dns:///...index-gateway-headless...:9095 |
| 5 | Shared index corrupt; query errors | Two compactors rewriting the same files | kubectl get sts loki-compactor replicas >1 |
Scale compactor to 1; restore index from backup if needed |
| 6 | Reads return nothing for recent data | New schemaConfig from date in the past |
Compare schema from to now; reads broken over overlap |
New schema entries must use a future date |
| 7 | All flushes 403 | IAM role lacks S3 perms or wrong bucket policy | kubectl logs ingester “AccessDenied”; aws s3 ls as role |
Grant the 4 actions on the bucket ARN; check IRSA annotation |
| 8 | PermanentRedirect/301 on PUT |
s3.region wrong |
Ingester logs show region redirect | Set s3.region to the bucket’s region |
| 9 | Ingester OOMKilled; un-flushed loss | Too many active streams / too few ingesters for RF | kubectl describe pod OOMKilled; memory metric |
Add ingesters; cut cardinality; raise memory request |
| 10 | “WAL disk full” / write failures | WAL PVC too small or flush stalled | loki_ingester_wal_disk_full_failures_total > 0 |
Grow WAL PVC; ensure S3 flush working |
| 11 | S3 503 SlowDown bursts; latency spikes |
Too many tiny index files → LIST/GET storm | S3 5xx metrics; thousands of index objects | Tighten compaction_interval; index-gateway on; larger chunks |
| 12 | Retention not deleting; logs grow forever | retention_enabled: false or compactor not running |
Compactor logs; bucket size climbs | Set retention_enabled: true; confirm 1 compactor up |
| 13 | Logs accepted but never queryable | Everything in fake tenant (auth_enabled: false) |
Query with no header returns all; per-tenant returns none | Set auth_enabled: true; re-key or restart tenancy |
| 14 | Ruler alerts never fire | No object-store rule store / wrong Alertmanager URL | Ruler logs “no rule store”; rules empty | Configure ruler storage + alertmanager_url |
The expanded form for the ones that bite hardest:
1. Every write 500s and the Helm install times out — ring split-brain. Components cannot gossip over memberlist (port 7946), so distributors form a ring without a quorum of ingesters and every forward fails. Confirm with curl -s localhost:3100/ring (port-forwarded) showing fewer than replication_factor ingesters ACTIVE; check that no NetworkPolicy blocks 7946 and that loki-memberlist resolves. Fix: all pods share one memberlist service on 7946 — one memberlist cluster, one ring.
4. Queries time out with wild tail latency — index-gateway client at the wrong address. index_gateway_client.server_address points at the ClusterIP service, so every querier’s gRPC connection pins to a single gateway pod instead of load-balancing. Confirm with kubectl -n loki logs deploy/loki-querier | grep -i index showing one endpoint and lopsided gateway CPU. Fix: use the headless service with dns:/// — dns:///loki-index-gateway-headless.loki.svc.cluster.local:9095.
5. The shared index is corrupt and queries error — two compactors. More than one compactor rewrote the same shared index files concurrently. Confirm with kubectl -n loki get statefulset loki-compactor -o jsonpath='{.spec.replicas}' returning >1. Fix: scale to exactly 1; if already damaged, restore the affected index_<table> objects from S3 versioning/backup or let Loki rebuild recent tables from ingester-written index files.
6. Recent reads return nothing — schema from date in the past. A new schemaConfig entry was added with a from date that has already passed, so reads over the overlap resolve against the wrong store and return empty. Confirm by comparing each configs[].from to today. Fix: new entries must use a future date; data before it keeps the old schema.
9 & 10. Ingester OOM and WAL-full — the write-path durability squeeze. Ingesters hold in-memory chunks for every active stream; too many streams (cardinality) or too few ingesters for RF=3 pushes memory over the limit (OOMKill), and if S3 flushes stall the WAL fills. Confirm: kubectl -n loki describe pod loki-ingester-0 shows OOMKilled; loki_ingester_wal_disk_full_failures_total is non-zero. Fix: cut cardinality first (the real lever), add ingesters, raise the memory request, ensure S3 flush works; grow the WAL PVC as a stopgap.
11. S3 503 SlowDown and latency spikes — request storms from tiny files. Under-tuned compaction leaves thousands of small index files, so index lookups generate enormous LIST/GET volume and S3 throttles. Confirm: S3 5xx metrics spike and aws s3 ls s3://$BUCKET/ --recursive | wc -l shows an index-object explosion. Fix: tighten compaction_interval so the single compactor merges aggressively, keep the index-gateway on, and keep chunks ~1.5 MB.
Best practices
auth_enabled: truefrom day one. Retrofitting tenancy onto data ingested as thefaketenant means re-keying chunk prefixes. Make every team a real tenant immediately.- Exactly one compactor — never scale it. Two corrupt the shared index. Treat
compactor.replicas: 1as a hard invariant, and alert if it ever changes. - Index-gateway client via the headless service with
dns:///. This single line determines whether queriers gRPC-load-balance or hammer one pod. Get it right or you get tail-latency cliffs. - WAL on a durable PVC for every ingester, RF=3. The WAL replays un-flushed entries on restart; RF=3 (with ≥3 ingesters) survives one ingester down with no loss. Together they are your pre-flush durability.
- Keep label cardinality low. Stream count is the master variable for index size, ingester memory, and cost. Never label with
request_id/trace_id/podchurn; push those into the line and scan. - Per-tenant overrides for rate and retention, hot-reloaded. Give regulated tenants long retention and high rate, give dev tenants 7 days and a small cap. The runtime overrides file changes them with no restart.
- New schema entries always use a future
fromdate. A past date silently breaks reads over the overlap. This is a release-process rule, not a runtime one. - Enable all three caches and size them to the working set. Results cache for dashboards, chunks cache for hot data, index cache for the gateway — they turn correct-but-slow into fast and cut S3 GETs.
- Compact aggressively to control the S3 request bill. A tight
compaction_intervalkeeps index file count — andLISTvolume — low. Combined with ~1.5 MB chunks it keeps PUT/GET/LIST sane. - Meta-monitor Loki with Loki’s own metrics. Scrape every component’s
/metrics; watch per-tenantloki_distributor_bytes_received_total,loki_ingester_wal_disk_full_failures_total, ring health, and query-frontend latency. Alert on ingester restarts and any compaction run exceeding its interval. - Deliver via GitOps; never
helm rollbackunder Argo. Keeploki-values.yamland the runtime overrides in Git, reviewed in PRs, synced by Argo CD — a tenant limit change becomes an auditable change, not an ad-hoc upgrade. - Drain ingesters gracefully on rollout. Ensure flush-on-shutdown so a rolling update doesn’t drop un-flushed chunks; respect the
LEAVINGstate.
The signals worth alerting on — leading indicators, not “Loki is down”:
| Alert on | Signal | Threshold (starting point) | Why it’s leading |
|---|---|---|---|
| Ring unhealthy | ACTIVE ingesters < RF |
< 3 for 2 min | Predicts write 500s before they spike |
| WAL pressure | loki_ingester_wal_disk_full_failures_total |
> 0 | Imminent ingester write failure / loss |
| Per-tenant rate | loki_discarded_samples_total{reason="rate_limited"} |
rising | A tenant is being dropped — raise or fix source |
| Query latency | loki_request_duration_seconds (frontend) p99 |
> your SLO | Read path under strain before timeouts |
| S3 throttling | S3 5xx / SlowDown count |
> 0 sustained | Compaction/cardinality problem brewing |
| Compaction lag | Time since last successful compaction | > 2× interval | Index file explosion → cost + slow reads |
| Ingester restarts | Pod restart count | ≥ 1 unexpected | Possible un-flushed loss; investigate |
Security notes
Loki has no built-in user authentication — it trusts X-Scope-OrgID — so the architecture is the security model:
- Treat the gateway as the trust boundary. Terminate TLS at the NGINX gateway and front it with a proxy or service mesh that injects and validates
X-Scope-OrgID, so a tenant can never spoof another’s header. Never expose distributors/queriers directly. - IRSA, never static keys. Authenticate to S3 with the IAM role scoped to one bucket and four actions. No
accessKeyId/secretAccessKeyin values or Secrets — the whole point of IRSA, removing a rotation-and-leak class of bug. - Encrypt chunks at rest with SSE-KMS and enforce TLS on the gRPC traffic between components in regulated environments. Both the index and the chunks carry every tenant’s log data.
- Front Grafana with SSO and use data-source permissions so a
checkoutengineer cannot select thepaymentsdata source. Map IdP groups to Grafana teams; the per-tenant data-source header is the read boundary. - Pull any non-IRSA secret from a secret manager, not a plain
Secret— e.g. an alerting webhook token belongs in Set Up External Secrets Operator to Sync Vault and AWS Secrets into Kubernetes. Loki itself needs no Secret for S3 thanks to IRSA. - Scope the bucket policy and IAM trust tightly — only the Loki role on the bucket, IRSA trust limited to the
loki:lokiservice account — so a compromised pod elsewhere cannot reach the logs. - Don’t leak topology in error responses. Keep detailed errors in Loki’s own logs/metrics; the gateway returns generic failures to clients.
The security controls that also keep the platform resilient — they pull the same way:
| Control | Mechanism | Secures against | Also prevents |
|---|---|---|---|
| Header injection at proxy | Mesh/proxy sets X-Scope-OrgID |
Tenant spoofing another’s logs | Accidental cross-tenant queries |
| IRSA scoped to one bucket | IAM role on loki:loki SA |
Static-key leak; broad S3 access | Rotation breaking Loki; blast radius |
| SSE-KMS on the bucket | aws:kms default encryption |
Log data exposure at rest | Compliance findings |
| Bucket policy least-privilege | Allow only the role + 4 actions | Exfiltration by other principals | Accidental deletes from elsewhere |
| Grafana SSO + DS permissions | IdP groups → teams | Cross-team log reads | Mis-scoped dashboards |
| TLS on gRPC (internal) | mTLS between components | On-cluster sniffing | — |
Cost & sizing
The economics are the whole reason chunks go to S3: object storage is roughly an order of magnitude cheaper per GB than the EBS a single binary needs, and scales without capacity planning. But distributed mode adds compute and S3-request costs you must size deliberately.
Sizing from a logs-per-day number
Start from ingest volume (compressed GB/day after Loki’s ~10× compression) and active stream count — a rough rule for component counts at scale:
| Ingest (raw/day) | Distributors | Ingesters (RF=3) | Queriers | Index-gateways | Compactor |
|---|---|---|---|---|---|
| < 100 GB | 2 | 3 | 2 | 1–2 | 1 |
| 100–500 GB | 2–3 | 3–4 | 3–4 | 2 | 1 |
| 500 GB–1 TB | 3–4 | 4–6 | 4–8 | 2 | 1 |
| 1–3 TB | 4–6 | 6–9 | 8–16 | 2–3 | 1 |
| 3–10 TB | 6–12 | 9–18 | 16–32 | 3–4 | 1 |
What drives each component’s resource needs:
| Component | Sized by | Primary resource | Scale-up trigger |
|---|---|---|---|
| Distributor | Ingest MB/s | CPU | CPU > 70% sustained |
| Ingester | Active streams + ingest | Memory | Memory > 75%; OOMs |
| Querier | Concurrent queries × scan | Memory + CPU | Query queue depth, OOM |
| Query-frontend | Concurrent users, range | CPU (light) | Planning latency |
| Index-gateway | Active stream count | Memory + disk | Index lookup latency |
| Compactor | Index file count | CPU/IO (bursty) | Compaction exceeds interval |
| Caches (memcached) | Working-set size | Memory | Eviction rate high |
What hits the bill
| Cost driver | What you pay for | Rough monthly (1.4 TB/day mixed) | Lever to reduce |
|---|---|---|---|
| S3 storage | Compressed chunks + index at mixed retention | ~₹20,000–25,000 | Per-tenant retention_period; short dev retention |
| S3 requests | PUT (flush), GET (query), LIST (index) | ~₹3,000–6,000 | Larger chunks; tight compaction; index-gateway on |
| Compute (nodes) | Distributors/ingesters/queriers/etc. pods | ~₹55,000–65,000 | Right-size each component to measured load |
| Caches | Memcached pod memory | ~₹3,000–6,000 | Size to working set, not max |
| KMS | SSE-KMS request/key cost | small | bucket_key_enabled cuts it sharply |
| Cross-AZ traffic | Replication + query fan-out across zones | varies | Topology-aware routing where supported |
The biggest levers, in order: per-tenant retention (dev tenants aging out at 7 days pull the storage average down hard), right-sizing read vs write independently (the point of distributed mode — don’t pay for query capacity to absorb a write spike), chunk size + compaction to crush S3 request volume, and cardinality control to shrink the index and ingester memory. Track spend per tenant via loki_distributor_bytes_received_total and S3 storage-by-prefix, and build a chargeback view so each team owns its own log cost.
Interview & exam questions
1. Why decompose Loki into distributed mode instead of scaling the single binary up? The single binary couples the read and write paths in one process, so a query storm starves ingest and a flood slows queries, and vertical scaling has a ceiling. Distributed mode splits the components into independently-scaled workloads sharing only S3 and the ring, so you scale queriers for reads and ingesters for writes separately, lose a component without losing the system, and decouple compute from durable storage.
2. Walk the write path for a single log line. An agent pushes to the gateway → a distributor validates the stream and enforces the tenant’s rate limit → it forwards the entry, replicated replication_factor (default 3) times across the ring, to ingesters → ingesters append it to an in-memory chunk and write the TSDB index, replaying from the WAL on restart → on chunk_target_size/chunk_idle_period/max_chunk_age the chunk flushes to S3 → the single compactor later merges and deduplicates index files and applies retention.
3. What does the index-gateway do and what breaks without it (or with it misconfigured)? It holds the TSDB index and serves index queries to queriers over gRPC (port 9095), so queriers don’t each download and scan the whole index from S3 — preventing LIST/GET storms and slow queries. Misconfigured at the ClusterIP service instead of the headless service with dns:///, every querier pins to one gateway pod and you get tail-latency cliffs.
4. Why must there be exactly one compactor? The compactor rewrites the shared index files in place when it merges, deduplicates, and applies retention. Two compactors rewriting the same files concurrently corrupt the shared index. It is the single most damaging scaling mistake; keep compactor.replicas: 1 as an invariant.
5. Explain replication factor and write quorum. Chunks are durable only after flushing to S3, so the distributor writes each entry to replication_factor ingesters (default 3) to survive an ingester crash before flush. A write succeeds when a quorum — floor(RF/2)+1 = 2 of 3 — acknowledges. RF=3 needs ≥3 ingesters and tolerates one down with no loss; RF=1 loses an ingester’s un-flushed chunks on restart (partly mitigated by WAL replay).
6. How does multi-tenancy work, and what is the security caveat? With auth_enabled: true, every request carries X-Scope-OrgID: <tenant>, which becomes the S3 prefix, rate-limit bucket, retention scope, and query partition. The caveat: Loki has no built-in user auth — it trusts the header — so a trusted proxy/gateway must inject and validate it, or a tenant can spoof another’s.
7. What is the difference between a distributor returning 429 vs 500? A 429 means the tenant exceeded a limit (ingestion rate, stream cap, per-stream rate) — a tenant problem, fixed by an override or fixing the noisy source. A 500 typically means the distributor could not reach a quorum of ingesters (ring unhealthy / split-brain) — a cluster problem, fixed by repairing memberlist/the ring.
8. Why is label cardinality the master variable in Loki? Loki indexes the unique label-set (the stream); high-cardinality labels (request_id, trace_id, churning pod names) explode the number of streams, which bloats the TSDB index, inflates ingester memory, and raises cost. The fix is to keep labels low-cardinality and push high-cardinality data into the log line, where the read path scans it.
9. How does the read path make a 7-day query fast? The query-frontend splits it by time (split_queries_by_interval, e.g. 15-minute slices), shards it by stream (TSDB query sharding), and queues the sub-queries (in the query-scheduler); many queriers run disjoint shards in parallel, resolving the index via the index-gateway and fetching chunks from S3; the results cache makes overlapping repeats instant. Without splitting and caching it would be one serial scan.
10. What happens if you add a new schemaConfig entry with a from date in the past? Reads over the overlap window resolve against the wrong store and silently return nothing. New schema entries must always use a future from date; data before that date keeps using the prior schema. This is a release-process rule.
11. Name the three caches and what each saves. The results cache (query-frontend) holds query answers so repeated/overlapping queries are instant; the chunks cache (querier) holds fetched chunk bytes so re-scans avoid S3 GETs; the index cache (index-gateway/querier) holds index-lookup results so repeat resolutions avoid S3 LISTs. Together they cut both latency and the S3 request bill.
12. Why is distributed Loki cheaper than a single binary at scale despite more components? Chunks live in S3, roughly 10× cheaper per GB than the EBS a single binary needs, and scale without capacity planning; per-tenant retention ages out cheap logs early; and right-sizing read vs write independently avoids paying for read capacity to absorb a write spike. The added compute and S3-request costs are outweighed by storage savings and the elimination of over-provisioned vertical scaling.
These map to vendor-neutral platform/SRE and Kubernetes operator competencies (and Grafana’s own LGTM-stack material). A compact mapping for revision:
| Question theme | Competency area |
|---|---|
| Component decomposition, read/write paths | Distributed systems / observability architecture |
| S3 storage, schema, IRSA | Cloud storage + IAM (AWS) |
| Ring, memberlist, replication, quorum | Distributed-systems fundamentals |
Multi-tenancy, X-Scope-OrgID, overrides |
Platform engineering / governance |
| LogQL, cardinality, query sharding | Observability query + cost control |
| Compaction, retention, deletes | Data lifecycle + compliance |
Quick check
- You added a
schemaConfigentry yesterday withfrom: "2026-06-01"(a past date) and now recent queries return nothing. What is the rule you broke and how do you fix it? - Two engineers scaled the compactor to 2 replicas “for HA” and now queries error with index problems. What happened and what is the fix?
- Queriers show wild tail latency and one index-gateway pod is at 100% CPU while the other is idle. Name the single config line most likely at fault.
- A distributor returns
500on every write and/ringshows only 1 of 3 ingestersACTIVE. Is this a rate-limit problem or something else, and where do you look? - The
paymentstenant is getting429“max streams” even though its ingest MB/s is well under its limit. What is the likely cause and the fix?
Answers
- New schema entries must use a future
fromdate — a past date silently breaks reads over the overlap. Roll the change forward withfromset to a date that hasn’t happened yet (e.g. tomorrow); data before that keeps using the prior schema. - Two compactors rewrote the shared index files concurrently and corrupted the index — the most damaging scaling mistake in Loki. Fix: scale the compactor back to exactly 1; restore damaged
index_<table>objects from S3 versioning/backup or let Loki rebuild recent tables from ingester-written index files. storage_config.tsdb_shipper.index_gateway_client.server_addressis pointing at the ClusterIP service instead of the headless one — set it todns:///loki-index-gateway-headless.loki.svc.cluster.local:9095so gRPC load-balances across all gateway pods.- Not a rate limit (that would be
429). A500with too fewACTIVEingesters is a ring problem — almost always memberlist broken (port 7946 blocked or wrongjoin_members), so the distributor can’t reach a quorum. Check theloki-memberlistservice and any NetworkPolicy on 7946. - A label explosion — a high-cardinality label (e.g.
trace_idor a churningpod/request_id) is creating tens of thousands of streams. Move that label into the log line (so the read path scans it) rather than keeping it as a stream label; only raisemax_global_streams_per_userif the cardinality is genuinely legitimate.
Glossary
- Stream — a unique combination of labels (
{app="x", level="error"}); the unit Loki indexes. Its count is driven by label cardinality. - Chunk — a compressed block of log lines for one stream, held in ingester memory until flushed to S3.
- TSDB index — the modern Loki index (successor to boltdb-shipper) mapping stream labels to chunks; lives in S3, served by the index-gateway, on schema
v13. - Distributor — stateless write front door; validates streams, enforces per-tenant rate limits, and forwards replicated entries to ingesters via the ring.
- Ingester — stateful (WAL) write workhorse; holds in-memory chunks, flushes them to S3, and writes the index; replays the WAL on restart.
- Compactor — single background worker that merges/deduplicates index files and enforces retention and deletes; must be exactly one replica.
- Querier — stateless read workhorse; pulls sub-queries, resolves the index via the index-gateway, fetches chunks from S3, runs LogQL, and dedupes replicated copies.
- Query-frontend — splits queries by time, shards them by stream, queues sub-queries, and owns the results cache.
- Query-scheduler — externalizes the sub-query queue so frontends and queriers scale independently.
- Index-gateway — stateful component that holds the TSDB index and serves it to queriers over gRPC (port 9095), preventing per-querier S3 index scans.
- Ruler — evaluates LogQL recording/alerting rules from an object-store rule store and sends alerts to Alertmanager.
- Ring — the consistent-hash membership of a component, shared via memberlist; how stateless components find stateful ones.
- Memberlist — the gossip protocol (port 7946) that propagates ring state between all participating pods.
- Replication factor (RF) — number of ingesters each entry is written to (default 3) for pre-flush durability; a write needs a quorum (
floor(RF/2)+1). - WAL (write-ahead log) — the ingester’s on-PVC log of un-flushed entries, replayed after a restart so nothing is lost before flush.
X-Scope-OrgID— the HTTP header naming the tenant on every request; the entire multi-tenancy boundary (Loki has no built-in user auth).- Runtime overrides — a hot-reloaded file of per-tenant limits (rate, stream cap, retention) changed without a restart.
- Schema config — the dated list of
{store, schema, object_store}entries; new entries must start at a future date. - IRSA — IAM Roles for Service Accounts; binds an IAM role to a Kubernetes service account so pods get scoped AWS access with no static keys.
- Gateway (NGINX) — the single client entry point that routes read vs write paths and forwards the tenant header; the TLS/trust boundary.
- Caches (results/chunks/index) — three Memcached tiers that accelerate the read path and cut S3 request volume.
Next steps
You can now run Loki as a real distributed, multi-tenant log platform on S3. Build outward:
- Next: Grafana Loki Deep Dive: LogQL, Label Cardinality, and Chunk Storage Tuning — go deep on the query language and the cardinality/chunk tuning that controls cost and speed.
- Related: Running Grafana Mimir: Multi-Tenant, Horizontally Scalable Prometheus Storage — the metrics pillar with the same microservices shape and S3 backing.
- Related: Configure Grafana Tempo with TraceQL, Metrics-Generator, and S3 Block Storage — the traces pillar, completing the LGTM stack on object storage.
- Related: Deploy Vector for High-Throughput Log Routing, Transformation, and Multi-Sink Delivery — shape, transform, and route the log stream before it reaches Loki.
- Related: Set Up External Secrets Operator to Sync Vault and AWS Secrets into Kubernetes — manage any non-IRSA secrets (webhook tokens, etc.) safely.
- Related: Integrate PagerDuty Event Orchestration with Prometheus Alertmanager and Runbooks — route the ruler’s LogQL alerts into real on-call.
- Related: DevOps Observability: Logs, Metrics, Traces and SLOs — where the logs pillar fits in the whole observability picture.