A payments platform team runs forty Kubernetes clusters and a fleet of edge appliances, and their single Prometheus pair has stopped coping. The active series count crossed nine million the week someone added a transaction_id label to a latency histogram; the box now needs 180 GiB of RAM just to stay resident, PromQL queries that used to return in a second time out, and retention is pinned at fifteen days because the local disk is full. The SRE lead’s mandate is blunt: “Thirteen months of metrics, sub-second dashboards, and stop paging me about OOM at 3 a.m.” Prometheus alone cannot do that — its storage is local, its memory scales roughly linearly with active series, and it was never designed as a long-term, horizontally-sharded store. This guide replaces that single Prometheus with a VictoriaMetrics cluster: vmstorage, vminsert and vmselect as three independently scalable tiers, fed by vmagent as a drop-in Prometheus remote_write backend that absorbs high-cardinality ingestion and tames it before it ever touches disk.
VictoriaMetrics splits the monolith Prometheus runs in one process into three roles, and understanding that split is the whole game. vmstorage holds the data and does the heavy lifting of every query — it is the only stateful tier, and the one you scale for cardinality and retention. vminsert is stateless, accepts writes, and shards each incoming time series across the storage nodes by a consistent hash of its label set. vmselect is stateless, fans a query out to every storage node, and merges the partial results. vmagent replaces Prometheus’ own scraping and remote-write machinery: it scrapes targets (or receives Prometheus’ remote_write), buffers to disk when the backend is briefly unavailable, and — crucially — can drop or rewrite high-cardinality labels through relabeling before they hit storage. Because the read and write tiers are stateless, you scale them with a replica count; because storage is sharded, you add cardinality headroom by adding vmstorage pods. Around those four core binaries sit vmalert (recording and alerting rules), vmauth (the authenticating front door and per-tenant router), and vmbackup/vmrestore (snapshots to object storage).
By the end you will have stood up the full topology on Kubernetes with Helm, migrated a live Prometheus onto it with zero data loss, sized vmstorage disk and RAM against a real series budget, used the cardinality explorer to find and drop the label that started the incident, and understood when VictoriaMetrics beats Thanos, Grafana Mimir, or Cortex. Every step runs against a real cluster, uses real flags and defaults, and is reversible.
What problem this solves
The pain is specific and it is a wall you hit suddenly, not gradually. Prometheus keeps its entire active series index — the inverted index mapping label pairs to series IDs — hot in memory. Every new unique combination of label values is a new series, and high cardinality is the state where the number of unique series explodes: a user_id, a transaction_id, a raw path with IDs in it, or a pod label churning across deployments multiplies your series count by orders of magnitude. Because Prometheus RAM scales with active series, a single unbounded label can take a comfortable 1M-series box (a few GiB) to a 10M-series box (tens to hundreds of GiB) overnight, and then it OOM-kills, restarts, replays its WAL for twenty minutes, and OOMs again. That is the 3 a.m. page.
The second wall is retention. Prometheus stores samples on local disk with a default retention of 15 days (--storage.tsdb.retention.time). You can raise it, but you are then betting compliance and capacity-planning data on a single node’s local volume with no replication and no off-box copy — one disk failure and the history is gone. Prometheus was explicitly designed as a reliable short-term store you pair with something else for the long term; the official answer is remote-write to a purpose-built backend. VictoriaMetrics is built for exactly that: an order of magnitude less RAM per series, aggressive on-disk compression (typically well under one byte per sample), and horizontal sharding so cardinality and retention scale by adding pods rather than buying a bigger box.
Who hits this: any team whose metrics outgrew a single Prometheus — multi-cluster fleets (each Prometheus an island with no global view), teams that added a high-cardinality label without realising the cost, cost-sensitive shops that cannot justify Prometheus’ RAM at scale, and anyone with a retention requirement measured in months. The fix is almost never “give Prometheus more RAM” — it is “move to a store whose memory does not scale with cardinality, and stop the runaway label at the ingestion door.”
To frame the field before the deep dive, here is the problem space and where each moving part fits:
| Symptom | What is actually happening | Prometheus-only ceiling | What VictoriaMetrics changes |
|---|---|---|---|
| OOM at high series count | Inverted index + head block held in RAM, scales with active series | RAM ≈ linear in active series; a bad label OOMs the box | ~10× less RAM per series; storage sharded across pods |
| Retention capped at days | Samples on one local disk, no replication | Single-node disk; no off-box durability | 13-month retention on SSD; replication factor; object-storage backup |
| Queries time out | Single process scans everything on one CPU | Vertical only; one node’s cores | vmselect fans out across N storage pods in parallel |
| No global view across clusters | Each Prometheus is an island | Federation is fragile and lossy | One store; write from every cluster’s vmagent/Prometheus |
| Cardinality is invisible | No first-class “what is eating my index” view | /api/v1/status/tsdb exists but coarse |
Cardinality explorer UI + API, per-metric/per-label |
Learning objectives
By the end of this article you can:
- Explain the responsibility of each VictoriaMetrics component — vmstorage, vminsert, vmselect, vmagent, vmalert, vmauth, vmbackup — and name the one configuration choice that matters most for each.
- Deploy the cluster on Kubernetes with the official Helm chart, pinned and reproducible, with 13-month retention and a replication factor of 2.
- Reason correctly about sharding (how
vminsertdistributes series) and replication factor (how many copies survive a node loss), including the exact-replicationFactorand-dedup.minScrapeIntervalflags and where each lives. - Migrate a live Prometheus onto VictoriaMetrics with remote-write, running both in parallel during cutover so rollback is a config revert, not a recovery.
- Use the cardinality explorer to identify the metric or label driving series growth, then write a
vmagentrelabeling rule that drops it at ingestion with evidence, not guesswork. - Size
vmstoragedisk and RAM against a real active-series and ingestion-rate budget, and know what churn does to it. - Distinguish MetricsQL from PromQL — what MetricsQL adds, and the handful of behavioural differences that matter.
- Choose between VictoriaMetrics, Thanos, Grafana Mimir and Cortex for a given constraint, and defend the choice.
Prerequisites & where this fits
You should already understand Prometheus fundamentals: what a time series is (a metric name plus a set of key/value labels), what a sample is (a timestamp/value pair), the difference between counters, gauges and histograms, and how remote_write ships samples out of Prometheus. Comfort with Kubernetes (StatefulSets, PersistentVolumeClaims, Services, ConfigMaps) and Helm 3 is assumed, along with kubectl and basic PromQL. If your grounding is shaky, Monitoring and Observability Basics: Logs, Metrics, and Traces and PromQL in Anger: Rate, Histograms, and Aggregation Patterns That Actually Work are the two upstream reads.
This sits in the metrics platform track. It is the horizontally-scalable long-term store that a fleet of Prometheus servers writes into. It is a sibling decision to Thanos in Production: Global Query View, Deduplication, and Object-Storage Downsampling and Running Grafana Mimir: Multi-Tenant, Horizontally Scalable Prometheus Storage — three answers to the same “Prometheus won’t scale” problem, compared head-to-head later in this guide. The cardinality discipline it depends on is covered in depth in Taming Metric Cardinality: Relabeling, Limits, and Cost Governance in Prometheus, and the general pattern of remote-writing to a long-term backend is Scaling Prometheus: Recording Rules, Remote-Write, and Long-Term Storage with Thanos and Mimir. Alerting on top of this store is Designing Alertmanager Routing Trees: Grouping, Inhibition, Silences, and Dedup.
Concretely you need:
| Prerequisite | Minimum | Why |
|---|---|---|
| Kubernetes | 1.28+ | StatefulSet + PVC + PDB semantics assumed |
| Helm | 3.14+ | Pinned chart install/upgrade |
| StorageClass | SSD-backed, provisioned IOPS (e.g. gp3, managed-csi-premium) |
The inverted index is IOPS-bound; HDD becomes the bottleneck |
| kubectl | Current, RBAC to create the namespace | Create StatefulSets, PVCs, Services |
| An existing Prometheus | Any 2.x with remote_write |
The migration source; keep it running through cutover |
| Cluster headroom | ~3 × (8 vCPU / 32 GiB / 500 GiB SSD) to start | Rough starting point for ~10M active series |
| Object storage | S3 / GCS / Azure Blob bucket | The durable off-cluster backup target |
Core concepts
Six mental models make everything else obvious.
The monolith is split into three roles, and only one is stateful. Prometheus scrapes, stores, and queries in one process. VictoriaMetrics cluster separates write routing (vminsert), storage (vmstorage), and query (vmselect). vminsert and vmselect hold no data — kill them, restart them, scale them freely. vmstorage holds the inverted index and the compressed samples on its PVC; it is the tier you protect and the tier whose count you grow for cardinality.
Writes are sharded; reads are scatter-gather. When a sample arrives at vminsert, it computes a consistent hash of the series’ label set and routes that series to a specific vmstorage node (or, with replication, N nodes). A given series always lands on the same storage node, so its samples stay together. On query, vmselect does the opposite: it does not know which node holds which series, so it asks all of them, then merges. This is why adding vmstorage pods adds cardinality headroom (each holds a slice of the series set) and why vmselect latency depends on your slowest storage node.
Replication factor is durability, set on the writers, and it is not the same as HA. -replicationFactor=N (default 1) is set on both vminsert and vmselect. On vminsert it means “write each series to N distinct storage nodes”; on vmselect it means “a query result is complete once I’ve heard from enough nodes to cover every shard, tolerating up to N−1 missing.” With replicationFactor=2 and 3 storage nodes, one node can die and queries still return complete data. Replication is within one cluster; running two independent clusters behind vmagent (writing to both) is a separate, stronger HA posture.
Deduplication collapses duplicate samples, and you need it in two situations. -dedup.minScrapeInterval tells VictoriaMetrics that samples for the same series closer together than this interval are duplicates and it should keep only one (the last). You set it when (a) you run replication (replicationFactor > 1) so the N copies are deduped on read, and (b) you run an HA pair of vmagent/Prometheus scraping the same targets, which produces two near-identical samples per scrape. Set it to your scrape interval (e.g. 30s) on vmselect (for query-time dedup) and on vmstorage (for on-disk dedup during background merges).
Cardinality is an ingestion problem you fix at vmagent, not a storage problem you fix by scaling. Adding vmstorage pods buys headroom, but the cheap fix for a runaway label is a relabeling rule in vmagent (action: labeldrop or action: drop) that stops the offending series from ever being created. The cardinality explorer tells you exactly which metric or label is the culprit so you drop it with evidence. Every label you drop before storage is index you never build, hold, or query — it pays off directly in RAM and disk.
MetricsQL is a superset of PromQL. VictoriaMetrics speaks the Prometheus query API, so existing Grafana dashboards and Prometheus recording rules work unchanged. Its query language, MetricsQL, adds functions and conveniences PromQL lacks (rollup_rate, histogram_quantile over Prometheus-native and VictoriaMetrics histograms, keep_last_value, default, WITH expressions, and more), and smooths a few PromQL rough edges. There are a small number of intentional behavioural differences — covered in the MetricsQL section — but for day-one migration, PromQL “just works.”
Pin the vocabulary before the deep sections:
| Concept | One-line definition | Where it lives | Why it matters here |
|---|---|---|---|
| vmstorage | Stateful index + compressed sample store | StatefulSet + PVC | The cardinality/retention lever; the only stateful tier |
| vminsert | Stateless write router; shards series | Deployment | Scale for write throughput; owns -replicationFactor |
| vmselect | Stateless query fan-out and merge | Deployment | Scale for query QPS; owns dedup + query guards |
| vmagent | Scrape / receive remote-write, relabel, buffer | Deployment/StatefulSet | Tames cardinality before storage; disk-buffers on outage |
| vmalert | Evaluates recording + alerting rules | Deployment | Runs your Prometheus rules against vmselect |
| vmauth | Auth proxy and per-tenant router | Deployment | The single authenticated front door |
| Active series | Distinct series receiving samples now | vmstorage RAM/index | The number that drives RAM; cardinality = this exploding |
| Churn | Series that appear and disappear over time | Index on disk | High churn bloats the index even at low active count |
| Replication factor | Copies of each series across storage nodes | vminsert + vmselect flag | Node-loss survival within a cluster |
| Deduplication | Drop near-duplicate samples per series | vmselect + vmstorage flag | For replication and HA scrape pairs |
| Tenant | accountID:projectID isolation namespace |
URL path (/insert/<id>/…) |
Multi-tenancy; 0 for single-tenant |
| MetricsQL | VictoriaMetrics’ PromQL superset | vmselect | Existing PromQL works; adds functions |
The components in depth
vmstorage — the stateful heart
vmstorage receives sharded series from vminsert on port 8400, serves query fan-out to vmselect on port 8401, and exposes its own HTTP endpoints (metrics, snapshots) on 8482. It writes two things to its PVC under -storageDataPath: the inverted index (indexdb), which is what high cardinality makes expensive, and the compressed samples (data), which is what long retention makes cheap. Background merges compact small parts into larger ones (this is when on-disk deduplication and, on Enterprise, downsampling are applied) and enforce retention by dropping parts older than the window.
The flags that define its behaviour:
| Flag | What it does | Default | When to change | Gotcha |
|---|---|---|---|---|
-retentionPeriod |
How long samples are kept | 1 (month) |
Set to your requirement, e.g. 13 or 13m for months |
Suffix matters: bare number = months; use d/w/y explicitly for clarity |
-storageDataPath |
Where index + data live | vmstorage-data |
Point at the mounted PVC | Must be fast SSD; the index is IOPS-hungry |
-dedup.minScrapeInterval |
On-disk dedup during merges | off | Set to scrape interval when replicating or HA-scraping | Must match the value on vmselect |
-storage.maxHourlySeries |
Cap new series per hour (cardinality limiter) | 0 (off) | Set to reject a cardinality bomb at the door | Rejected series are counted in vm_rows_ignored_total |
-storage.maxDailySeries |
Cap new series per day | 0 (off) | Backstop against slow-burn churn | Same metric for observability |
-memory.allowedPercent |
% of RAM VictoriaMetrics may use for caches | 60 | Lower if co-tenanting the node | Too low starves caches → slower queries |
-search.maxUniqueTimeseries |
Cap series a single query may touch (storage side) | 300000 | Raise for legitimately wide queries | Guards a node from a runaway query |
-downsampling.period |
Progressive resolution reduction (Enterprise) | off | e.g. 30d:5m,180d:1h,1y:6h |
Enterprise-only; open-source keeps full resolution |
-retentionFilter |
Per-label/tenant retention (Enterprise) | off | Different retention for different series | Enterprise-only; a filter cannot exceed -retentionPeriod |
Two of those deserve emphasis. -downsampling.period and -retentionFilter are Enterprise features — the open-source cluster keeps every sample at full resolution for the whole -retentionPeriod. Do not design an open-source deployment around downsampling; instead size disk for full-resolution retention (the compression makes this affordable) and rely on vmselect’s query-time step to keep dashboards fast. If you genuinely need multi-resolution rollups on open source, the pattern is a second, longer-retention cluster fed recording-rule output — but for most teams full-resolution 13-month storage on SSD is simpler and cheap enough.
vminsert — the write router
vminsert is stateless and accepts writes at 8480 on many protocols: the Prometheus remote_write API (/insert/<tenant>/prometheus/api/v1/write), Influx line protocol, Graphite, OpenTSDB, CSV, and the native VictoriaMetrics import format. It parses each series, applies any global relabeling, computes the shard, and forwards to the right vmstorage node(s). Its flags are about throughput and durability:
| Flag | What it does | Default | Notes |
|---|---|---|---|
-replicationFactor |
Copies of each series to write | 1 | Must be < vmstorage node count; set the same on vmselect |
-storageNode |
List of vmstorage addresses | — | The chart wires this; hand-managed installs must list every node |
-maxLabelsPerTimeseries |
Reject series with more than N labels | 30 | A cardinality guard; over-labelled series are dropped |
-maxLabelValueLen |
Truncate absurdly long label values | 16384 | Stops a giant label value from bloating the index |
-relabelConfig |
Global relabeling before storage | — | Cluster-wide drop/keep rules independent of vmagent |
-insert.maxQueueDuration |
How long a write may queue before erroring | 60s | Backpressure signal when storage is slow |
The single most important fact: -replicationFactor lives here (and on vmselect), not on vmstorage, and it must be strictly less than the number of storage nodes. Set it equal to the node count and a single node loss makes some shards uncoverable — queries fail. replicationFactor=2 with 3 nodes is the standard “survive one node” configuration.
vmselect — the query tier
vmselect is stateless, listens on 8481, speaks the Prometheus query API and MetricsQL, and answers a query by scatter-gathering across all vmstorage nodes and merging. Give it a real cache PVC (not emptyDir) — heavy dashboards thrash the query cache and a persistent cache keeps latency stable across restarts. Its flags guard the cluster from expensive queries:
| Flag | What it does | Default | When to change |
|---|---|---|---|
-replicationFactor |
Tolerate this many missing nodes on read | 1 | Match vminsert; enables partial-result completeness with replication |
-dedup.minScrapeInterval |
Query-time dedup of duplicate samples | off | Set to scrape interval with replication or HA scrape |
-search.maxUniqueTimeseries |
Max series one query may select | 300000 | Raise for wide queries; lower to protect the cluster |
-search.maxQueryDuration |
Kill a query running longer than this | 30s | Raise for heavy reporting queries |
-search.maxQueryLen |
Max length of a query string | 16384 | Rarely changed |
-search.maxConcurrentRequests |
Concurrency cap | 2×vCPU | Tune for QPS vs per-query resource |
-search.latencyOffset |
Ignore very recent, possibly-incomplete data | 30s | Reduce for fresher reads at some risk of gaps |
-cacheDataPath |
Where the query cache lives | — | Point at a PVC, not emptyDir |
vmagent — the ingestion Swiss army knife
vmagent is the piece that makes high cardinality manageable. It scrapes targets (drop-in for Prometheus scraping, honouring the same scrape_configs), or receives remote_write from an existing Prometheus, applies relabeling at scrape time (relabel_configs) and after scrape (metric_relabel_configs), buffers to local disk when the backend is unreachable, and forwards to one or more remoteWriteUrls. It also supports stream aggregation (aggregating high-frequency or high-cardinality input into lower-cardinality output before it reaches storage) — a powerful cardinality lever short of dropping data entirely.
| Flag / config | What it does | Default | Why it matters |
|---|---|---|---|
-remoteWrite.url |
Where to forward (repeatable) | — | Point at the vminsert Service; list twice for dual-cluster HA |
-remoteWrite.maxDiskUsagePerURL |
On-disk buffer cap per target | 0 (unlimited) | Set it so a storage blip buffers instead of dropping |
-remoteWrite.tmpDataPath |
Where the buffer lives | vmagent-remotewrite-data |
Put on a PVC so a restart doesn’t lose the buffer |
-promscrape.config |
The scrape config file | — | Same shape as prometheus.yml scrape_configs |
metric_relabel_configs |
Drop/rewrite labels post-scrape | — | The labeldrop/drop rules that kill cardinality |
-remoteWrite.maxBlockSize |
Max block flushed per request | 8MB | Larger blocks = fewer requests, more memory |
streamAggr.config |
Aggregate before remote-write | — | Collapse high-cardinality input into rollups |
The relabeling rule that solves the incident in the intro — dropping the transaction_id label — is the highest-leverage line of config in this entire architecture. It is shown in full in the lab.
vmalert, vmauth, vmbackup
Three supporting binaries complete the picture:
| Component | Role | Talks to | The choice that matters |
|---|---|---|---|
| vmalert | Evaluates recording + alerting rules on a schedule | Reads vmselect (-datasource.url), writes results to vminsert (-remoteWrite.url), sends alerts to Alertmanager (-notifier.url) |
Point -datasource.url at vmselect and -remoteWrite.url back at vminsert so recording-rule output is stored |
| vmauth | Authenticating reverse proxy + per-tenant router | Fronts vminsert + vmselect | Per-user bearer tokens; route /insert and /select per tenant; rate limits |
| vmbackup / vmrestore | Snapshot to object storage; restore | Reads vmstorage snapshots, writes S3/GCS/Blob | Incremental backups against -snapshot.createURL; test the restore |
vmalert is how your existing Prometheus recording and alerting rules keep working: it reads them in the same YAML format, evaluates queries against vmselect, writes recording-rule results back through vminsert, and fires alerts at Alertmanager. vmbackup takes advantage of VictoriaMetrics’ instant snapshots (hard-links, so a snapshot is near-free and atomic) and uploads incrementally, so a backup after the first full copy transfers only changed parts.
Sharding, replication, and deduplication together
These three interact, and getting them wrong produces either data loss or double-counting. Here is how they compose.
Sharding is automatic and not configurable per se — vminsert hashes the series and picks a storage node. What you control is the number of nodes: more nodes means each holds a smaller slice of the series set, so per-node RAM and disk drop. Replication multiplies writes: replicationFactor=2 writes each series to two nodes, so the effective storage-and-RAM cost per series doubles, in exchange for surviving a node loss. Deduplication is what makes replication and HA scraping correct on read: without it, a series stored twice would return two samples per timestamp.
The interaction, laid out as a decision matrix:
| Your setup | replicationFactor | dedup.minScrapeInterval | vmstorage nodes | Result |
|---|---|---|---|---|
| Single cluster, no HA, cost-first | 1 | off | ≥ 2 (for capacity) | One copy; a node loss loses that shard’s recent data until re-ingest |
| Single cluster, survive one node loss | 2 | <scrape interval> |
≥ 3 | Standard production; one node can die with no data loss or double-count |
| HA scrape pair (2× vmagent/Prometheus) | 1 or 2 | <scrape interval> (required) |
≥ 2 | Duplicate samples from the two scrapers collapsed on read/merge |
| Two independent clusters (strong HA) | per-cluster | <scrape interval> |
per-cluster | vmagent writes to both; either cluster can fully serve; strongest posture |
The rules that keep you out of trouble:
| Rule | Why | Symptom if violated |
|---|---|---|
replicationFactor < vmstorage node count |
Need a surviving node to cover each shard | A node loss makes some shards uncoverable → query errors |
Same replicationFactor on vminsert and vmselect |
Writer and reader must agree on copy count | vmselect either can’t tolerate loss, or double-counts |
dedup.minScrapeInterval equal on vmstorage and vmselect |
On-disk and query-time dedup must agree | Inconsistent sample counts between raw and merged data |
dedup.minScrapeInterval = actual scrape interval |
Dedup window must match sample spacing | Too small = duplicates survive; too large = real samples dropped |
| Don’t set replication and expect storage savings | Replication multiplies storage cost | Disk fills 2× faster than a naive size estimate |
MetricsQL vs PromQL
VictoriaMetrics is Prometheus-query-API compatible, so Grafana, Alertmanager, and your existing recording rules point at vmselect and work. MetricsQL is what the engine actually evaluates — a superset that keeps all valid PromQL working while adding functions and fixing ergonomics. The practical differences:
| Aspect | PromQL | MetricsQL | Impact on migration |
|---|---|---|---|
| Compatibility | Baseline | Superset — valid PromQL is valid MetricsQL | Existing queries/dashboards work unchanged |
| Rate over gaps | rate() can under-report across gaps |
rollup_rate(), rate() with better gap handling |
Smoother graphs; usually a positive surprise |
| Default values | No native way to default a missing series | default, keep_last_value, keep_next_value |
Fewer “No data” panels |
| Subqueries | Verbose bracket syntax | Same syntax plus convenience rollups | Simpler expressions |
WITH templates |
Not available | WITH (…) for reusable sub-expressions |
DRY complex queries |
| Histogram support | Prometheus histograms | Prometheus + VictoriaMetrics histograms (histogram_quantile over both) |
Works with either histogram type |
| Comparison ops | Return the series when true | Optionally return the boolean | Slightly different alert expressions if you rely on this |
| Extrapolation | rate()/increase() extrapolate to range edges |
Less aggressive extrapolation by default | increase() may differ slightly at boundaries |
Two behavioural differences are worth internalising because they can surprise you. First, MetricsQL’s increase() and rate() do less boundary extrapolation than PromQL, which means a counter’s increase() over a short range can differ slightly from Prometheus’ — usually MetricsQL is more accurate, but if you have alerts tuned to Prometheus’ extrapolated values, re-check the thresholds. Second, MetricsQL handles staleness and gaps more gracefully, so a graph that showed “No data” holes in Prometheus may render continuous in VictoriaMetrics; this is generally desirable but can mask a genuine scrape gap, so keep an up-based scrape-health alert independent of your dashboards. For a deeper grounding in the underlying query semantics, PromQL in Anger: Rate, Histograms, and Aggregation Patterns That Actually Work is the companion read.
The cardinality explorer
The single most useful operational feature for this workload is the cardinality explorer — a UI at vmselect’s /select/<tenant>/vmui/#/cardinality and an API at /select/<tenant>/prometheus/api/v1/status/tsdb. It answers the only question that matters when series are exploding: what is eating my index? It reports:
| View | What it tells you | How you act on it |
|---|---|---|
| Top metrics by series count | Which metric names have the most series | Drop or aggregate the worst offenders in vmagent |
| Top labels by value count | Which label has the most distinct values | The runaway label (transaction_id, user_id) — labeldrop it |
| Series count by label name/value | Cardinality contribution of a specific label pair | Confirm a suspected culprit before dropping |
| Series with the most churn | Series that appear/disappear rapidly | Stabilise the label (e.g. drop pod/instance where not needed) |
| Total active series / total series | The headline numbers | Track against your budget and node capacity |
The discipline is: never drop a label on a hunch. Open the explorer, sort by top labels, confirm the offender’s contribution, add the labeldrop rule in vmagent, redeploy, and watch the active-series count fall in the explorer within a scrape interval or two. This is the loop that turns a 9M-series incident back into a 1.5M-series steady state. The same rigour applies to Prometheus itself — Taming Metric Cardinality: Relabeling, Limits, and Cost Governance in Prometheus covers the upstream relabeling patterns in full.
Retention and disk sizing
Sizing vmstorage is the calculation people most often get wrong, so do it explicitly. Two independent numbers drive it: RAM is a function of active series (roughly how many distinct series are receiving samples right now), and disk is a function of ingestion rate × retention × bytes-per-sample, plus the index (a function of total series including churn).
The rules of thumb, with the caveat that you must measure your own after go-live:
| Resource | Driven by | Rough rule of thumb | Real-world caveat |
|---|---|---|---|
| vmstorage RAM | Active series | ~1 GiB RAM per ~1M active series (order of magnitude, workload-dependent) | High churn and wide labels push it up; measure vm_cache_size_bytes |
| vmstorage disk (samples) | Ingestion rate × retention | bytes/sample after compression is typically < 1 byte | Depends on value entropy; counters compress far better than random gauges |
| vmstorage disk (index) | Total series incl. churn | Index grows with unique series ever seen in retention | High churn (frequent pod restarts) bloats this independently of active count |
| CPU | Ingestion + query load | Scales with samples/sec ingested and query fan-out | Query-heavy dashboards need vmselect CPU more than vmstorage |
| IOPS | Merges + index lookups | Provisioned-IOPS SSD mandatory | Burst-credit volumes exhaust credits and collapse under merge load |
A worked disk estimate: suppose steady-state 2 million active series ingested at a 30-second interval. Samples per second = 2,000,000 / 30 ≈ 66,700 samples/s. Over 13 months (~34 million seconds) that is ~2.27 trillion samples. At a conservative 0.7 bytes/sample post-compression, that is roughly 1.5 TiB of sample data, plus index overhead — so across a 3-node cluster with replicationFactor=2, plan for the sample data ×2 (replication) spread over the nodes, i.e. roughly 1 TiB per node of provisioned SSD to start, with headroom for the index and merges (merges can transiently need free space equal to the largest part). This is why the starting-point sizing in the prerequisites (3 × 500 GiB) is a starting point you validate and grow, not a final answer — and why the cheapest way to shrink the bill is to shrink active series with a labeldrop rule.
| Sizing input | Symbol | Example value | Contributes to |
|---|---|---|---|
| Active series | S | 2,000,000 | RAM + index |
| Scrape interval | I | 30 s | Samples/sec |
| Samples/sec | S/I | ~66,700 | Disk (samples) |
| Retention | R | 13 months (~34e6 s) | Disk (samples) |
| Bytes/sample (compressed) | b | ~0.7 | Disk (samples) |
| Replication factor | RF | 2 | Multiplies disk + RAM |
| Churn (new series/day) | — | measure it | Index growth |
High availability topologies
VictoriaMetrics offers HA at two levels, and the right choice depends on how much you are willing to spend and what failure you are guarding against.
| Topology | What survives | Cost | Complexity | When to choose |
|---|---|---|---|---|
| Single cluster, RF=1 | Nothing extra (a node loss loses recent shard data) | Baseline | Low | Non-critical, cost-first, or when re-ingestion is acceptable |
| Single cluster, RF=2, ≥3 storage nodes | One vmstorage node loss, zone loss if spread | +100% storage | Low | The standard production default |
| Single cluster across 3 AZs, RF=2, topology spread | An availability-zone failure | +100% storage + cross-AZ traffic | Medium | Production requiring zone resilience |
| Two independent clusters, vmagent writes both | A whole cluster/region failure | +100% everything | High | Regulatory/critical; global metrics store |
| Two clusters + vmauth/promxy read merge | Cluster failure, transparent to readers | +100% + a read merger | High | Seamless failover for dashboards |
The dual-cluster pattern is the strongest and the most misunderstood. You run two complete VictoriaMetrics clusters (ideally in two regions) and configure vmagent with two remoteWriteUrls so every sample is written to both independently. Reads go through a merging layer (vmauth with both as backends, or a promxy/multi-level vmselect setup) that queries both and deduplicates (hence dedup.minScrapeInterval on the read path). Either cluster can be lost entirely and the other serves complete data — so it guards against failure modes replication cannot: a bad chart upgrade, a region outage, a corrupt index.
VictoriaMetrics vs Thanos vs Mimir vs Cortex
This is the decision the SRE lead actually has to defend, so treat it seriously. All four solve “Prometheus won’t scale to long-term, global, high-cardinality metrics,” but they make very different trade-offs.
| Dimension | VictoriaMetrics (cluster) | Thanos | Grafana Mimir | Cortex |
|---|---|---|---|---|
| Primary storage | Own store on block volumes (PVC) | Object storage (S3/GCS) + Prometheus TSDB blocks | Object storage (blocks) | Object storage (blocks) |
| Architecture | 3 tiers (insert/storage/select) + agents | Sidecar/receiver + store gateway + query + compactor | Microservices (distributor, ingester, store-gateway, querier, compactor…) | Microservices (fork lineage of Mimir) |
| Operational complexity | Low — few binaries, sane defaults | Medium — several components + object store | High — many components; monolithic or microservices mode | High |
| RAM per series | Very low (its headline strength) | Moderate (Prometheus-like ingest) | Moderate | Moderate |
| Query language | MetricsQL (PromQL superset) | PromQL | PromQL | PromQL |
| Ingestion | Push (remote-write) or scrape (vmagent) | Push (receiver) or sidecar on Prometheus | Push (remote-write) | Push (remote-write) |
| Downsampling | Enterprise only | Built-in (compactor) | Built-in | Built-in |
| Multi-tenancy | Yes (tenant in URL) | Limited/add-on | First-class | First-class |
| Long-term store medium | Block SSD (+ object-storage backup) | Object storage native | Object storage native | Object storage native |
| Best fit | Cardinality + cost + simplicity | You already store to object storage and want a global Prometheus view | Large multi-tenant SaaS-scale, object-storage-native | Legacy Cortex deployments |
Read it as a set of decisions rather than a scoreboard:
| If your constraint is… | Lean toward | Because |
|---|---|---|
| High cardinality is the core pain | VictoriaMetrics | Lowest RAM per series; cardinality explorer; drop-at-ingest |
| Minimise moving parts / small team | VictoriaMetrics | Fewest binaries, sane defaults, one store |
| Cost-sensitive, no object-storage mandate | VictoriaMetrics | Cheap SSD + compression; less RAM = smaller nodes |
| You already write everything to S3 and want a global view | Thanos | Object-storage-native; sidecar reuses existing Prometheus |
| Massive multi-tenant, object-storage-first, big team | Grafana Mimir | Purpose-built for that scale; first-class tenancy |
| You run Cortex today | Cortex → consider Mimir | Mimir is the actively-developed successor |
| You need built-in open-source downsampling | Thanos / Mimir | VictoriaMetrics downsampling is Enterprise-only |
The honest summary: VictoriaMetrics wins on simplicity, RAM efficiency, and high-cardinality handling, which is why it is the right answer for the payments team in the intro. Thanos wins when your durability story is already object storage and you want a global query view over existing Prometheus servers with minimal new storage. Mimir (and its Cortex ancestry) wins at SaaS-scale multi-tenancy on object storage with a team to run many components. If open-source downsampling is a hard requirement, that alone can tip you to Thanos or Mimir. Compare the two closest alternatives directly in Thanos in Production and Running Grafana Mimir.
Architecture at a glance
The write path and the read path share the storage tier but are otherwise independent, and keeping them separate in your head is the key to operating this well. On the write path, vmagent scrapes pods and edge appliances (or receives remote_write from your legacy Prometheus), applies relabeling to tame cardinality, buffers to disk if the backend blips, and pushes to a load-balanced vminsert Service on 8480; vminsert hashes each series and shards it across the vmstorage pods (writing two copies with replicationFactor=2). On the read path, Grafana and vmalert query vmselect on 8481, which scatter-gathers across every vmstorage pod on 8401 and merges — deduplicating the replicated copies. vmstorage is the only stateful tier: its PVCs hold both the inverted index (what makes high cardinality expensive) and the compressed samples (what makes 13-month retention cheap). Around the edges, vmauth terminates auth and routes per tenant, vmbackup ships snapshots to object storage, and the cardinality explorer on vmselect is the weekly audit that keeps series growth honest.
Trace the numbered flow: (1) targets and the legacy Prometheus feed vmagent; (2) vmagent relabels and forwards to the vminsert Service; (3) vminsert shards and replicates across vmstorage; (4) vmstorage persists index + samples on SSD PVCs; (5) vmselect fans a query out to all vmstorage nodes and merges; (6) Grafana, vmalert and the cardinality explorer read through vmselect; (7) vmbackup snapshots vmstorage to object storage on a schedule.
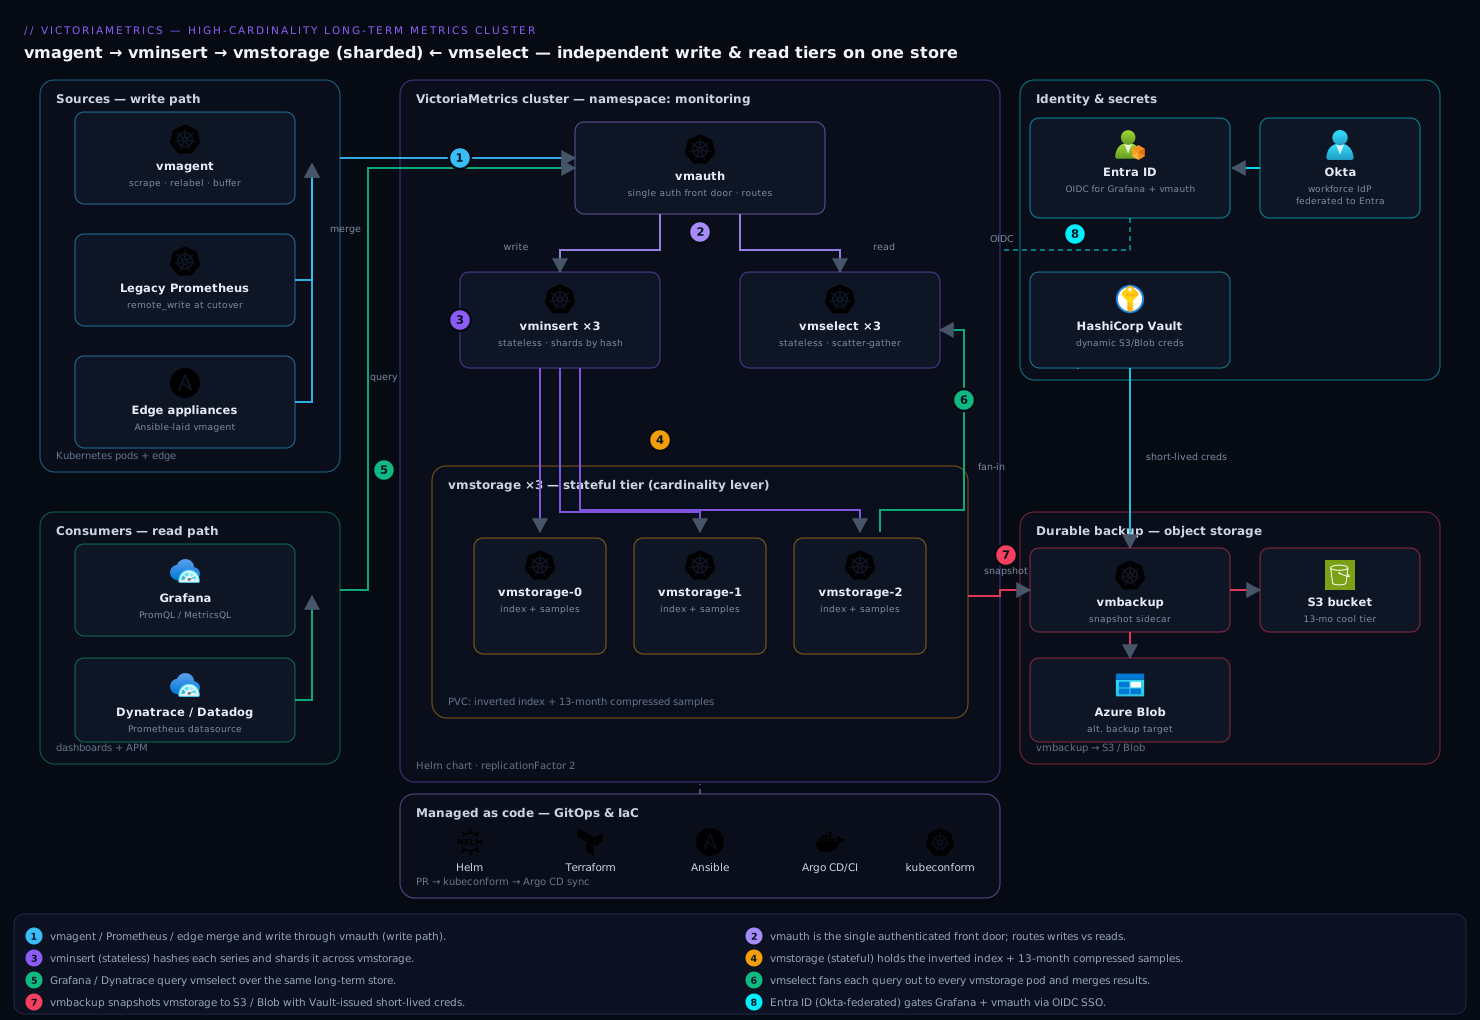
The components, and the one configuration choice that matters most for each:
| Component | Role | The choice that matters | Port |
|---|---|---|---|
| vmagent | Scrape / receive remote_write, relabel, buffer, forward |
-remoteWrite.maxDiskUsagePerURL so a backend blip buffers instead of dropping |
8429 |
| vminsert | Stateless write router; shards series across storage | Replica count for throughput; -replicationFactor for durability |
8480 |
| vmstorage | Stateful index + sample store | -retentionPeriod, disk size, and pod count (your cardinality lever) |
8482 / 8400 / 8401 |
| vmselect | Stateless query fan-out and merge | -search.maxUniqueTimeseries, cache PVC, replica count for QPS |
8481 |
| vmalert | Recording + alerting rule evaluation | -datasource.url → vmselect; -remoteWrite.url → vminsert |
8880 |
| vmauth | Auth proxy / router in front of insert + select | Per-tenant routing and bearer-token enforcement | 8427 |
| vmbackup | Snapshot to object storage | Backup cadence; incremental uploads; restore test | — |
Real-world scenario
Northwind Payments ran its observability on a single Prometheus HA pair (two p3.2xlarge-class nodes, ~64 GiB each) scraping forty EKS clusters via federation plus a fleet of on-prem card-terminal aggregators. For two years it was fine at ~1.4M active series. Then a well-meaning engineer instrumented the payment-authorisation service with a latency histogram labelled by merchant_id and card_scheme, and — because a bug briefly included the transaction_id in a label during a canary — active series spiked to 9.2M over a weekend. Monday morning the primary Prometheus was pinned at 180 GiB RSS on a 64 GiB box, OOM-killing every eight minutes, replaying a 40-minute WAL each time, and never serving a query. Dashboards were blank during the busiest settlement window of the month.
The team’s first instinct was more RAM — a resize to a 128 GiB node bought two hours before the still-growing cardinality OOMed it again. The second, dropping retention to 3 days, kept Prometheus up but violated the 13-month regulatory retention their auditors required and threw away the only long-term data they had. Both were the wrong axis.
The real fix was a migration they had been deferring. Over one maintenance window they deployed a VictoriaMetrics cluster on a separate EKS node group: 3 × vmstorage (8 vCPU / 32 GiB / 500 GiB gp3 at 6,000 provisioned IOPS), 3 × vminsert, 3 × vmselect with a 50 GiB cache PVC each, replicationFactor=2, -retentionPeriod=13, and -dedup.minScrapeInterval=30s. They deployed vmagent and pointed the existing Prometheus pair’s remote_write at the vminsert Service — no scraping changes, both systems in parallel. Within twenty minutes VictoriaMetrics was holding the full series set on ~26 GiB of RAM across the three storage pods — the same 9.2M series that had crushed a 180 GiB Prometheus box.
Then they opened the cardinality explorer at vmselect’s /vmui/#/cardinality. The top-labels-by-value-count view named the culprit instantly: transaction_id with 8.1M distinct values, contributing ~85% of all series. One metric_relabel_configs rule in vmagent — action: labeldrop on transaction_id — dropped it at ingestion. Active series fell from 9.2M to 1.4M within two scrape intervals, back to the pre-incident baseline. They kept the useful merchant_id/card_scheme histogram; only the unbounded ID died.
The outcome, measured a week later: RAM across the whole metrics platform dropped from a 180 GiB single-box requirement to ~30 GiB across the storage tier; p95 dashboard query latency fell from timeouts to 340 ms; retention went from a 3-day emergency crop to the full 13 months on SSD that compressed to ~1.1 TiB per node; and the 3 a.m. OOM pages stopped entirely. They later decommissioned the giant Prometheus boxes and kept a small Prometheus pair purely for scraping, remote-writing everything to VictoriaMetrics. The lesson the SRE lead wrote on the incident review: “Cardinality is not a storage problem you buy your way out of with RAM. It’s an ingestion problem you fix with one relabel rule — once you can see which label to drop.”
The incident as a timeline, because the order of moves is the lesson:
| Time | State | Action taken | Effect | What it should have been |
|---|---|---|---|---|
| Sat 22:00 | Canary adds transaction_id label |
(unnoticed) | Series climbing | Cardinality budget alert should have fired |
| Mon 08:00 | 9.2M series, Prometheus OOM-looping | Resize to 128 GiB node | +2h, then OOM again | Don’t scale RAM to chase cardinality |
| Mon 09:30 | Still looping | Cut retention to 3 days | Stays up, breaks compliance | Don’t trade away required retention |
| Mon 11:00 | Dashboards still blank | Deploy VM cluster + point Prometheus remote_write at it | Both run in parallel, no data loss | The correct first move |
| Mon 11:20 | VM holding 9.2M on ~26 GiB | Open cardinality explorer | transaction_id = 85% of series |
The diagnosis |
| Mon 11:25 | Root cause known | labeldrop transaction_id in vmagent |
9.2M → 1.4M in ~2 scrapes | The actual fix — one line |
| +1 week | Stable | Decommission giant Prometheus, keep small scraper | 30 GiB RAM, 340 ms p95, 13-mo retention | Steady state |
Advantages and disadvantages
The separated-tiers-plus-agent model both causes some operational nuance and delivers the wins that matter here. Weigh it honestly:
| Advantages | Disadvantages |
|---|---|
| Dramatically lower RAM per series than Prometheus — the headline win for high cardinality | Downsampling and per-label retention filters are Enterprise-only; open source keeps full resolution |
| Horizontal scaling: add vmstorage pods for cardinality, vmselect for QPS, vminsert for write throughput | You now operate a distributed system (StatefulSet + several Deployments) instead of one binary |
| Cardinality explorer makes “what is eating my index” a first-class, evidence-based question | Sharding means vmselect latency is bounded by your slowest storage node |
| MetricsQL is a PromQL superset — dashboards and rules migrate unchanged | A few MetricsQL/PromQL behavioural differences (extrapolation, staleness) can surprise |
Drop-in Prometheus remote_write backend — migrate in parallel, roll back by config |
-replicationFactor misconfiguration is a real footgun (query failures on node loss) |
| Excellent on-disk compression (< 1 byte/sample typical) makes long retention on SSD cheap | Block-volume storage (not object-storage-native) means backup/DR is a deliberate step, not automatic |
| Multi-protocol ingestion (Prometheus, Influx, Graphite, OpenTSDB) eases heterogeneous fleets | Object-storage-native competitors (Thanos/Mimir) have cheaper cold storage at extreme scale |
| Fewer moving parts than Thanos/Mimir/Cortex — small teams can run it | Enterprise features (downsampling, some HA conveniences) sit behind a licence |
The model is right when high cardinality, RAM cost, and operational simplicity dominate — which is most teams outgrowing a single Prometheus. It is less obviously right when your durability strategy is already object-storage-first (Thanos fits that grain better) or when you need open-source downsampling at multi-year scale. The disadvantages are all manageable: the Enterprise gaps have open-source workarounds (recording rules into a longer-retention cluster instead of downsampling), and the replication footgun is avoided by one rule (RF < node count, equal on both tiers).
Hands-on lab
This is the centerpiece. You will stand up the full cluster on Kubernetes, deploy vmagent, deliberately create a high-cardinality series, watch it in the cardinality explorer, kill it with a relabel rule, and validate sharding, replication, retention and query — then tear down. Everything uses the official Helm charts and real flags. A small cluster (kind/minikube/k3s or a dev EKS/AKS/GKE node group) works; adjust storage sizes down for a laptop.
Step 1 — Namespace and Helm repo (pin the chart version).
kubectl create namespace monitoring

helm repo add vm https://victoriametrics.github.io/helm-charts/
helm repo update

# See what's available and pin — never let helm upgrade jump a major silently
helm search repo vm/victoria-metrics-cluster --versions | head
Confirm an SSD StorageClass exists before a StatefulSet asks for volumes:
kubectl get storageclass
# Expect a premium/SSD class: gp3 (EKS), managed-csi-premium (AKS), premium-rwo (GKE), or standard on kind.
Expected: at least one StorageClass, ideally SSD/provisioned-IOPS. On kind, standard is fine for the lab.
Step 2 — Write the cluster values file. This defines the three tiers, 13-month retention, and replicationFactor=2.
# vm-cluster-values.yaml
vmstorage:
  replicaCount: 3
  retentionPeriod: "13"                 # months; the long-term-storage requirement
  extraArgs:
    dedup.minScrapeInterval: "30s"      # on-disk dedup for replication / HA scrape
    storage.maxHourlySeries: "2000000"  # reject a cardinality bomb at the door
    storage.maxDailySeries: "8000000"
  persistentVolume:
    enabled: true
    storageClassName: "gp3"             # <-- your SSD class (or 'standard' on kind)
    size: 100Gi                         # lab size; production sizing per the disk section
  resources:
    requests: { cpu: "1", memory: "2Gi" }
    limits:   { cpu: "4", memory: "8Gi" }
  podDisruptionBudget:
    enabled: true
    maxUnavailable: 1

vminsert:
  replicaCount: 3
  extraArgs:
    replicationFactor: "2"              # each series written to 2 storage nodes
    maxLabelsPerTimeseries: "40"        # hard cap on labels per series
  resources:
    requests: { cpu: "250m", memory: "512Mi" }
    limits:   { cpu: "1", memory: "1Gi" }

vmselect:
  replicaCount: 2
  cacheMountPath: /cache
  persistentVolume:
    enabled: true
    storageClassName: "gp3"
    size: 20Gi
  extraArgs:
    replicationFactor: "2"              # MUST match vminsert
    dedup.minScrapeInterval: "30s"      # MUST match vmstorage
    search.maxUniqueTimeseries: "1000000"
    search.maxQueryDuration: "60s"
  resources:
    requests: { cpu: "500m", memory: "1Gi" }
    limits:   { cpu: "2", memory: "4Gi" }
Note the load-bearing constraints encoded here: replicationFactor: "2" on both vminsert and vmselect, dedup.minScrapeInterval: "30s" on both vmstorage and vmselect, and replicaCount: 3 on vmstorage so RF=2 < 3.
Step 3 — Install the cluster and watch storage come up.
helm install vmcluster vm/victoria-metrics-cluster \
  --namespace monitoring \
  --version <pinned-chart-version> \
  -f vm-cluster-values.yaml

kubectl -n monitoring rollout status statefulset/vmcluster-victoria-metrics-cluster-vmstorage --timeout=300s
kubectl -n monitoring get pods -l app.kubernetes.io/instance=vmcluster
Expected: three ...-vmstorage-{0,1,2} pods Running with bound PVCs, three vminsert and two vmselect pods Running. Note the two Service names — you write to one, read from the other:
kubectl -n monitoring get svc | grep -E 'vminsert|vmselect'
# vminsert -> :8480 (write endpoint), vmselect -> :8481 (read endpoint)
The cluster URL paths carry a tenant id (0 for single-tenant). Writes go to /insert/0/prometheus/api/v1/write; reads go to /select/0/prometheus. The 0 is accountID:projectID collapsed to one number — you get multi-tenancy later by changing it.
Step 4 — Deploy vmagent with a relabel rule ready. Deploy vmagent scraping Kubernetes pods, forwarding to vminsert, with disk buffering. We leave the transaction_id drop rule commented so we can first observe the cardinality, then enable it.
# vmagent-values.yaml
remoteWriteUrls:
  - http://vmcluster-victoria-metrics-cluster-vminsert.monitoring.svc:8480/insert/0/prometheus/api/v1/write

extraArgs:
  remoteWrite.maxDiskUsagePerURL: "5GiB"   # buffer if vminsert is briefly down
  remoteWrite.tmpDataPath: /vmagent-buffer
  promscrape.maxScrapeSize: "16MiB"

persistentVolume:
  enabled: true
  storageClassName: "gp3"
  size: 10Gi

config:
  global:
    scrape_interval: 30s
    external_labels:
      cluster: payments-lab
  scrape_configs:
    - job_name: kubernetes-pods
      kubernetes_sd_configs: [{ role: pod }]
      relabel_configs:
        - source_labels: [__meta_kubernetes_pod_annotation_prometheus_io_scrape]
          action: keep
          regex: "true"
      metric_relabel_configs:
        # STEP 6 will UNCOMMENT this to kill the cardinality:
        # - source_labels: [transaction_id]
        #   action: labeldrop
        - source_labels: [__name__]
          regex: "go_gc_duration_seconds.*"
          action: drop
helm install vmagent vm/victoria-metrics-agent \
  --namespace monitoring \
  --version <pinned-chart-version> \
  -f vmagent-values.yaml

kubectl -n monitoring rollout status deployment/vmagent-victoria-metrics-agent
Step 5 — Generate a high-cardinality series and observe it. Push a synthetic metric labelled with thousands of distinct transaction_id values straight into vminsert, simulating the incident. Port-forward vminsert and use the Prometheus import (/api/v1/import/prometheus) endpoint:
kubectl -n monitoring port-forward svc/vmcluster-victoria-metrics-cluster-vminsert 8480 &
# Push 5,000 distinct series differing only by transaction_id
for i in $(seq 1 5000); do
  echo "payment_latency_seconds{merchant_id=\"m42\",card_scheme=\"visa\",transaction_id=\"tx-$i\"} 0.12"
done | curl -s --data-binary @- \
  'http://localhost:8480/insert/0/prometheus/api/v1/import/prometheus'
echo "pushed 5000 high-cardinality series"
Now open the cardinality explorer against vmselect and confirm transaction_id is the offender:
kubectl -n monitoring port-forward svc/vmcluster-victoria-metrics-cluster-vmselect 8481 &

# API view: top label values driving cardinality
curl -s 'http://localhost:8481/select/0/prometheus/api/v1/status/tsdb' \
  | jq '.data.seriesCountByLabelValuePair[0:5], .data.totalSeries'
Expected: payment_latency_seconds dominates by metric name and transaction_id dominates by label; totalSeries reflects the ~5,000 you pushed. The UI equivalent is http://localhost:8481/select/0/vmui/#/cardinality in a browser — the “Labels with the highest number of unique values” panel names transaction_id immediately.
Step 6 — Kill the cardinality at ingestion. Uncomment the labeldrop rule and upgrade vmagent. From now on, scraped series lose transaction_id before they reach storage.
      metric_relabel_configs:
        - source_labels: [transaction_id]
          action: labeldrop
        - source_labels: [__name__]
          regex: "go_gc_duration_seconds.*"
          action: drop
helm upgrade vmagent vm/victoria-metrics-agent \
  --namespace monitoring --version <pinned-chart-version> \
  -f vmagent-values.yaml
kubectl -n monitoring rollout status deployment/vmagent-victoria-metrics-agent
The rule stops new high-cardinality series being created via scraping; the 5,000 you imported directly age out with retention (or you can drop them with a delete-series API call). The point is proven: cardinality is controlled at the vmagent door, not by scaling storage.
Step 7 — Validate sharding, replication, retention and query.
# 1. vmagent is forwarding and not dropping — check its /metrics
kubectl -n monitoring port-forward deploy/vmagent-victoria-metrics-agent 8429 &
curl -s localhost:8429/metrics \
  | grep -E 'vmagent_remotewrite_(requests_total|errors_total|pending_data_bytes)'
# pending_data_bytes near 0 and errors_total flat = healthy forwarding

# 2. Series are sharded across all three storage pods (counts should be roughly even)
for p in 0 1 2; do
  echo -n "vmstorage-$p active series: "
  kubectl -n monitoring exec vmcluster-victoria-metrics-cluster-vmstorage-$p -- \
    wget -qO- localhost:8482/metrics 2>/dev/null | grep -E '^vm_cache_entries\{type="storage/tsid"' | head -1
done

# 3. Query through vmselect returns data (Prometheus API)
curl -s 'http://localhost:8481/select/0/prometheus/api/v1/query?query=payment_latency_seconds' \
  | jq '.data.result | length'

# 4. Cardinality explorer — the weekly audit
curl -s 'http://localhost:8481/select/0/prometheus/api/v1/status/tsdb' \
  | jq '.data.seriesCountByMetricName[0:10]'
Expected: forwarding healthy; series present on each storage pod (roughly even distribution proves sharding; presence on ≥2 proves replicationFactor=2); the query returns a non-zero result count; the cardinality audit lists top metrics. To prove replication survives a node loss, delete one storage pod and re-run the query — it still returns complete data:
kubectl -n monitoring delete pod vmcluster-victoria-metrics-cluster-vmstorage-2
# Immediately re-query; with RF=2 across 3 nodes, results stay complete:
curl -s 'http://localhost:8481/select/0/prometheus/api/v1/query?query=payment_latency_seconds' \
  | jq '.data.result | length'
# The StatefulSet recreates the pod; it re-joins and back-fills from replicas.
Validation checklist. You installed a 3-tier cluster with the exact replication and dedup invariants, deployed vmagent as a remote-write backend, created and saw a high-cardinality explosion in the cardinality explorer, killed it with a one-line labeldrop rule, and proved sharding, replication (survived a node kill), and query all work. That is the entire operating model in miniature.
| Step | What you did | What it proves | Real-world analogue |
|---|---|---|---|
| 3 | Install 3-tier cluster | The topology and Service split are real | Standing up the platform |
| 5 | Push 5,000 transaction_id series |
Cardinality is created by unbounded labels | The incident |
| 5 | Open cardinality explorer | The culprit is findable with evidence | The diagnosis |
| 6 | labeldrop transaction_id |
One rule fixes it at ingestion | The actual production fix |
| 7 | Delete a vmstorage pod, re-query | RF=2 survives a node loss |
HA validation |
Teardown.
helm -n monitoring uninstall vmagent vmcluster
# uninstall deliberately KEEPS the vmstorage PVCs (data-safety). Delete explicitly:
kubectl -n monitoring delete pvc -l app.kubernetes.io/instance=vmcluster
kubectl delete namespace monitoring
helm uninstall intentionally does not delete the vmstorage PVCs — a safety feature so your data survives an accidental uninstall. Delete them only when certain, and (in production) confirm a fresh object-storage backup exists first.
Migrating a live Prometheus
The migration is deliberately low-risk because you keep the legacy Prometheus running through cutover — rollback is a config revert, not a data recovery. Point the existing Prometheus’s remote_write at the vminsert Service and run both in parallel; when confident, decommission the heavy Prometheus and keep a small scraper (or move scraping to vmagent entirely).
# add to the legacy prometheus.yml, then reload Prometheus (SIGHUP or /-/reload)
remote_write:
  - url: http://vmcluster-victoria-metrics-cluster-vminsert.monitoring.svc:8480/insert/0/prometheus/api/v1/write
    queue_config:
      max_shards: 30
      capacity: 20000
      max_samples_per_send: 10000
The queue_config tuning matters under load: max_shards bounds parallelism, capacity and max_samples_per_send size each shard’s buffer and batch. If Prometheus logs remote write queue is full or you see prometheus_remote_storage_samples_dropped_total climbing, raise max_shards and capacity. Point Grafana at vmselect as a Prometheus datasource and existing dashboards render immediately:
# grafana provisioning/datasources/vm.yaml
apiVersion: 1
datasources:
  - name: VictoriaMetrics
    type: prometheus
    access: proxy
    url: http://vmcluster-victoria-metrics-cluster-vmselect.monitoring.svc:8481/select/0/prometheus
    isDefault: true
    jsonData:
      httpMethod: POST
      prometheusType: Prometheus
      timeInterval: 30s
The migration phases, and what to validate at each gate:
| Phase | Action | Validate before proceeding | Rollback |
|---|---|---|---|
| 1. Parallel write | Prometheus remote_write → vminsert |
vmagent/Prometheus remote-write errors flat; series appear in vmselect |
Remove remote_write block |
| 2. Read cutover | Grafana datasource → vmselect | Dashboards render; spot-check panels vs old Prometheus | Point datasource back |
| 3. Rules migration | Move recording/alerting rules to vmalert | vmalert evaluates; alerts fire correctly |
Keep rules in Prometheus |
| 4. Backfill (optional) | Import historical blocks with vmctl |
Historical queries return | N/A (additive) |
| 5. Decommission | Shrink/remove heavy Prometheus | Retention/query stable for a full cycle | Re-scale Prometheus |
For historical data, vmctl migrates existing Prometheus TSDB blocks (or Thanos/InfluxDB/OpenTSDB data) into VictoriaMetrics so you do not lose the past on cutover:
# Migrate historical Prometheus blocks into the cluster (run near the data)
vmctl prometheus \
  --prom-snapshot=/prometheus/snapshots/20260610T090000Z \
  --vm-addr=http://vmcluster-victoria-metrics-cluster-vminsert.monitoring.svc:8480 \
  --vm-account-id=0
Backups to object storage
vmstorage PVCs are durable within the cluster, but the long-term-storage mandate needs an off-cluster copy. vmbackup snapshots vmstorage (instant, hard-linked) and uploads incrementally to S3/GCS/Blob; vmrestore reverses it. Run backups on a schedule and — the rule people skip — test the restore.
# vmbackup as a sidecar on the vmstorage pod (conceptual spec excerpt)
- name: vmbackup
  image: victoriametrics/vmbackup:v1.111.0-cluster
  args:
    - -storageDataPath=/storage
    - -snapshot.createURL=http://localhost:8482/snapshot/create
    - -dst=s3://northwind-vm-longterm/$(POD_NAME)/
    - -customS3Endpoint=https://s3.ap-south-1.amazonaws.com
  env:
    - name: POD_NAME
      valueFrom: { fieldRef: { fieldPath: metadata.name } }
  volumeMounts:
    - { name: vmstorage-volume, mountPath: /storage }
# Restore into a scratch pod BEFORE you ever need it for real
vmrestore -src=s3://northwind-vm-longterm/vmstorage-0/ -storageDataPath=/storage
The backup considerations that decide whether it actually protects you:
| Concern | Setting / practice | Why |
|---|---|---|
| Snapshot cost | vmbackup uses hard-linked snapshots | Near-free, atomic — no dedicated snapshot window needed |
| Incremental transfer | First backup full, then deltas | Only changed parts upload after the initial copy |
| Per-node paths | -dst=s3://…/$(POD_NAME)/ |
Each storage node backs up its own shard |
| Credentials | Short-lived (Vault/IRSA), not static keys | No long-lived access key on disk |
| Retention-aware rotation | vmbackupmanager (Enterprise) or a CronJob prune |
Bounds backup bucket growth |
| Restore drift | Scheduled restore into scratch | A backup you never restored is a hope, not a guarantee |
Common mistakes & troubleshooting
The failures you will actually hit, as a scannable table first, then the reasoning for the ones that bite hardest.
| # | Symptom | Root cause | Confirm (exact cmd / path) | Fix |
|---|---|---|---|---|
| 1 | Queries fail/incomplete after a vmstorage pod dies | replicationFactor = node count (or unset on vmselect) |
kubectl get pod shows one storage pod down; check the flag on both tiers |
Set RF < node count, equal on vminsert and vmselect |
| 2 | Every value double-counted (rates 2×) | Replication or HA scrape without dedup | Compare a counter’s rate() vs expectation; check dedup.minScrapeInterval |
Set dedup.minScrapeInterval = scrape interval on vmstorage and vmselect |
| 3 | vmstorage RAM climbs, then OOM | Runaway cardinality (unbounded label) | Cardinality explorer → top labels by value count | labeldrop/drop in vmagent; set storage.maxHourlySeries |
| 4 | Data dropped during a storage blip | vmagent disk buffer too small / no PVC | vmagent_remotewrite_pending_data_bytes at cap; ..._errors_total rising |
Raise -remoteWrite.maxDiskUsagePerURL; put buffer on a PVC |
| 5 | Query latency spiky, cache cold after restarts | vmselect cache on emptyDir |
Cache path is ephemeral; latency jumps post-restart | Give vmselect a real cacheDataPath PVC |
| 6 | Merges stall, disk near full, ingestion errors | Slow/HDD StorageClass or insufficient free space | High merge latency; vm_free_disk_space_bytes low |
Use provisioned-IOPS SSD; grow PVC; leave merge headroom |
| 7 | remote_write from Prometheus dropping samples |
Queue too small for the sample rate | prometheus_remote_storage_samples_dropped_total climbing |
Raise max_shards, capacity, max_samples_per_send |
| 8 | vminsert rejects writes | replicationFactor ≥ storage nodes, or all nodes unreachable |
vminsert logs “cannot send data”; node count vs RF | Fix RF; check vmstorage Service/endpoints |
| 9 | “No data” for very recent timestamps | -search.latencyOffset (30s) hides fresh, possibly-incomplete data |
Query a timestamp within the offset window | Expected; lower latencyOffset only if you accept partial reads |
| 10 | vmalert alerts don’t fire / recording rules absent | -datasource.url/-remoteWrite.url misconfigured |
vmalert /metrics; rule eval errors |
Point datasource at vmselect, remote-write at vminsert |
| 11 | Query hits too many timeseries error |
search.maxUniqueTimeseries guard tripped |
vmselect error message names the limit | Narrow the query, or raise the flag deliberately |
| 12 | Uneven series distribution across storage pods | A few very-high-cardinality series hash to one node | Per-pod vm_cache_entries counts skewed |
Reduce cardinality; more storage nodes spreads the hash |
| 13 | Data missing after helm uninstall/reinstall |
You deleted the vmstorage PVCs | PVCs gone; storage starts empty | PVCs are kept on uninstall on purpose — don’t delete them; restore from backup |
| 14 | Backup exists but restore fails | Never tested; wrong path/creds/version skew | vmrestore errors on the scratch pod |
Test restores on a schedule; match vmbackup/vmrestore versions |
The expanded reasoning for the ones that cost the most time:
1. Queries fail or return incomplete data after a vmstorage pod dies. The -replicationFactor was set equal to the storage node count (or was set on vminsert but not vmselect). With RF=3 and 3 nodes, every shard lives on all three, so losing one leaves no surviving node that vmselect can treat as the authoritative copy for completeness accounting — it errors rather than silently return partial data. Confirm: kubectl -n monitoring get pods shows a storage pod not Ready, and the RF value differs between vminsert and vmselect (or equals the node count). Fix: RF must be strictly less than the node count and equal on both vminsert and vmselect. RF=2 with 3 nodes is the canonical “survive one” setting.
2. Every value is double-counted; rates read ~2× reality. You enabled replication, or run an HA pair of scrapers, but did not set deduplication — so the same series stored/scraped twice returns two samples per timestamp and sum/rate doubles. Confirm: a counter you know the true rate of reads double; dedup.minScrapeInterval is unset or mismatched between vmstorage and vmselect. Fix: set -dedup.minScrapeInterval to your actual scrape interval on both vmstorage (on-disk merge dedup) and vmselect (query-time dedup) — equal values.
3. vmstorage RAM climbs steadily then OOMs. A label went unbounded (an ID, a raw path, a churning pod), and active series is growing without limit. Confirm: the cardinality explorer’s “labels with the highest number of unique values” names it; vm_cache_size_bytes and active-series metrics climb. Fix: add a labeldrop/drop rule in vmagent for the offender (with evidence from the explorer), and set storage.maxHourlySeries/maxDailySeries as a backstop so the next bomb is rejected at the door instead of OOMing you.
4. Samples are dropped during a brief storage outage. vmagent’s on-disk buffer is too small or on ephemeral storage, so when vminsert/vmstorage is briefly unreachable the buffer fills and vmagent drops. Confirm: vmagent_remotewrite_pending_data_bytes pegged at the max and vmagent_remotewrite_errors_total rising during the blip. Fix: raise -remoteWrite.maxDiskUsagePerURL and mount -remoteWrite.tmpDataPath on a PVC so a restart doesn’t lose the buffer.
13. Data vanished after a helm uninstall and reinstall. helm uninstall intentionally keeps the vmstorage PVCs so data survives an accidental uninstall — but if you then kubectl delete pvc (or a reinstall provisions fresh PVCs), the data is gone. Confirm: the PVCs no longer exist or are freshly bound and empty. Fix: never delete the vmstorage PVCs unless you mean it; restore from object storage with vmrestore. This is why the backup-and-tested-restore discipline is non-negotiable.
Best practices
- Set
replicationFactor< vmstorage node count, and equal on vminsert and vmselect. This one rule prevents the most damaging misconfiguration (query failure on node loss).RF=2with ≥3 nodes is the production default. - Set
dedup.minScrapeIntervalto your scrape interval on vmstorage and vmselect whenever you run replication or an HA scrape pair. Equal values, matching the real interval. - Treat cardinality as an ingestion problem. Drop or aggregate the offending label in vmagent — with evidence from the cardinality explorer — before scaling storage. Set
storage.maxHourlySeries/maxDailySeriesas a backstop. - Give vmstorage provisioned-IOPS SSD and vmselect a real cache PVC. The inverted index is IOPS-bound; burst-credit or HDD volumes become the bottleneck, and an
emptyDircache makes query latency spiky. - Size RAM to active series and disk to ingestion×retention×bytes/sample. Measure both after go-live rather than trusting rules of thumb; grow vmstorage pods for cardinality, vmselect for QPS, vminsert for write throughput — never one oversized everything.
- Migrate in parallel. Keep the legacy Prometheus scraping and remote-writing to vminsert until you have validated reads, rules, and retention for a full cycle — so rollback is a config revert.
- Run the cardinality explorer weekly. It is the standing audit that catches the next runaway label before it becomes a 3 a.m. page.
- Back up to object storage and test the restore on a schedule. vmbackup’s incremental snapshots are cheap; an untested backup is not a backup.
- Pin the Helm chart version and manage values as code (Argo CD/Flux), so a
helm upgradeis a reviewed pull request, not an ad-hoc jump across a major. - Don’t design open source around downsampling. It is Enterprise-only; plan full-resolution retention on SSD (compression makes it affordable) or use a recording-rule-fed second cluster if you truly need rollups.
- Front the cluster with vmauth; never expose vminsert/vmselect directly. One authenticated door with per-tenant routing and rate limits.
- Alert on the leading indicators: vmagent pending/dropped bytes, active-series growth, vmstorage free disk, merge latency, and query duration — not just “cluster down.”
Security notes
- Never expose vminsert or vmselect to the internet directly. Put vmauth in front as the single authenticated front door — it validates bearer tokens, routes per tenant, and rate-limits — and lock the raw component Services to
ClusterIPreachable only from vmauth/vmagent. - Enforce network policy on the
monitoringnamespace. Only vmagent (and vmauth) should reach vminsert; only vmselect (and vmauth) should reach the query path; vmstorage should accept traffic only from vminsert/vmselect. A NetworkPolicy per tier makes lateral movement hard. - Gate human-facing Grafana with OIDC SSO (Entra ID, Okta, Keycloak) so dashboard access follows your existing workforce identity and conditional-access policies — see Deploy Argo CD on Kubernetes with OIDC SSO, RBAC, and ApplicationSets for Multi-Cluster GitOps for the OIDC pattern applied to a platform tool.
- Pull object-storage credentials from a secrets manager, not a static Secret. Vault dynamic secrets or IRSA/workload-identity gives vmbackup short-lived credentials that never sit in plaintext — Set Up External Secrets Operator to Sync Vault and AWS Secrets into Kubernetes is the mechanism.
- Use per-tenant bearer tokens in vmauth so a compromised token is scoped to one tenant’s write/read paths, not the whole cluster.
- Protect the cardinality/vmui and snapshot endpoints. The
/snapshot/createand admin endpoints on vmstorage (8482) can create snapshots and expose internals; keep them off any public path and behind vmauth. - Enable TLS on the ingestion and query paths (terminate at vmauth or an ingress) so remote-write and dashboard traffic isn’t cleartext across the network.
- Right-scope backup bucket policy — block public access, enable object-lock/versioning for tamper resistance, and give the backup identity write-only-to-its-prefix rather than bucket-wide access.
Cost & sizing
The win is mostly RAM. VictoriaMetrics holds the same series in roughly an order of magnitude less memory than Prometheus, so a 180 GiB single-box requirement becomes three modest storage pods, and its on-disk compression (typically < 1 byte/sample) makes 13-month retention on SSD genuinely affordable where Prometheus could not hold fifteen days. Scale each tier independently and only where the pressure is — add vmstorage for cardinality and retention, vmselect for dashboard QPS, vminsert for write throughput — never one oversized everything.
The biggest single lever is the vmagent relabel rule: every high-cardinality label you drop before storage is index you never pay to build, hold, or query, so the cardinality explorer pays for itself directly. Tier the backup bucket to infrequent-access/cool storage since restores are rare. The cost drivers and what each buys:
| Cost driver | What you pay for | Rough magnitude | What it fixes | Watch-out |
|---|---|---|---|---|
| vmstorage instances (RAM) | Memory sized to active series | ~1 GiB RAM / ~1M series (×RF) | The OOM cliff; cardinality headroom | Churn/wide labels push RAM up |
| vmstorage disk (SSD) | Provisioned-IOPS volumes | ~1 TiB/node at ~2M series ×13mo ×RF=2 | Long retention on-box | HDD/burst-credit collapses under merges |
| vmselect instances | CPU + cache PVC for QPS | Scales with dashboard concurrency | Query latency, timeouts | emptyDir cache = spiky latency |
| vminsert instances | CPU for write throughput | Small; scales with samples/sec | Write backpressure | Rarely the bottleneck |
| Object-storage backup | Storage + egress on restore | Cheap on cool tier | Off-cluster durability/DR | Untested backup = false security |
| Cross-AZ / dual-cluster | Replicated traffic + 2× resource | +100% for the strong-HA tier | Zone/region failure | Only pay it if you need that RF |
| Enterprise licence | Downsampling, retention filters, vmbackupmanager | Per-agreement | Multi-resolution rollups, per-tenant retention | Open source has workarounds |
A rough monthly picture for the payments scenario (~2M steady-state active series, 13-month retention, RF=2 on 3 nodes): three ~8 vCPU / 32 GiB / ~1 TiB gp3 storage instances dominate the bill, plus small vminsert/vmselect tiers and an infrequent-access backup bucket. The headline is that this replaces a pair of very large (128–180 GiB RAM) Prometheus boxes with substantially less total RAM and buys 13-month retention the old setup could not deliver at any local-disk size — the fix pays for itself in both RAM saved and pages not received.
Interview & exam questions
1. What does splitting Prometheus into vminsert/vmstorage/vmselect actually buy you? Independent horizontal scaling of write routing, storage, and query. vminsert and vmselect are stateless (scale by replica count for throughput and QPS); vmstorage is stateful and sharded (add pods for cardinality and retention). It also drops RAM per series by roughly an order of magnitude versus Prometheus, which is the point for high cardinality.
2. Where is replicationFactor set, and what constraint must it satisfy? On both vminsert and vmselect (not vmstorage), with the same value. It must be strictly less than the number of vmstorage nodes. RF=2 with 3 nodes lets one node die with no data loss and complete query results; setting RF equal to the node count makes a single node loss break queries.
3. When and where do you set dedup.minScrapeInterval, and to what value? When you run replication (RF>1) or an HA pair of scrapers, so duplicate samples are collapsed. Set it on vmstorage (on-disk dedup during merges) and vmselect (query-time dedup), equal to your actual scrape interval (e.g. 30s). Too small leaves duplicates; too large drops real samples.
4. How does VictoriaMetrics shard data, and what are the implications for query latency? vminsert computes a consistent hash of each series’ label set and routes the series to a specific vmstorage node (N nodes with replication). Queries are scatter-gather: vmselect asks all storage nodes and merges. So adding nodes reduces per-node load, but query latency is bounded by your slowest storage node, and a few very-high-cardinality series can skew the hash distribution.
5. A label went unbounded and vmstorage is OOMing. What’s the correct fix, and what’s the wrong one? Correct: open the cardinality explorer, identify the offending label by unique-value count, and add a labeldrop/drop rule in vmagent so the series is never created — plus storage.maxHourlySeries as a backstop. Wrong: adding RAM or storage pods, which only buys time because cardinality is an ingestion problem, not a storage one.
6. What is the cardinality explorer and how do you use it operationally? A UI (/vmui/#/cardinality) and API (/api/v1/status/tsdb) that report top metrics by series count, top labels by unique-value count, churn, and totals. Operationally you run it weekly (and during incidents) to find with evidence which metric/label drives series growth, then drop or aggregate it in vmagent — never on a hunch.
7. How does MetricsQL relate to PromQL, and name a behavioural difference that can surprise you. MetricsQL is a superset — all valid PromQL works, so dashboards and rules migrate unchanged — and it adds functions (rollup_rate, keep_last_value, default, WITH). A surprise: MetricsQL does less boundary extrapolation on rate()/increase() than PromQL (usually more accurate, but re-check alert thresholds), and it handles gaps/staleness more smoothly (a “No data” hole in Prometheus may render continuous).
8. Compare VictoriaMetrics and Thanos in one paragraph. Both scale Prometheus for long-term/global metrics. VictoriaMetrics stores on block SSD with its own engine, needs far less RAM per series, has the lowest operational complexity, and excels at high cardinality — but open-source downsampling isn’t included. Thanos is object-storage-native (S3/GCS), reuses existing Prometheus via sidecars, and has built-in downsampling — fitting teams whose durability story is already object storage and who want a global query view over existing Prometheus servers.
9. Why keep the legacy Prometheus running during migration? So cutover is reversible: Prometheus keeps scraping and remote_writes to vminsert in parallel while you validate reads (Grafana → vmselect), rules (vmalert), and retention. If anything is wrong, rollback is a config revert (remove the remote_write block, point the datasource back), not a data recovery.
10. Why is downsampling not part of the open-source cluster, and how do you cope without it? -downsampling.period and per-label -retentionFilter are Enterprise features; open source keeps full resolution for the whole retention. Cope by sizing SSD for full-resolution retention (compression < 1 byte/sample makes it affordable) and letting vmselect’s query step keep dashboards fast; if you genuinely need multi-resolution, feed a second longer-retention cluster from recording rules.
11. helm uninstall ran and now data is gone after reinstall — what happened? helm uninstall deliberately keeps the vmstorage PVCs to protect data, but someone deleted the PVCs (or a reinstall provisioned fresh ones), so the on-disk data was lost. Recovery is vmrestore from the object-storage backup — which is why tested backups are mandatory. Never kubectl delete pvc on vmstorage unless you truly mean it.
12. How do you size vmstorage RAM versus disk? RAM scales with active series (~1 GiB/1M series as an order-of-magnitude start, pushed up by churn and wide labels). Disk scales with ingestion rate × retention × bytes-per-sample (compressed < 1 byte/sample) for samples, plus an index that grows with total unique series including churn — all multiplied by the replication factor. Measure both after go-live rather than trusting the rules of thumb.
These map to SRE/Platform and observability skill areas rather than a single vendor cert; the cardinality and remote-write topics align with the Prometheus Certified Associate (PCA) body of knowledge, and the Kubernetes operations align with CKA/CKAD. A compact mapping:
| Question theme | Aligns with | Skill area |
|---|---|---|
| Cardinality control, relabeling | PCA | Metrics governance |
| Remote-write, long-term storage | PCA | Prometheus scaling |
| PromQL/MetricsQL semantics | PCA | Query language |
| StatefulSet/PVC/replication ops | CKA | Kubernetes storage & workloads |
| HA topology, DR, backups | SRE | Reliability engineering |
Quick check
- Where is
replicationFactorconfigured, and what is the one numeric constraint it must satisfy relative to your vmstorage nodes? - You enabled
replicationFactor=2and your dashboards now show every rate at roughly double. What did you forget, and on which two components? - vmstorage RAM is climbing toward OOM. Name the tool that identifies the cause and the vmagent action that fixes it at ingestion.
- True or false: to get thirteen-month retention with progressive downsampling on the open-source cluster, you just set
-downsampling.periodon vmstorage. - During migration, why do you keep the old Prometheus running and pointed at vminsert via
remote_write?
Answers
- On both vminsert and vmselect (with the same value); it must be strictly less than the vmstorage node count.
RF=2with ≥3 nodes is the standard “survive one node loss” setting. - Deduplication. With replication, each series is stored twice; you must set
-dedup.minScrapeInterval(to your scrape interval) on vmstorage (on-disk merge dedup) and vmselect (query-time dedup) so the duplicates collapse. - The cardinality explorer (
/vmui/#/cardinalityor/api/v1/status/tsdb) names the offending metric/label by unique-value count; the fix is alabeldrop(ordrop) rule in vmagent so the runaway series is never created — plusstorage.maxHourlySeriesas a backstop. - False.
-downsampling.period(and per-label-retentionFilter) are Enterprise features. Open source keeps full resolution for the whole retention; size SSD accordingly (compression makes it affordable) or feed a second cluster from recording rules for rollups. - So cutover is reversible: both systems run in parallel while you validate reads, rules and retention, and rollback is a config revert (remove the
remote_write, point the datasource back) rather than a data recovery.
Glossary
- VictoriaMetrics cluster — the multi-node deployment splitting Prometheus into vminsert (write routing), vmstorage (storage), and vmselect (query).
- vmstorage — the stateful tier holding the inverted index and compressed samples on its PVC; the cardinality/retention lever.
- vminsert — the stateless write router that consistent-hash shards each series across vmstorage nodes; owns
-replicationFactor. - vmselect — the stateless query tier that scatter-gathers across all vmstorage nodes and merges; speaks MetricsQL.
- vmagent — the ingestion agent: scrapes or receives remote-write, relabels (tames cardinality), disk-buffers, and forwards.
- vmalert — evaluates Prometheus-format recording and alerting rules against vmselect, storing results via vminsert.
- vmauth — the authenticating reverse proxy and per-tenant router in front of the cluster.
- vmbackup / vmrestore — snapshot vmstorage to object storage (incremental, hard-linked) and restore it.
- vmctl — the migration tool that imports Prometheus/Thanos/InfluxDB/OpenTSDB historical data into VictoriaMetrics.
- Active series — the count of distinct time series currently receiving samples; drives vmstorage RAM.
- Cardinality — the number of unique series; “high cardinality” is that number exploding, usually from an unbounded label.
- Churn — series that appear and disappear over time; inflates the on-disk index even when active series is modest.
- Replication factor — how many copies of each series are written across vmstorage nodes (
-replicationFactor, set on vminsert and vmselect). - Deduplication — dropping near-duplicate samples per series (
-dedup.minScrapeInterval) to correct for replication or HA scraping. - Sharding — vminsert’s consistent-hash distribution of series across vmstorage nodes.
- MetricsQL — VictoriaMetrics’ query language, a PromQL superset with extra functions and smoother gap/staleness handling.
- Cardinality explorer — the UI/API that reports what is driving series growth (top metrics, top labels, churn).
- Downsampling — progressive resolution reduction of older data (
-downsampling.period); an Enterprise feature. - Retention filter — per-label/tenant retention (
-retentionFilter); an Enterprise feature. - Tenant — an
accountID:projectIDisolation namespace expressed in the URL path (/insert/<id>/…,/select/<id>/…).
Next steps
You can now stand up, size, migrate onto, and operate a VictoriaMetrics cluster for high-cardinality long-term storage. Build outward:
- Next: Taming Metric Cardinality: Relabeling, Limits, and Cost Governance in Prometheus — the upstream relabeling discipline that keeps series growth honest at the source.
- Compare: Thanos in Production: Global Query View, Deduplication, and Object-Storage Downsampling — the object-storage-native alternative, head to head.
- Compare: Running Grafana Mimir: Multi-Tenant, Horizontally Scalable Prometheus Storage — the SaaS-scale, multi-tenant alternative.
- Related: Scaling Prometheus: Recording Rules, Remote-Write, and Long-Term Storage with Thanos and Mimir — the general remote-write-to-a-backend pattern.
- Related: PromQL in Anger: Rate, Histograms, and Aggregation Patterns That Actually Work — the query semantics behind MetricsQL.
- Related: Designing Alertmanager Routing Trees: Grouping, Inhibition, Silences, and Dedup — alerting on top of this store via vmalert.
- Related: Engineering Grafana Dashboards That Get Used: RED, USE, Template Variables, and Provisioning-as-Code — the dashboards that read from vmselect.