A mid-size SaaS platform team is bleeding money on its logging bill. Every container ships raw JSON straight to a hosted Elasticsearch cluster, the cluster is the single point of failure for all observability, and when a marketing campaign triples traffic the ingest queue backs up, log shippers OOM-kill, and the on-call engineer is blind during the exact incident they need logs for. The mandate from the platform lead is concrete: cut Elasticsearch index volume by routing low-value logs elsewhere, keep a cheap immutable copy of everything in object storage for compliance and replay, send the metrics-shaped log lines to Loki so Grafana dashboards stop hammering Elasticsearch, and make the whole thing survive a sink outage without dropping data on the floor.
That is exactly the job Vector was built for. Vector is an open-source, Rust-based observability data pipeline from Datadog that collects logs (and metrics, and — in beta — traces) at the edge, transforms them in flight with VRL (Vector Remap Language), and fans them out to multiple destinations with per-sink batching, buffering, and backpressure. A Vector configuration is a directed acyclic graph: sources produce events, transforms reshape and route them, sinks deliver them — and every component in the graph is independently observable, testable, and buffered. One binary, one config format, no JVM, no plugin dependency hell.
This is an intermediate, implementation-first guide. You will build the full pipeline: an agent tier on every node, an aggregator tier doing the heavy parsing, VRL that parses, enriches, redacts and drops, a route transform that splits traffic by condition, and three production sinks (Loki, S3, Elasticsearch) with disk buffers and end-to-end acknowledgements — plus the Datadog and ClickHouse sink patterns you will meet next. The hands-on lab at the centre runs the entire topology on your laptop with Docker Compose, injects known events, proves the routing and redaction, kills a sink to prove the buffering, and tears everything down. Along the way you get the reference tables — source options, VRL error-handling rules, sink matrices, buffer semantics, internal metrics — that you will keep open when you run this for real.
What problem this solves
Log pipelines fail in predictable, expensive ways, and almost all of them come from shipping everything, raw, to one destination:
| Pain in production | What it costs you | What breaks without a pipeline layer |
|---|---|---|
| All logs go to the priciest sink (Elasticsearch/Datadog) | Per-GB ingest and hot storage on debug noise and health checks | The bill grows linearly with traffic, not with value |
| One destination = one failure domain | An ES outage blinds every team at once | No logs during the incident that caused the outage |
| No backpressure handling | Shippers buffer in RAM, then OOM, then drop | Silent data loss at the worst possible moment |
| Parsing at the destination (ingest pipelines, Logstash grok) | CPU burned on the most expensive tier; brittle per-index pipelines | Schema drift breaks dashboards silently |
| PII lands in searchable indices | Emails, tokens, card numbers queryable by anyone with Kibana access | Compliance findings, breach scope, GDPR erasure pain |
| No replay copy | Reindexing means re-shipping from the apps (impossible) | You cannot backfill a new tool or recover from a bad mapping |
| Config drift across 20 node shippers | Every node parses differently | “Works on that node” debugging |
Vector solves this class of problem structurally: collect once at the edge, centralise the expensive work on a scalable tier, decide per event where it goes, and give every sink its own buffer so destinations fail independently. The cost cut is not a discount — it is routing: health checks die in VRL before they cost anything, routine access logs get sampled, only error/warn/audit events reach the expensive index, and S3 holds the complete gzip-compressed archive for pennies.
Who hits this: any team past ~50 GB/day of logs, any team with a compliance retention requirement, any team whose Elasticsearch/Datadog bill is climbing faster than traffic, and every platform team that has been paged because the log shipper — not the app — fell over.
Learning objectives
By the end of this article you can:
- Explain Vector’s component model — sources → transforms → sinks as a DAG — and read any
vector.yamlcold. - Choose between agent, aggregator, and unified deployment roles, and justify the two-tier topology for Kubernetes and VM fleets.
- Configure the four workhorse sources —
file,kubernetes_logs,syslog,http_server— with checkpointing, multiline handling, and enrichment. - Write production VRL: fallible-function error handling, timestamp coercion, field normalization, PII redaction, and event dropping with
abort. - Fan out with the route transform — including the
_unmatchedoutput and multi-match semantics — and shape volume withfilter,sample, andthrottle. - Wire the five key sinks (Loki, Elasticsearch, S3, Datadog, ClickHouse) with the right batching, encoding, and auth for each.
- Configure disk buffers,
when_fullbehaviour, and end-to-end acknowledgements so a sink outage degrades gracefully instead of dropping events. - Unit-test VRL with
vector test, validate configs in CI withvector validate, and monitor Vector with its owninternal_metrics.
Prerequisites & where this fits
You should be comfortable with Kubernetes basics (DaemonSet vs StatefulSet vs Deployment, ConfigMaps, Helm), Docker Compose, YAML, and reading structured logs. You need Docker Desktop or a Linux host with ~6 GB free RAM for the lab. No prior Vector experience is assumed; no cloud account is required for the lab (MinIO stands in for S3).
This article sits in the Observability → Platform track as the log-transport layer. The destinations it feeds each have their own deep dives: Deploy Loki in Distributed Microservices Mode with S3 Chunk Storage and Index Gateway covers the Loki side of the handoff, Grafana Loki Deep Dive: LogQL, Label Cardinality, and Chunk Storage Tuning explains why the label discipline in our Loki sink matters, and Deploy ClickHouse Cluster with ReplicatedMergeTree and ClickHouse Keeper is where the ClickHouse sink points. If your organisation standardises on OpenTelemetry instead, Building Production OpenTelemetry Collector Pipelines: Receivers, Processors, and Tail Sampling is the sibling architecture — the comparison section below maps the two head to head.
Where each piece of this guide fits in the delivery path:
| Layer | Component here | Runs as | Owns |
|---|---|---|---|
| Edge collection | Vector agent (kubernetes_logs, file, journald) |
DaemonSet / systemd unit | Tail, tag, forward; on-node spool |
| Transport | vector source/sink (native gRPC) |
Port 6000 | Compression, acks between tiers |
| Central processing | Vector aggregator (VRL + route) | StatefulSet (Helm Aggregator role) |
Parse, enrich, redact, sample, route |
| Delivery | Sinks (Loki, S3, ES, Datadog, ClickHouse) | Per-sink batching + disk buffer | Retries, backpressure, acks |
| Self-observability | internal_metrics → prometheus_exporter |
Port 9598 | The pipeline watching itself |
Core concepts
Five ideas carry everything else in this guide.
Everything is a component in a DAG. A Vector config declares named components under three top-level keys: sources (produce events), transforms (consume and re-emit events), and sinks (consume and deliver events). Every transform and sink names its upstreams in inputs: [...]. That is the whole model — the config is the topology, and vector graph will print it as DOT. Cycles are rejected at validation time.
Events are structured, typed data — not lines. A Vector log event is a free-form map of fields (.message, .timestamp, .host, plus anything you add); a metric event is a typed counter/gauge/histogram/summary/distribution. Sources decode bytes into events (via decoding.codec); sinks encode events back out (via encoding.codec). Transforms operate on the structured event, which is why parsing early pays off everywhere downstream.
VRL is the transformation language, and it is compiled and fail-safe. VRL expressions compile at boot; a config with an unhandled fallible expression refuses to start rather than crashing at 3 a.m. on a malformed line. This compile-time error-handling discipline is Vector’s single biggest operational win over grok-style pipelines.
Backpressure is per-sink and explicit. Each sink has its own buffer (memory by default, disk when you say so) and its own when_full policy. A slow Elasticsearch fills its buffer and then pushes back up its edge of the graph; Loki and S3 keep flowing. With end-to-end acknowledgements enabled, sources only checkpoint/commit an event after every connected sink has durably accepted it.
Roles, not different products. The same binary runs as an agent (light, per-node, forwards) or an aggregator (central, heavy, routes and delivers). The topology section next makes the choice concrete.
The vocabulary in one table:
| Term | One-line definition | Where you set it |
|---|---|---|
| Source | Component that ingests/produces events (file, kubernetes_logs, syslog, http_server, vector, demo_logs) |
sources: |
| Transform | Component that reshapes/filters/routes events (remap, route, filter, sample, throttle, dedupe, reduce) |
transforms: |
| Sink | Component that delivers events (loki, elasticsearch, aws_s3, datadog_logs, clickhouse, console) |
sinks: |
| VRL | Vector Remap Language — compiled expression language used by remap and by conditions |
source: blocks, condition: fields |
inputs |
The upstream component IDs a transform/sink consumes | every transform/sink |
| Named output | Extra output streams some components expose (e.g. route.<name>, route._unmatched, remap.dropped) |
referenced in inputs |
data_dir |
Directory for checkpoints and disk buffers (default /var/lib/vector) |
global |
| Buffer | Per-sink queue: memory (default, 500 events) or disk (sized in bytes) |
sinks.<id>.buffer |
| Acknowledgement | End-to-end delivery confirmation from sink back to source | acknowledgements.enabled |
| Role | Deployment shape: agent (per node) vs aggregator (central service) | Helm role:, your architecture |
A minimal but complete vector.yaml shows the anatomy — read it once and every later snippet is just “more of this”:
data_dir: /var/lib/vector          # checkpoints + disk buffers live here
api:
  enabled: true                    # powers `vector top` and `vector tap`
  address: 127.0.0.1:8686

sources:
  in:
    type: demo_logs                # synthetic events, great for testing
    format: json
    interval: 1.0                  # one event per second

transforms:
  parse:
    type: remap
    inputs: [in]
    source: |
      . = merge(., object!(parse_json!(string!(.message))))

sinks:
  out:
    type: console
    inputs: [parse]
    encoding: { codec: json }
Validate and run it: vector validate vector.yaml && vector --config vector.yaml. Everything in this article is this pattern scaled up: more sources, a real VRL chain, a router, and sinks that matter.
Topology: agent, aggregator, or both
Vector runs the same binary in different roles, and picking the wrong shape is the most common design mistake. There are three viable topologies:
| Topology | Shape | Strengths | Weaknesses | Pick when |
|---|---|---|---|---|
| Agent-only (distributed) | Every node parses, routes, and ships directly to sinks | Simplest; no extra tier; lowest latency | N × sink connections; config changes touch every node; heavy VRL steals node CPU; per-node egress auth | Small fleets (< ~20 nodes), simple pipelines, one or two sinks |
| Agent + aggregator (centralized) | Thin per-node agents forward to a scalable central tier that does everything else | Agents stay tiny; one place for VRL/routing/secrets; sinks see few stable clients; independent scaling | One more tier to run; aggregator is now stateful (disk buffers) | Kubernetes clusters, > ~20 nodes, multi-sink routing, compliance redaction — this guide’s choice |
| Aggregator-only (push) | Apps/appliances push straight to a central Vector over HTTP/syslog | No node footprint at all | No local spool if the network blips; apps must speak HTTP/syslog | SaaS/appliance sources, serverless, network devices |
Agent tier. On Kubernetes this is the Helm chart’s role: Agent — a DaemonSet, one lightweight Vector per node, hostPath-mounted onto /var/log/pods. Its only jobs: tail container logs with the kubernetes_logs source, attach node/cluster identity, and forward everything to the aggregator over the vector sink (Vector’s native gRPC protocol, conventionally port 6000) with a small on-node disk buffer. Agents are stateless-ish and disposable: the checkpoint files and spool live on the node, and anything already acknowledged downstream is safe if the node dies.
Aggregator tier. The Helm chart’s role: Aggregator deploys a StatefulSet — deliberately, because disk buffers need stable PersistentVolumeClaims. (There is also role: Stateless-Aggregator, a Deployment, for when you accept memory-only buffering.) This tier receives on a vector source, runs the full VRL chain, routes, and fans out to the sinks. It scales horizontally behind a Service; agents load-balance across replicas.
Why split at all? Because the two tiers have opposite resource profiles and change cadences:
| Property | Agent | Aggregator |
|---|---|---|
| CPU per instance | 50–200m (tail + forward) | 1–4 cores (VRL parse/enrich) |
| Memory | 128–256 Mi | 1–4 Gi |
| Disk | Small spool (256 Mi–1 Gi) | Large per-sink buffers (10–50 Gi PVC) |
| Config change frequency | Rarely (it barely does anything) | Weekly (every new parse rule / route) |
| Blast radius of a bad config | Every node | One tier, rolled instance by instance |
| Scaling trigger | Node count (automatic) | Log volume / VRL cost |
| Credentials held | One: the aggregator address | All sink credentials, in one place |
Collapsing the tiers means every parse-rule change rolls a DaemonSet across the whole fleet, every node holds every sink credential, and a VRL hot loop steals CPU from your workloads on every node. Keep the agents boring.
Sources: getting events in
Sources own decoding, checkpointing, and (for pull-based ones) file discovery. The workhorses:
| Source type | What it ingests | Delivery guarantees | Key options | Typical role |
|---|---|---|---|---|
file |
Tails files by glob | Checkpointed in data_dir; at-least-once with acks |
include, read_from, multiline, fingerprint, ignore_older_secs |
VM agents |
kubernetes_logs |
Container logs under /var/log/pods, auto-enriched with pod metadata |
Checkpointed; merges partial CRI lines | extra_label_selector, extra_field_selector, auto_partial_merge, glob_minimum_cooldown_ms |
K8s agent DaemonSet |
syslog |
RFC 3164/5424 over TCP/UDP/Unix socket | TCP: connection-level; UDP: none | mode, address, max_length |
Network devices, appliances, F5/Palo/FortiGate |
http_server |
HTTP POST bodies (JSON/NDJSON/bytes) | Responds 2xx after (optionally) acked | address, decoding.codec, path, auth |
Apps/appliances that push; webhook-style producers |
vector |
Native Vector-to-Vector gRPC | End-to-end acks supported | address (source), address + compression (sink side) |
Agent → aggregator transport |
journald |
systemd journal | Cursor checkpointed | current_boot_only, include_units |
VM agents on systemd hosts |
docker_logs |
Docker daemon API | Checkpointed | include_containers |
Non-K8s container hosts |
kafka |
Kafka topics (consumer group) | Offsets committed on ack — strongest | bootstrap_servers, topics, group_id |
Decoupled/high-scale ingest |
aws_s3 |
Objects via SQS notifications | SQS delete on ack | sqs.queue_url |
Replays, ELB/CloudTrail logs |
internal_metrics / internal_logs |
Vector’s own telemetry | n/a | scrape_interval_secs |
Self-observability |
demo_logs |
Synthetic events | n/a | format: json|apache_common|syslog, interval |
Labs, load tests |
file — the VM workhorse
sources:
  app_files:
    type: file
    include: ["/var/log/app/*.log", "/var/log/nginx/*.log"]
    exclude: ["/var/log/app/*.gz"]
    read_from: beginning          # first run reads history; checkpoint takes over after
    ignore_older_secs: 86400      # skip files untouched for a day
    max_line_bytes: 102400
    multiline:                    # stitch Java stack traces into one event
      start_pattern: '^\d{4}-\d{2}-\d{2}'   # a new event starts with a date
      mode: halt_before
      condition_pattern: '^\d{4}-\d{2}-\d{2}'
      timeout_ms: 1000
The details that bite: fingerprinting decides how Vector recognises “the same file” across renames — the default checksum strategy hashes the first lines and survives logrotate’s rename dance; device_and_inode breaks when copytruncate rotation reuses inodes. Checkpoints live under data_dir, so if you run the agent in a container without persisting data_dir, every restart re-reads from read_from — duplicate storm. Persist it.
kubernetes_logs — the DaemonSet source
One line of config does an enormous amount:
sources:
  k8s:
    type: kubernetes_logs
    extra_label_selector: "vector.dev/exclude!=true"   # opt-out via pod label
    glob_minimum_cooldown_ms: 15000                    # discovery scan interval
    auto_partial_merge: true                           # reassemble >16 KiB CRI-split lines
Every event arrives pre-enriched from the Kubernetes API: .kubernetes.pod_name, .kubernetes.pod_namespace, .kubernetes.container_name, .kubernetes.container_image, .kubernetes.pod_labels, .kubernetes.pod_node_name, .kubernetes.pod_owner, plus .file and .stream (stdout/stderr). That metadata is what your routing conditions and Loki labels will key on, and you get it without writing a single VRL line. auto_partial_merge matters more than it looks: containerd splits log lines over 16 KiB into partial chunks, and without the merge your JSON parsing fails on fragments.
syslog — appliances and network gear
sources:
  edge_syslog:
    type: syslog
    mode: tcp                     # udp for fire-and-forget devices; tcp when you can
    address: 0.0.0.0:5514         # unprivileged port; Service maps 514 → 5514
The source parses RFC 3164 and RFC 5424 into structured fields for free: .severity, .facility, .appname, .hostname, .procid, .msgid, .message. Firewalls, load balancers, and storage arrays that only speak syslog land in the same pipeline as your containers — one parse-route-deliver path for everything.
http_server — the push door
sources:
  http_in:
    type: http_server
    address: 0.0.0.0:8080
    decoding: { codec: json }     # also: ndjson, bytes
    path: /ingest                 # reject anything else with 404
    auth:
      username: ingest
      password: "${HTTP_INGEST_PASSWORD}"
Anything that can curl can now feed the pipeline — cron jobs, Lambda functions, appliances with webhook exporters. With acknowledgements enabled on the sinks, the HTTP 200 response is only returned once the event is durably accepted, which turns this humble source into a reliable ingestion API. The lab uses it to inject test events.
Two rules of thumb across all sources. First, decode as early as possible — set decoding.codec: json on sources that receive JSON rather than parsing in VRL later; it is faster and centralises failure handling. Second, every source that supports checkpointing needs a persistent data_dir — that is the difference between at-least-once delivery and rereading the world after every restart.
VRL: parse, normalize, enrich, redact
VRL (Vector Remap Language) is where the pipeline earns its keep. It runs inside the remap transform, compiles at startup, and is deliberately constrained: no network calls, no unbounded loops, every fallible operation forced to handle its error. The result is a transform layer that is fast (compiled, not interpreted per-line like grok) and cannot crash on bad input unless you explicitly tell it to.
The function families you will actually use:
| Family | Key functions | What they do |
|---|---|---|
| Parsing | parse_json, parse_syslog, parse_apache_log, parse_nginx_log, parse_common_log, parse_logfmt, parse_key_value, parse_regex, parse_csv, parse_url, parse_user_agent, parse_grok |
Bytes/strings → structured fields |
| Type coercion | to_string, to_int, to_float, to_bool, parse_timestamp, format_timestamp |
Force types before sinks that care (ES mappings, ClickHouse columns) |
| Type guards | string!, object!, is_string, exists, is_nullish |
Assert/inspect types; the ! variants abort the expression on mismatch |
| Path & shape | .field = value, del(.field), merge(., other), flatten, compact |
Restructure the event |
| Strings | downcase, upcase, replace, split, join, truncate, starts_with, contains, strip_whitespace |
Normalization |
| Redaction & hashing | redact, replace (regex), sha2, sha3, md5, encrypt |
PII hygiene before fan-out |
| Enrichment | get_enrichment_table_record, find_enrichment_table_records |
Join against CSV/memory enrichment_tables |
| Flow control | if/else, abort |
Conditional logic; drop the event |
Error handling — the part everyone gets wrong first
VRL functions are fallible or infallible, and the compiler refuses configs that ignore a fallible result. You have exactly three tools:
| Pattern | Syntax | Behaviour on failure | Use when |
|---|---|---|---|
| Capture the error | parsed, err = parse_json(.message) |
err is non-null; you branch on it |
Default. Bad input is expected and handled |
| Coalesce | .level = .level ?? "info" |
Falls through to the right-hand value | Missing/null fields with a sensible default |
| Assert (bang) | parse_json!(.message) |
The event errors out of the transform | Only when upstream guarantees the shape |
The critical operational detail: when a bang-form fails at runtime, the event is not silently eaten — the remap transform logs an error and, depending on drop_on_error, either passes the event through unmodified or drops it. Set drop_on_error: true with reroute_dropped: true and failed events flow out of a <transform>.dropped named output you can wire to a dead-letter sink (S3 is perfect). Nothing vanishes; everything is accounted for.
The production parse-normalize-redact chain
This is the aggregator’s real VRL, annotated. It handles JSON apps, plain-text apps, five spellings of “severity”, junk timestamps, health-check noise, and PII — because production traffic contains all of those simultaneously:
transforms:
  parse:
    type: remap
    inputs: [from_agents]
    drop_on_error: false            # never lose an event to a parse bug
    source: |
      # 1. Try JSON; fall back to keeping the raw line.
      parsed, err = parse_json(string!(.message))
      if err == null {
        . = merge!(., object!(parsed))
        .format = "json"
      } else {
        .format = "raw"
      }

      # 2. Normalize severity: every team spells it differently.
      .level = downcase(to_string(.level ?? .severity ?? .lvl ?? .loglevel ?? "info") ?? "info")
      if includes(["warning"], .level) { .level = "warn" }
      if includes(["err", "fatal", "critical"], .level) { .level = "error" }

      # 3. Coerce the timestamp; junk or missing → ingest time.
      .timestamp = parse_timestamp(to_string(.ts ?? .time ?? .timestamp ?? "") ?? "", format: "%+") ?? now()
      del(.ts); del(.time)

      # 4. Kill zero-value noise before it costs anything.
      if contains(string!(.message), "GET /healthz") ||
         contains(string!(.message), "kube-probe") { abort }

  enrich_redact:
    type: remap
    inputs: [parse]
    source: |
      # Identity stamps every routing decision can rely on.
      .env      = "prod"
      .cluster  = get_env_var("CLUSTER_NAME") ?? "unknown"
      .service  = .kubernetes.pod_labels.app ?? .appname ?? "unlabelled"

      # PII redaction BEFORE any sink sees the event.
      .message = replace(string!(.message), r'[\w.+-]+@[\w-]+\.[\w.-]+', "[email]")
      .message = replace(.message, r'\b(?:\d[ -]*?){13,16}\b', "[pan]")
      if exists(.user.email) { .user.email_hash = sha2(string!(.user.email)); del(.user.email) }

      # Cheap routing signals computed once, used by the router.
      .is_audit  = exists(.audit) || starts_with(string!(.logger ?? ""), "audit")
      .is_metric = exists(.metric_name)
Every choice here is defensive: parse_json with a captured err means a malformed line stays a raw string instead of erroring; ?? chains give every field a typed default; abort on health checks is routinely the single highest-leverage cost cut in the whole pipeline (a 50-node cluster emits millions of probe lines a day); hashing the email instead of deleting it keeps events joinable without keeping the PII.
For lookup-style enrichment — mapping a service to a team, an IP range to a site — use enrichment tables instead of giant if-chains: declare a CSV under top-level enrichment_tables: and call get_enrichment_table_record("owners", { "service": .service }) in VRL. The table loads into memory at boot and reloads on config reload.
Prototype interactively before you commit: vector vrl starts a REPL where you paste an event and iterate on expressions live — far faster than redeploying a ConfigMap to find out .pod_labels was actually .kubernetes.pod_labels.
Routing and volume shaping: route, filter, sample, throttle
Transforms beyond remap are the traffic-engineering layer:
| Transform | What it does | Key options | Typical job |
|---|---|---|---|
route |
Copies each event to every named output whose condition matches | route.<name>: <condition>, reroute_unmatched |
Multi-sink fan-out — the centrepiece |
exclusive_route |
First-match-wins routing (event goes to exactly one output) | ordered routes: [{name, condition}] |
Mutually exclusive destinations |
filter |
Drops events not matching a condition | condition |
Hard gates (drop debug in prod) |
sample |
Keeps 1 in N, with an exemption condition | rate, exclude, key_field |
Access-log volume control |
throttle |
Rate-limits events per key per window | threshold, window_secs, key_field |
One chatty pod can’t drown the pipeline |
dedupe |
Drops exact repeats within a cache window | fields.match, cache.num_events |
Crash-loop spam suppression |
reduce |
Merges related events into one | group_by, merge_strategies, ends_when |
Multi-line/transaction collapsing at the aggregator |
The route transform — read this twice
route evaluates every condition independently and sends a copy of the event to every output that matches. It is fan-out, not switch/case:
transforms:
  router:
    type: route
    inputs: [enrich_redact]
    reroute_unmatched: true        # events matching nothing exit via router._unmatched
    route:
      archive: "true"                                            # literal true: EVERYTHING
      searchable: '.level == "error" || .level == "warn" || .is_audit == true'
      metrics_shaped: '.is_metric == true'
      security: '.service == "falcon-sensor" || .is_audit == true'
The semantics that matter:
| Behaviour | Detail | Consequence |
|---|---|---|
| Multi-match | An error event with is_audit matches archive, searchable, and security — three copies |
Sinks receive independent copies; total egress > total ingest, by design |
| Named outputs | Downstream components consume router.archive, router.searchable, etc. |
A sink wired to plain router is a config error vector validate catches |
_unmatched |
With reroute_unmatched: true, non-matching events exit via router._unmatched |
Wire it to the archive or a dead-letter sink — otherwise unmatched events are dropped |
| Conditions are VRL | Full VRL boolean expressions, compiled once | Push expensive computation into remap earlier; keep conditions to field checks |
| Need one-of routing? | Use exclusive_route (first matching route wins) |
Cleaner than writing mutually exclusive conditions by hand |
The catch-all archive: "true" plus _unmatched wired somewhere is the belt-and-braces guarantee that no event class you forgot about silently disappears — the number-one silent failure in hand-rolled routing.
Volume shaping before the expensive sinks
  sample_access:
    type: sample
    inputs: [parse]                 # sample BEFORE enrichment work you'd waste
    rate: 10                        # keep 1 in 10...
    exclude: '.level == "error" || .level == "warn" || .is_audit == true'   # ...never these

  throttle_noisy:
    type: throttle
    inputs: [sample_access]
    threshold: 1000                 # events per window
    window_secs: 1
    key_field: "{{ service }}"      # per-service budget — one bad pod can't drown the rest
Order matters and is a real design decision: sample after parsing (you need .level to exempt errors) but before heavy enrichment (why enrich events you are about to throw away). The general rule — cheapen the stream as early as possible, enrich as late as necessary.
Sinks: Loki, S3, Elasticsearch, Datadog, ClickHouse
Sinks own batching, encoding, retries, and auth. The five you will actually deploy:
| Sink | Best for | Batching model | Auth | The gotcha |
|---|---|---|---|---|
loki |
Dashboard/grep logs, cheap retention | Streams by label set; snappy-compressed push | Basic/bearer, tenant_id for multi-tenant |
Label cardinality — templates on high-cardinality fields melt Loki |
aws_s3 |
Compliance archive, replay source | Large objects (MBs) on size/time triggers | IAM (IRSA/instance profile) or keys; custom endpoint for MinIO/GCS-interop |
Small batches = millions of tiny objects = PUT-request bill |
elasticsearch |
Full-text search, Kibana | _bulk API; mode: bulk or data_stream |
Basic, AWS SigV4 (OpenSearch) | Index template/ILM is your job; daily indices via bulk.index template |
datadog_logs |
SaaS, zero-ops search | Compressed HTTP to intake | default_api_key, site |
Reserved attributes (service, status, ddtags) drive facets — map them in VRL |
clickhouse |
High-volume structured analytics, SQL | HTTP inserts, JSONEachRow |
Basic over HTTP :8123 | Insert in big batches; columns must exist — skip_unknown_fields saves you |
And the supporting cast you will use around them: console (debugging), prometheus_exporter (self-metrics), kafka (hand-off to streaming), vector (tier-to-tier), blackhole (load tests).
The three production sinks, fully wired
sinks:
  loki:
    type: loki
    inputs: [router.metrics_shaped]
    endpoint: https://loki.internal:3100
    auth: { strategy: basic, user: vector, password: "${LOKI_PASSWORD}" }
    encoding: { codec: json }
    labels:                        # KEEP THIS SET SMALL AND STABLE
      app: "{{ service }}"
      level: "{{ level }}"
      cluster: "{{ cluster }}"
    out_of_order_action: accept    # Loki ≥2.4 accepts out-of-order within the window
    batch: { max_bytes: 1048576, timeout_secs: 5 }
    buffer: { type: disk, max_size: 536870912 }              # 512 MiB

  s3_archive:
    type: aws_s3
    inputs: [router.archive, router._unmatched]              # catch-all + unmatched
    bucket: kv-logs-archive-prod
    region: ap-south-1
    key_prefix: "year=%Y/month=%m/day=%d/cluster={{ cluster }}/"   # Athena-partition friendly
    compression: gzip
    encoding: { codec: json }
    framing: { method: newline_delimited }                   # NDJSON objects
    storage_class: STANDARD_IA
    batch: { max_bytes: 67108864, timeout_secs: 300 }        # 64 MiB or 5 min
    buffer: { type: disk, max_size: 2147483648 }             # 2 GiB — the never-drop sink

  elasticsearch:
    type: elasticsearch
    inputs: [router.searchable, router.security]
    endpoints: ["https://es.internal:9200"]
    auth: { strategy: basic, user: vector, password: "${ES_VECTOR_PW}" }
    mode: bulk
    bulk: { index: "logs-app-%Y.%m.%d" }                     # daily indices for ILM
    request: { concurrency: adaptive }                       # ARC backs off when ES slows
    batch: { max_bytes: 10485760, timeout_secs: 10 }
    buffer:
      type: disk
      max_size: 1073741824                                   # 1 GiB
      when_full: block                                       # backpressure, don't drop
Three deliberate decisions to steal. request.concurrency: adaptive enables adaptive request concurrency — Vector probes how much parallelism the sink can take and backs off on rising latency/429s, which is why Vector does not tip over a struggling ES the way naive shippers do. key_prefix with strftime + templates makes the S3 layout partition-pruned for Athena/Trino from day one — retrofitting partitioning onto a flat bucket is miserable. router._unmatched into the archive means a typo in a route condition degrades to “everything still archived” instead of “events vanished”.
The Datadog and ClickHouse patterns, for when those are your destinations:
  datadog:
    type: datadog_logs
    inputs: [router.searchable]
    default_api_key: "${DD_API_KEY}"
    site: datadoghq.com            # or datadoghq.eu, us3.datadoghq.com...
    compression: gzip

  clickhouse:
    type: clickhouse
    inputs: [router.archive]
    endpoint: http://clickhouse.internal:8123
    database: logs
    table: events
    skip_unknown_fields: true      # don't fail inserts on extra fields
    date_time_best_effort: true
    batch: { max_bytes: 10485760, timeout_secs: 10 }
    buffer: { type: disk, max_size: 1073741824 }
For Datadog, map .service, .status and .ddtags in VRL before the sink — those reserved attributes drive Datadog’s facets and pipelines. For ClickHouse, create the target table (with a DateTime column and low-cardinality codecs) before pointing Vector at it, and keep batches big — ClickHouse hates many small inserts.
Buffering, backpressure, and acknowledgements
This is the section that decides whether you get paged. Every sink has a buffer; the buffer type and full-behaviour define what happens when a destination slows or dies.
| Buffer setting | Values | Default | Trade-off |
|---|---|---|---|
buffer.type |
memory, disk |
memory |
Memory: fastest, lost on restart, bounded by RAM. Disk: survives restarts, costs IOPS (fsync), bounded by max_size |
buffer.max_events (memory) |
integer | 500 | Small by design — memory buffers are shock absorbers, not queues |
buffer.max_size (disk) |
bytes | — | Sized to outage budget: ingest_rate × tolerable_outage |
buffer.when_full |
block, drop_newest |
block |
block propagates backpressure upstream; drop_newest sheds load but loses data |
The mechanics, end to end: when Elasticsearch slows, its sink’s in-flight requests rise until adaptive concurrency backs off; batches queue in the ES disk buffer; when that buffer fills with when_full: block, the sink stops taking events from the router; the router stops taking from the transforms; the aggregator’s vector source applies backpressure to the agents; the agents’ own disk buffers absorb the slack on-node. Loki and S3, with their own healthy buffers, never notice. That chain — pressure flowing upstream hop by hop while healthy paths flow freely — is the entire argument for per-sink buffers.
Sizing is arithmetic, not vibes. At 20 MiB/s aggregate ingest with a 30-minute Elasticsearch outage budget, the ES buffers across the aggregator tier must hold 20 × 60 × 30 = 36,000 MiB ≈ 36 GiB — so with three aggregators, a 12 GiB PVC-backed buffer each, plus headroom. The agents’ buffers then only need to cover an aggregator outage (minutes, because it is yours to fix and horizontally scaled), not a sink outage.
End-to-end acknowledgements close the last gap. With acknowledgements.enabled: true on a sink, the source that produced an event only checkpoints (file/kubernetes_logs), commits offsets (kafka), deletes the SQS message (aws_s3), or returns HTTP 200 (http_server) after every sink the event fans out to has durably accepted it:
acknowledgements:
  enabled: true          # global; sinks can override individually
| Scenario | Without acks | With acks |
|---|---|---|
| Vector pod OOM-killed with events in a memory buffer | Events gone; source already checkpointed past them | Source never checkpointed; events re-read on restart (at-least-once) |
| Disk buffer write succeeds, sink delivery pending, pod restarts | Delivered from disk buffer after restart | Same, plus source-side guarantee |
| Sink rejects a batch permanently (400) | Events dropped after retries, silently unless you watch metrics | Same drop, but surfaced through ack failure — monitor component_discarded_events_total |
| Downstream Kafka sink | Offsets committed on read → loss window | Offsets committed on delivery → clean replay |
Two honest caveats. Acks buy at-least-once, not exactly-once — after a crash you will occasionally deliver duplicates, so make Elasticsearch writes idempotent where it matters (set id_key to a ULID you mint in VRL). And a source held un-acked for too long (sink down, buffer full, block) eventually stalls intake — which is correct behaviour, but means your buffer sizing is your availability story. Write it down as a budget, like an SLO.
Testing and monitoring the pipeline itself
A pipeline that transforms and drops data is production code and gets production discipline: unit tests, CI validation, and its own telemetry.
Unit tests for VRL — vector test
Tests live in the config (or a separate file merged at test time). Each test injects a synthetic event at a component and asserts on what comes out:
tests:
  - name: healthz lines are dropped
    inputs:
      - insert_at: parse
        type: log
        log_fields:
          message: '10.0.0.1 - - [10/Jun/2026:10:00:00 +0000] "GET /healthz HTTP/1.1" 200 2'
    outputs: []                    # nothing may come out — the event must abort

  - name: emails are redacted and level normalised
    inputs:
      - insert_at: parse
        type: log
        log_fields:
          message: '{"lvl":"WARNING","msg":"login failed for vinod@example.com"}'
    outputs:
      - extract_from: enrich_redact
        conditions:
          - type: vrl
            source: |
              assert!(.level == "warn")
              assert!(!contains(string!(.message), "@"))

  - name: errors route to searchable
    inputs:
      - insert_at: router
        type: log
        log_fields: { level: error, service: checkout }
    outputs:
      - extract_from: router.searchable
        conditions:
          - type: vrl
            source: 'assert!(.service == "checkout")'
$ vector test vector.yaml
Running tests
test healthz lines are dropped ... passed
test emails are redacted and level normalised ... passed
test errors route to searchable ... passed
Gate every merge on vector validate (catches syntax, type errors, unknown fields, dangling inputs) and vector test (catches logic). A VRL regression that un-redacts PII or un-routes audit logs is a security incident, not a bug — treat the tests accordingly.
Watching Vector with Vector
sources:
  self:
    type: internal_metrics
sinks:
  prom:
    type: prometheus_exporter
    inputs: [self]
    address: 0.0.0.0:9598
Scrape :9598 with Prometheus/Datadog/Dynatrace and alert on these — each one maps to a specific failure story:
| Metric | Meaning | Alert when | It means |
|---|---|---|---|
vector_component_errors_total |
Errors per component | rate > 0 sustained | A source/transform/sink is failing — check error_type label |
vector_component_discarded_events_total |
Events intentionally/terminally dropped | rate > 0 on non-drop components | Data loss in progress (rejected batches, drop_newest) |
vector_buffer_events / vector_buffer_byte_size |
Current buffer depth per sink | > 70% of max_size |
A sink is slow/down; outage budget being spent |
vector_buffer_discarded_events_total |
Events dropped by a full buffer | > 0 ever | Buffer overflowed with drop_newest — size it up |
vector_component_received_events_total vs vector_component_sent_events_total |
In/out per component | in ≫ out unexpectedly | A transform is dropping more than intended |
vector_utilization |
Busy fraction per component (0–1) | > 0.9 sustained | That component is the bottleneck — scale or optimise it |
For live debugging, the API you enabled powers two indispensable commands: vector top (htop-for-the-DAG: per-component throughput and errors, live) and vector tap router.searchable (prints a sample of events flowing on any edge — the fastest way to answer “what does the event actually look like right here?”).
Alert routing and on-call wiring for these signals is its own discipline — Set Up Grafana OnCall for Alerting and Rotation Management covers the receiving end.
Vector vs Fluent Bit vs Logstash vs OTel Collector
The honest comparison, because you will be asked in the design review:
| Dimension | Vector | Fluent Bit | Logstash | OTel Collector |
|---|---|---|---|---|
| Language / runtime | Rust, single static binary | C, tiny binary | JRuby on JVM | Go |
| Typical agent footprint | ~30–100 MiB RSS | ~5–20 MiB RSS (smallest) | 500 MiB–1 GiB+ (JVM) | ~50–150 MiB RSS |
| Throughput per core | Very high (routinely tops third-party benchmarks) | High | Lowest of the four | High |
| Transform language | VRL: compiled, typed, unit-testable | Modify/grep filters + Lua | Ruby-ish DSL + grok | OTTL + processors |
| Routing | route/exclusive_route, arbitrary VRL conditions |
Tag/match globbing | if/else in pipeline DSL | Connectors/pipelines per signal |
| Buffering | Per-sink memory/disk + when_full, e2e acks |
Memory + filesystem storage | Persistent queues (per pipeline) | Sending queue + optional persistent queue |
| Unit testing | Native (vector test) |
None built-in | None practical | None built-in |
| Signals | Logs + metrics first-class, traces beta | Logs + metrics (+ traces via OTLP pass-through) | Logs (metrics awkward) | Logs + metrics + traces first-class |
| Ecosystem pull | Datadog-backed, strong log focus | CNCF, ubiquitous as K8s agent | Elastic ecosystem legacy | CNCF, the industry-standard trace path |
| Sweet spot | High-volume log routing/transformation, multi-sink | Ultra-light edge collection | Existing ELK estates | OTel-native org, traces + vendor neutrality |
Pragmatic guidance: if traces are your centre of gravity and the org is OTel-standardised, run the OTel Collector as the spine (see Tail-Based Sampling at Scale with the OpenTelemetry Collector and Load-Balancing Exporter) — possibly with Vector aggregators just for the log firehose. If logs dominate and cost/routing/redaction is the problem — this article’s premise — Vector’s VRL, per-sink buffers, and native tests are the strongest tooling for the job. Fluent Bit agents feeding Vector aggregators is also a legitimate hybrid: tiny C agents, heavy Rust brain. Logstash survives mainly where deep Elastic-ecosystem coupling already exists.
Architecture at a glance
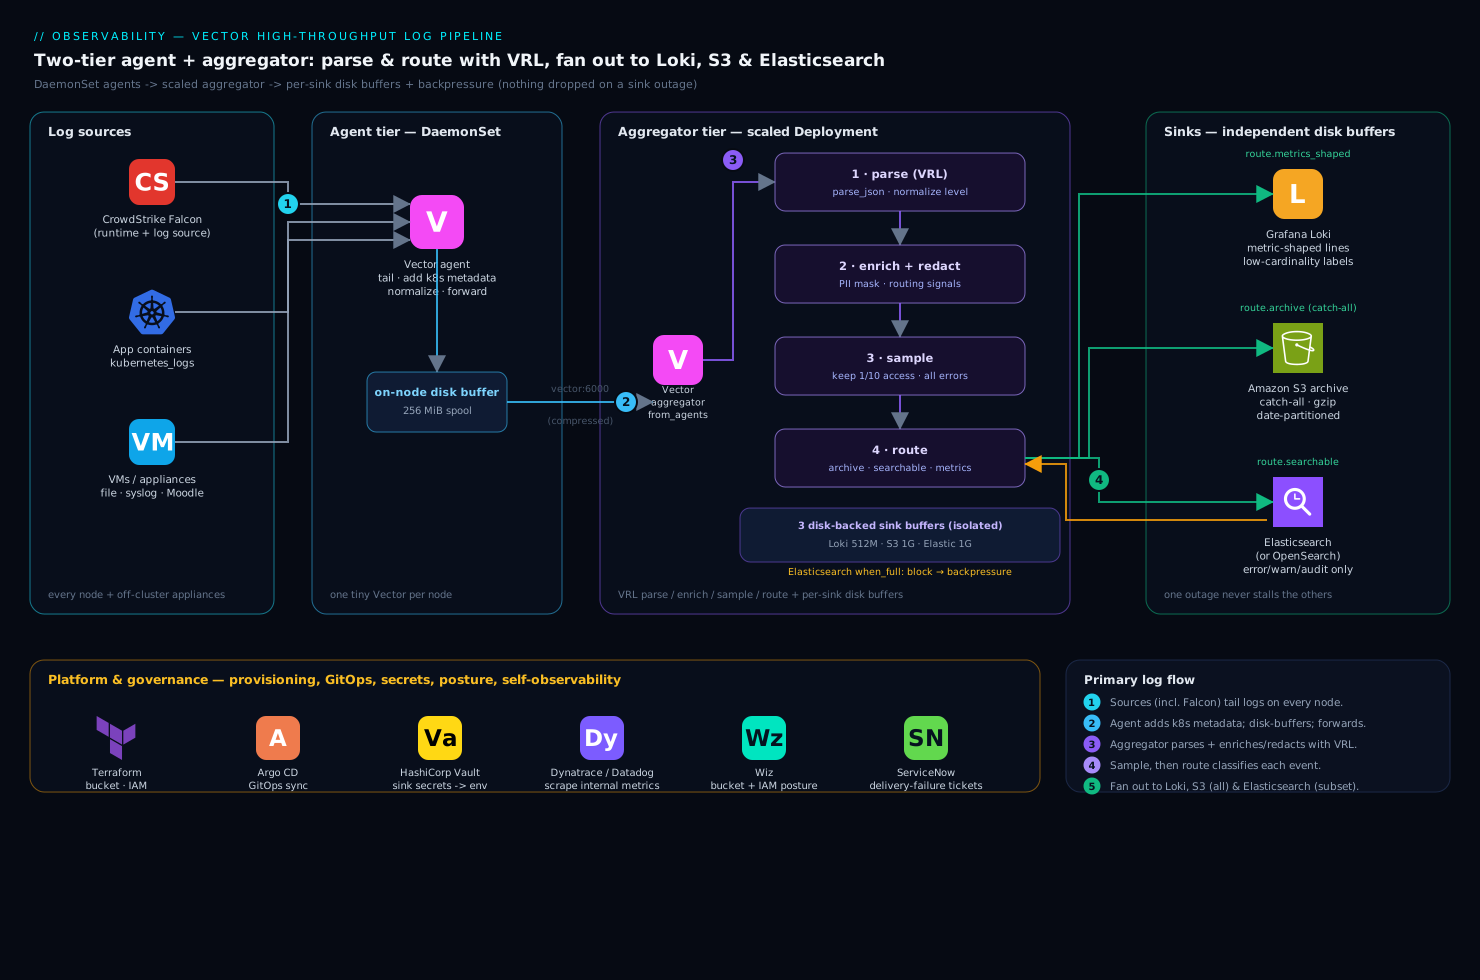
Read the diagram left to right. On every node, a Vector agent (DaemonSet) tails container logs via kubernetes_logs, stamps node/cluster identity, and forwards over the native vector protocol (port 6000, compressed, disk-spooled on-node) to the aggregator StatefulSet behind a Service. Inside the aggregator, the event walks the DAG you built: parse (JSON/fallback, severity and timestamp normalization, health-check abort) → enrich_redact (identity stamps, PII masking, routing signals) → sample/throttle (volume shaping) → router, which fans each event to every matching branch — archive (everything, plus _unmatched) to S3 in gzip NDJSON with Athena-style partitions, searchable (error/warn/audit) to Elasticsearch daily indices, metrics_shaped to Loki with three low-cardinality labels. Each sink has its own disk buffer and when_full: block, so pressure flows upstream per-branch while healthy branches keep draining; end-to-end acks tie sink delivery all the way back to source checkpoints. On the right, internal_metrics exposes the pipeline’s own health on :9598 to Prometheus/Datadog, and secrets flow in as environment variables from Vault — never as literals in the ConfigMap.
Real-world scenario
Meshware, a fictional but representative B2B SaaS on EKS (India + EU regions), ran 240 nodes emitting ~1.4 TB/day of raw logs, all shipped by a hand-tuned Fluentd DaemonSet straight into a managed Elasticsearch cluster. The monthly damage: about $19,500 (₹16.3 lakh) for hot ES ingest/storage, with 7-day retention the teams constantly complained about. Twice in one quarter, an ES ingest slowdown backed up the Fluentd buffers until pods OOM-killed and dropped logs — once during the exact incident the SRE team was debugging.
The platform team deployed the topology from this guide over three sprints. Sprint one: agents (Helm role: Agent, 100m/128Mi per node) forwarding to three aggregators (role: Aggregator, 2 vCPU/2Gi each, 20 GiB PVCs), with a passthrough config shadowing the existing Fluentd — no behaviour change, just proving throughput (peak 41 MiB/s aggregate, aggregator CPU at 55%). Sprint two: the VRL chain and router went live behind vector test (34 unit tests) and vector validate in GitHub Actions, with Argo CD syncing the ConfigMap. Health-check abort alone removed 11% of volume; 1-in-10 sampling of successful access logs removed another 46%; ES now received only error/warn/audit — 8% of original volume — while S3 (gzip, ~9:1 compression on JSON) archived everything for about $700/month including PUT requests, and Loki took the metrics-shaped lines on three labels.
Sprint three was the validation that mattered: they deliberately scaled the ES data tier down during a game day. The ES sink’s buffers climbed to 28 GiB across the tier over 40 minutes, vector top showed Loki and S3 branches unaffected, and on restore the backlog drained in 12 minutes with zero gaps in the S3 partitions (verified by counting events per 5-minute window in Athena). One real mistake surfaced: the first router config had searchable matching on .level == "ERROR" (case not yet normalised at that point in the DAG) — caught not in production but by a failing vector test in CI when an engineer reordered transforms. Final bill: ES shrank to $4,100/month on 30-day retention (better than the old 7), total observability spend down 61%, and the pipeline has survived two sink incidents since with zero data loss.
Advantages and disadvantages
| Advantages | Disadvantages |
|---|---|
| One binary, one config model for logs and metrics; no JVM, no plugin matrix | Younger ecosystem than Fluentd/Logstash; fewer niche integrations |
| VRL: compiled, typed, unit-testable transforms — config that cannot crash on bad input unless told to | VRL is another language for the team to learn; grok muscle memory does not transfer |
Per-sink disk buffers + when_full + e2e acks = engineered, provable loss behaviour |
Disk buffers make aggregators stateful — PVCs, fsync IOPS, capacity planning |
route fan-out with catch-all + _unmatched makes multi-sink cost routing trivial |
Multi-match fan-out multiplies egress; a careless condition doubles a sink’s bill |
| Adaptive request concurrency protects struggling sinks automatically | Traces support still beta — not a full OTel Collector replacement today |
| Rust throughput: fewer aggregator cores per GB/s than JVM alternatives | Datadog stewardship gives some teams governance pause (it is fully open source, MPL-2.0) |
First-class self-telemetry (internal_metrics, vector top, vector tap) |
Two-tier topology is one more platform service to own, patch, and page on |
The disadvantages are real but manageable; the one that bites unprepared teams is statefulness — treat aggregator disks with the same respect as a small database’s.
Hands-on lab: the full multi-sink pipeline on your laptop
This is the centrepiece. You will run the entire topology — Vector, Loki, Elasticsearch, and MinIO standing in for S3 — with Docker Compose, drive it with synthetic traffic plus hand-injected events, prove parsing, redaction, routing and sampling, kill a sink to watch buffering and backpressure do their job, and tear it all down. Everything is free and local; budget 45–60 minutes and ~6 GB RAM.
| Step | What you do | What it proves |
|---|---|---|
| 1–2 | Compose file + sink configs | The destinations exist and are healthy |
| 3 | Write vector.yaml |
The full source→VRL→route→sink DAG |
| 4 | vector validate + vector test |
Config and logic are correct before anything runs |
| 5 | Start and observe with vector top |
Events flow on every branch |
| 6 | Inject known events via http_server |
Parsing, redaction, dropping, routing — per event |
| 7 | Query Loki, ES, MinIO | Each sink got exactly its slice |
| 8 | Stop Elasticsearch mid-stream | Disk buffer absorbs; other sinks unaffected; backlog drains |
| 9 | Teardown | Clean exit |
Step 1 — Project skeleton and Compose file.
mkdir -p ~/vector-lab/{vector,loki} && cd ~/vector-lab
# ~/vector-lab/docker-compose.yml
services:
  loki:
    image: grafana/loki:3.1.0
    command: ["-config.file=/etc/loki/local-config.yaml"]
    ports: ["3100:3100"]

  elasticsearch:
    image: docker.elastic.co/elasticsearch/elasticsearch:8.14.3
    environment:
      - discovery.type=single-node
      - xpack.security.enabled=false        # LAB ONLY — never in production
      - ES_JAVA_OPTS=-Xms1g -Xmx1g
    ports: ["9200:9200"]

  minio:
    image: minio/minio:latest
    command: server /data --console-address ":9001"
    environment:
      - MINIO_ROOT_USER=labadmin
      - MINIO_ROOT_PASSWORD=labsecret123
    ports: ["9000:9000", "9001:9001"]

  createbucket:                             # one-shot: create the archive bucket
    image: minio/mc:latest
    depends_on: [minio]
    entrypoint: >
      /bin/sh -c "sleep 5;
      mc alias set lab http://minio:9000 labadmin labsecret123;
      mc mb -p lab/logs-archive; exit 0"

  vector:
    image: timberio/vector:0.46.1-debian
    depends_on: [loki, elasticsearch, minio]
    volumes:
      - ./vector/vector.yaml:/etc/vector/vector.yaml:ro
      - vector-data:/var/lib/vector         # checkpoints + DISK BUFFERS persist here
    ports:
      - "8080:8080"    # http_server source
      - "8686:8686"    # Vector API (vector top / tap)
      - "9598:9598"    # prometheus_exporter (self-metrics)

volumes:
  vector-data:
Step 2 — Start the sinks first and confirm all three answer:
docker compose up -d loki elasticsearch minio createbucket
curl -s localhost:3100/ready                      # → ready
curl -s localhost:9200/_cluster/health | grep -o '"status":"[a-z]*"'   # → "status":"green" (or yellow)
docker compose run --rm createbucket 2>/dev/null; echo "bucket ok"
Step 3 — The pipeline config. This is a complete, self-contained version of everything in the article — two sources, the VRL chain, sampling, the router, three sinks with disk buffers, self-metrics, and acknowledgements:
# ~/vector-lab/vector/vector.yaml
data_dir: /var/lib/vector
api: { enabled: true, address: 0.0.0.0:8686 }
acknowledgements: { enabled: true }

sources:
  access_logs:                       # synthetic traffic: stands in for the agent fleet
    type: demo_logs
    format: apache_common
    interval: 0.02                   # ~50 events/sec

  http_in:                           # our injection door for known test events
    type: http_server
    address: 0.0.0.0:8080
    decoding: { codec: json }
    path: /ingest

  self:
    type: internal_metrics

transforms:
  parse:
    type: remap
    inputs: [access_logs, http_in]
    source: |
      if !exists(.level) {           # demo_logs lines are raw Apache common format
        parsed, err = parse_apache_log(string!(.message), format: "common")
        if err == null {
          . = merge(., parsed)
          .level = if to_int(.status) ?? 200 >= 500 { "error" } else { "info" }
          .service = "web"
        }
      }
      .level = downcase(to_string(.level ?? "info") ?? "info")
      if includes(["warning"], .level) { .level = "warn" }
      .service = to_string(.service ?? "unlabelled") ?? "unlabelled"
      .timestamp = .timestamp ?? now()
      if contains(string!(.message ?? ""), "/healthz") { abort }

  enrich_redact:
    type: remap
    inputs: [parse]
    source: |
      .env = "lab"
      .cluster = "laptop"
      .message = replace(string!(.message ?? ""), r'[\w.+-]+@[\w-]+\.[\w.-]+', "[email]")
      .is_audit  = exists(.audit)
      .is_metric = exists(.metric_name)

  sample_access:
    type: sample
    inputs: [enrich_redact]
    rate: 10
    exclude: '.level == "error" || .level == "warn" || .is_audit == true || .is_metric == true'

  router:
    type: route
    inputs: [sample_access]
    reroute_unmatched: true
    route:
      archive: "true"
      searchable: '.level == "error" || .level == "warn" || .is_audit == true'
      metrics_shaped: '.is_metric == true'

sinks:
  loki:
    type: loki
    inputs: [router.metrics_shaped]
    endpoint: http://loki:3100
    encoding: { codec: json }
    labels: { app: "{{ service }}", level: "{{ level }}", cluster: "{{ cluster }}" }
    batch: { timeout_secs: 2 }
    buffer: { type: disk, max_size: 268435488 }

  s3_archive:
    type: aws_s3
    inputs: [router.archive, router._unmatched]
    endpoint: http://minio:9000          # MinIO stands in for S3
    bucket: logs-archive
    region: us-east-1
    force_path_style: true
    auth: { access_key_id: labadmin, secret_access_key: labsecret123 }
    key_prefix: "year=%Y/month=%m/day=%d/"
    compression: gzip
    encoding: { codec: json }
    framing: { method: newline_delimited }
    batch: { max_bytes: 1048576, timeout_secs: 30 }   # small/fast for the lab
    buffer: { type: disk, max_size: 268435488 }

  elasticsearch:
    type: elasticsearch
    inputs: [router.searchable]
    endpoints: ["http://elasticsearch:9200"]
    mode: bulk
    bulk: { index: "logs-lab-%Y.%m.%d" }
    batch: { timeout_secs: 5 }
    buffer: { type: disk, max_size: 268435488, when_full: block }

  prom:
    type: prometheus_exporter
    inputs: [self]
    address: 0.0.0.0:9598

tests:
  - name: healthz dropped
    inputs:
      - insert_at: parse
        type: log
        log_fields: { message: 'GET /healthz 200' }
    outputs: []
  - name: email redacted
    inputs:
      - insert_at: enrich_redact
        type: log
        log_fields: { message: "login failed for vinod@example.com", level: warn }
    outputs:
      - extract_from: enrich_redact
        conditions:
          - type: vrl
            source: 'assert!(!contains(string!(.message), "@example.com"))'
  - name: errors reach searchable route
    inputs:
      - insert_at: router
        type: log
        log_fields: { level: error, service: checkout, message: boom }
    outputs:
      - extract_from: router.searchable
        conditions:
          - type: vrl
            source: 'assert!(.level == "error")'
Step 4 — Validate and unit-test before running anything:
docker run --rm -v ~/vector-lab/vector:/etc/vector timberio/vector:0.46.1-debian \
  validate /etc/vector/vector.yaml
# √ Loaded ["/etc/vector/vector.yaml"]
# √ Component configuration
# √ Health check "loki"  ... (health checks may warn until sinks are up — fine)

docker run --rm --network vector-lab_default -v ~/vector-lab/vector:/etc/vector \
  timberio/vector:0.46.1-debian test /etc/vector/vector.yaml
# Running tests
# test healthz dropped ... passed
# test email redacted ... passed
# test errors reach searchable route ... passed
If a test fails, fix the VRL now — this is the whole point of testing before deploying.
Step 5 — Start Vector and watch the DAG:
docker compose up -d vector
docker compose exec vector vector top --url http://127.0.0.1:8686/graphql
vector top shows every component with live in/out rates. Expect access_logs around 50/s, sample_access emitting roughly a tenth of its input (plus exempted events), router.archive matching sample_access output, and elasticsearch receiving only the error slice (~1–2/s from synthetic 5xx lines). Press q to exit.
Step 6 — Inject known events and watch each rule fire:
# a) An error with an email → must be redacted AND reach ES + archive
curl -s -X POST localhost:8080/ingest -H 'Content-Type: application/json' \
  -d '{"level":"ERROR","service":"checkout","message":"payment failed for vinod@example.com order=A123"}'

# b) A metrics-shaped line → must reach Loki (and archive)
curl -s -X POST localhost:8080/ingest -H 'Content-Type: application/json' \
  -d '{"level":"info","service":"checkout","metric_name":"cart_total","value":42,"message":"cart_total=42"}'

# c) A health check → must vanish entirely
curl -s -X POST localhost:8080/ingest -H 'Content-Type: application/json' \
  -d '{"level":"info","service":"web","message":"GET /healthz 200"}'

# d) An audit event → ES + archive even though it is level=info
curl -s -X POST localhost:8080/ingest -H 'Content-Type: application/json' \
  -d '{"level":"info","service":"iam","audit":true,"message":"role admin granted to user 831"}'
Step 7 — Verify every sink got exactly its slice:
# Elasticsearch: the error is there, uppercase level normalised, email GONE
curl -s 'localhost:9200/logs-lab-*/_search?q=service:checkout&size=1&pretty' | grep -E '"level"|"message"'
#   "level" : "error",
#   "message" : "payment failed for [email] order=A123",

# The audit event is there too; the healthz event is NOT:
curl -s 'localhost:9200/logs-lab-*/_search?q=service:iam&size=1&pretty' | grep '"audit"'
curl -s 'localhost:9200/logs-lab-*/_count?q=message:healthz' | grep -o '"count":[0-9]*'   # → "count":0

# Loki: only the metrics-shaped stream, with our three labels
curl -s -G 'http://localhost:3100/loki/api/v1/query_range' \
  --data-urlencode 'query={app="checkout"}' | grep -o 'cart_total=42'   # → cart_total=42

# MinIO/S3: partitioned, gzip NDJSON, contains EVERYTHING (wait ~30 s for the batch timeout)
docker compose exec minio mc ls -r lab/logs-archive/ | head -3
# [2026-06-10 10:12:31 UTC]  41KiB ... year=2026/month=06/day=10/1718014351-<uuid>.log.gz
docker compose exec minio sh -c \
  "mc cat lab/logs-archive/\$(mc ls -r --json lab/logs-archive/ | head -1 | sed 's/.*\"key\":\"//;s/\".*//') | gunzip | grep -c '\"service\"'"
The acceptance criteria in one table — check every row before calling it done:
| Check | Where | Expected |
|---|---|---|
| Error event searchable | ES _search |
Present, level:error, email replaced by [email] |
| Audit event searchable | ES _search |
Present despite level:info |
| Healthz anywhere | ES _count, archive grep |
Zero — dropped by abort |
| Metrics line in Loki | query_range {app="checkout"} |
One stream, labels only app,level,cluster |
| Archive completeness | MinIO object grep | Contains error, metric, audit AND sampled access lines |
| Sampling working | vector top |
sample_access out ≈ 10–15% of in |
Step 8 — The failure drill (the test that proves the design). Kill Elasticsearch and keep injecting:
docker compose stop elasticsearch
for i in $(seq 1 50); do curl -s -X POST localhost:8080/ingest \
  -H 'Content-Type: application/json' \
  -d "{\"level\":\"error\",\"service\":\"drill\",\"message\":\"outage event $i\"}"; done

# Buffer depth climbing for the ES sink, Loki/S3 untouched:
curl -s localhost:9598/metrics | grep 'buffer_events{' | grep elasticsearch
# vector_buffer_events{component_id="elasticsearch",...} 50
docker compose exec minio mc ls -r lab/logs-archive/ | tail -2    # archive still growing

docker compose start elasticsearch && sleep 30
curl -s 'localhost:9200/logs-lab-*/_count?q=service:drill' | grep -o '"count":[0-9]*'
# → "count":50   ← every event delivered after the outage; zero lost
While ES was down, vector top showed the elasticsearch component erroring and retrying, buffer metrics climbing, and both other branches flowing — per-sink isolation, observed live. Because the buffer is disk-backed on the vector-data volume, you can even docker compose restart vector mid-outage and the backlog survives.
Step 9 — Teardown:
docker compose down -v          # -v removes the MinIO data and Vector buffer volumes
rm -rf ~/vector-lab             # optional: remove the lab entirely
To promote this to Kubernetes, the config is unchanged in substance: helm repo add vector https://helm.vector.dev, install role: Agent with a kubernetes_logs source and a vector sink, install role: Aggregator with this lab’s transforms/sinks (swap demo_logs/http_server for a vector source on :6000), put the sink credentials in env vars sourced from your secrets manager (see Set Up External Secrets Operator to Sync Vault and AWS Secrets into Kubernetes), and let Argo CD sync it with vector validate + vector test gating the merge.
Common mistakes & troubleshooting
The playbook — symptom first, because that is what you see at 3 a.m.:
| # | Symptom | Root cause | Confirm | Fix |
|---|---|---|---|---|
| 1 | Events silently missing from every sink | Route conditions don’t cover them and _unmatched is unwired |
vector tap router._unmatched shows the missing events |
Wire router._unmatched to the archive; keep the archive: "true" catch-all |
| 2 | Vector won’t start: “error … this expression is fallible … handle the error” | Unhandled fallible VRL expression | vector validate prints the exact line and caret |
Capture err, add ?? default, or use ! deliberately |
| 3 | Transform passing events through unparsed | Bang-form failed with drop_on_error: false (default pass-through) |
vector_component_errors_total{component_id="parse"} rising; vector tap parse shows raw events |
Guard with captured err; optionally drop_on_error: true + reroute_dropped: true to a dead-letter sink |
| 4 | Loki ingester OOM / “maximum active streams” errors | High-cardinality label template (request_id, pod_ip) in the Loki sink |
Loki /metrics stream count exploding; sink 429/500 responses |
Cut labels to a stable set (app, level, cluster); everything else stays in the body |
| 5 | Agent nodes re-read entire log history after restart | data_dir not persisted, checkpoints lost |
Duplicate events with old timestamps flooding sinks after each rollout | Mount a persistent volume/hostPath for data_dir |
| 6 | Millions of tiny S3 objects; PUT costs exceed storage | batch.timeout_secs/max_bytes too small on aws_s3 |
mc ls/aws s3 ls shows KB-sized objects every few seconds |
Raise batch to tens of MiB / 300 s; check request count in cost explorer |
| 7 | ES sink drops batches with 400s | Mapping conflict — a field changes type between events (.status int vs string) |
vector_component_discarded_events_total for the sink > 0; ES logs mapper_parsing_exception |
Coerce types in VRL (to_int!), pin an index template, consider data_stream mode |
| 8 | All sinks stall together despite per-sink buffers | One sink at when_full: block with a full buffer, upstream is a shared transform |
vector_buffer_events at max for one sink; vector_utilization ≈ 1 on the router |
Size that buffer for the outage budget, or accept loss there with drop_newest — blocking is upstream-global once the buffer is full |
| 9 | Aggregator pods CrashLoop after config change | Bad config shipped without validation | Pod logs show the validate error at boot | Gate CI on vector validate + vector test; Argo CD rollback |
| 10 | Memory climbing until OOM on aggregators | Memory buffers on high-volume sinks, or a reduce/dedupe cache unbounded |
vector_buffer_byte_size (memory type) growing; heap tracks buffer totals |
Move big sinks to disk buffers; bound dedupe cache; check expire_after_ms on reduce |
| 11 | Events duplicated in Elasticsearch after a crash | At-least-once redelivery (acks) without idempotent writes | Duplicate _ids absent — docs identical but two _ids |
Mint a ULID in VRL, set sink id_key so replays overwrite instead of duplicate |
| 12 | Syslog devices’ events truncated or merged | UDP datagrams > max_length, or devices sending RFC 3164 to a 5424-strict parser |
vector tap on the syslog source shows mangled .message |
Raise max_length; prefer mode: tcp; parse leniently with parse_syslog in VRL |
| 13 | vector top shows a component at utilization ≈ 1.00 and lag building |
That component is the DAG bottleneck (usually a regex-heavy remap) | vector_utilization metric per component |
Optimise the VRL (anchor regexes, parse once), or scale aggregator replicas |
| 14 | Loki rejects with entry too far behind |
Out-of-order writes beyond Loki’s window | Loki 400 responses in sink errors | out_of_order_action: accept (Loki ≥ 2.4) and coerce timestamps in VRL |
Best practices
- Keep agents dumb, aggregators smart. Agents tail, tag, forward. Every parse rule you push to the DaemonSet becomes a fleet-wide rollout.
- Always ship a catch-all.
archive: "true"plusrouter._unmatchedinto S3. Routing bugs then degrade to “still archived”, never to silent loss. - Guard every fallible VRL call. Captured
error??by default; bang-forms only withreroute_dropped: trueand a dead-letter sink watching. - Unit-test the security-relevant VRL. Redaction and audit-routing rules get
vector testcases in CI; a regression there is an incident. - Disk buffers on every production sink, sized as a budget.
ingest_rate × tolerable_outage, written down. Memory buffers are forconsoleand labs. - Enable end-to-end acknowledgements wherever the source supports it — it converts “probably delivered” into checkpoint-backed at-least-once.
- Idempotency at ES/ClickHouse: mint event ULIDs in VRL and set
id_key, because at-least-once will replay. - Low-cardinality Loki labels only — app, level, cluster, maybe namespace. IDs live in the log body, found by filter not by label.
request.concurrency: adaptiveon HTTP-based sinks; let Vector discover what the destination can take.- Drop and sample as early as the fields allow.
aborthealth checks at parse; sample before enrichment; throttle per-service so one bad pod cannot drown the tier. - Watch Vector with Vector, and alert on the four killers: component errors, discarded events, buffer depth > 70%, utilization ≈ 1.0.
- GitOps the config:
vector validate+vector testin CI, Argo CD sync, rollback = revert. Nobody edits a ConfigMap by hand.
Security notes
The pipeline touches every log line in the company, which makes it both a control point and a target. Least privilege per sink: the S3 IAM policy is s3:PutObject-only on the archive prefix (no read, no delete — the pipeline cannot exfiltrate or destroy its own audit trail), the Elasticsearch role can write only logs-* indices, the Loki token is tenant-scoped. Secrets never enter the config: Vector interpolates ${VAR} from the environment; inject env vars from Vault or External Secrets Operator, keep the ConfigMap free of literals, and rotate by restarting the tier. Redact before fan-out: the enrich_redact transform is the single choke point where emails, PANs and tokens are masked or hashed — placing it before the router guarantees no sink, including future ones, receives raw PII; hash (sha2) rather than delete when you need joinability. Encrypt transport and rest: TLS on the vector source/sink between tiers and on every sink endpoint; SSE-KMS plus Block Public Access on the archive bucket. Protect the pipeline’s own surface: the API on :8686 and the http_server source are unauthenticated-by-default doors — bind the API to localhost, put auth on http_server, and NetworkPolicy the aggregator so only agents and scrapers reach it. Finally, remember the archive bucket is your forensic record: object lock/versioning on it is what makes the log trail tamper-evident, not just cheap.
Cost & sizing
Vector itself is free (MPL-2.0); you pay for aggregator compute, buffer storage, and — dominating everything — what the sinks charge for what you let through. That is why routing is the cost model:
| Cost driver | Lever in this pipeline | Typical effect |
|---|---|---|
| ES/Datadog ingest per GB | Route only error/warn/audit (searchable) |
Often 80–95% index-volume reduction |
| Health-check/probe noise | abort in parse |
5–15% of raw volume gone for free |
| Access-log volume | sample rate 10 with error exemption |
~45–50% of raw volume |
| Archive storage | S3 + gzip (~8–10:1 on JSON) + IA/Glacier lifecycle | Full copy for a few % of ES cost |
| S3 request charges | Big batches (max_bytes 64 MiB / 300 s) |
PUTs drop from millions to thousands |
| Aggregator compute | VRL efficiency, replicas | See sizing below |
| Cross-AZ/egress traffic | Compression on vector transport; zone-aware topology |
Often overlooked; can rival compute cost |
Sizing the aggregator tier: start from measured throughput, not node count. A remap-heavy pipeline comfortably processes on the order of 5–15 MiB/s per vCPU (regex-light VRL trends higher; pathological regexes lower — measure with vector_utilization). A working starting point:
| Aggregate log rate | Aggregators | Per-pod resources | Per-pod buffer PVC (30-min ES budget) |
|---|---|---|---|
| ≤ 5 MiB/s | 2 (HA floor) | 1 vCPU / 1 Gi | 10 Gi |
| ~20 MiB/s | 3 | 2 vCPU / 2 Gi | 15 Gi |
| ~50 MiB/s | 5–6 | 4 vCPU / 4 Gi | 25 Gi |
Rupee-terms illustration at ~1 TB/day raw: hot Elasticsearch for everything runs into lakhs per month, while this topology’s marginal cost is three-ish aggregator pods (a few thousand rupees on spot/committed instances), ~₹6,000–9,000/month of S3 with lifecycle tiering for the complete archive, and an ES cluster a tenth the size. Agents are effectively free — 100m CPU on nodes you already pay for. Track the split with per-sink vector_component_sent_bytes_total and tune the sample rate against the actual bill, not a guess.
Interview & exam questions
Q1. Describe Vector’s component model.
A Vector config is a DAG of named components: sources produce events, transforms consume and re-emit them, sinks deliver them. Every transform/sink declares its upstreams in inputs. Some components expose named outputs (route.<name>, route._unmatched, remap.dropped) that downstream components address explicitly. Cycles are rejected at validation.
Q2. Agent vs aggregator — why run both? Agents (DaemonSet/systemd) are thin: tail, tag, forward, small on-node spool. Aggregators (StatefulSet with PVCs) centralise the CPU-heavy VRL, routing, sink credentials, and large disk buffers. The tiers have opposite resource profiles and change cadences: parse rules change weekly and roll one tier, not every node; sink credentials live in one place; a VRL hot loop cannot steal workload CPU fleet-wide.
Q3. How does VRL prevent the classic “one bad line kills the shipper” failure?
VRL compiles at startup and the compiler rejects any unhandled fallible expression. At runtime you either captured the error (parsed, err = parse_json(...)), coalesced it (??), or asserted with ! — and asserted failures pass through or reroute to a .dropped output per drop_on_error/reroute_dropped, never crashing the process.
Q4. What are the route transform’s semantics when multiple conditions match?
route evaluates every condition independently and sends a copy of the event to every matching named output — fan-out, not switch/case. Unmatched events exit via _unmatched when reroute_unmatched: true. For first-match-wins semantics use exclusive_route.
Q5. Walk through what happens when Elasticsearch goes down for 20 minutes.
The ES sink’s requests fail and retry with backoff; adaptive concurrency collapses; batches accumulate in the ES sink’s disk buffer. Loki and S3, with separate buffers, flow normally. If the ES buffer fills and when_full: block, backpressure propagates upstream — ultimately to agents’ on-node spools and, with acks, to source checkpoints. When ES returns, the buffer drains; nothing was lost provided the outage fit the buffer budget.
Q6. What do end-to-end acknowledgements actually change?
Sources defer their durability action — file/kubernetes_logs checkpoints, Kafka offset commits, SQS deletes, HTTP 200s — until all connected sinks durably accept the event. Guarantees become at-least-once across restarts and crashes; the trade is possible duplicates (handle with id_key idempotency) and intake stalls when buffers fill.
Q7. Memory vs disk buffers — when is memory acceptable?
Memory (default, 500 events) is fine for dev, console, and loss-tolerant telemetry. Any production sink whose data you would page over needs type: disk, sized to ingest_rate × tolerable_outage, on persistent storage — which is why the Helm Aggregator role is a StatefulSet.
Q8. How do you keep the Loki sink from melting Loki?
Label discipline: template only low-cardinality, stable fields (app, level, cluster) in labels; never request IDs, user IDs, or pod IPs. Each unique label combination is a stream; cardinality explosion OOMs ingesters. Coerce timestamps in VRL and set out_of_order_action: accept for Loki ≥ 2.4.
Q9. How do you test a Vector pipeline before deploying?
Three layers: vector validate (syntax, types, dangling inputs) in CI; vector test running config-embedded unit tests that inject events at a component and assert VRL conditions on named outputs; and vector tap/vector top against a running instance for live verification. Redaction and routing rules get mandatory unit tests.
Q10. Vector vs Fluent Bit vs Logstash in one minute. Fluent Bit: smallest footprint C agent, ideal edge collector, limited transform depth. Logstash: JVM, heaviest, grok-based, lives on in Elastic estates. Vector: Rust throughput, compiled/testable VRL, per-sink disk buffers with e2e acks, first-class multi-sink routing — the strongest choice when log cost-routing and transformation is the core problem. Hybrid Fluent Bit agents → Vector aggregators is legitimate.
Q11. Where does redaction belong in the DAG, and why? In a remap before the router (and before any sink). One choke point guarantees every current and future sink receives sanitised events; hashing instead of deleting preserves joinability. Post-router redaction must be duplicated per branch and will be forgotten on the next sink.
Q12. How do you detect that Vector itself is the bottleneck?
vector_utilization per component near 1.0 identifies the hot component; vector top shows where in/out rates diverge; buffer metrics show which sink is backing up. Fix the VRL (anchored regexes, parse once, drop early) or scale aggregator replicas horizontally.
Quick check
- An event has
level=errorandis_audit=true. With routesarchive: "true",searchable: error/warn/audit,security: audit— how many copies leave the router? - Which config line makes a source re-read all files from the beginning after every container restart if you forget it?
- Your S3 bill shows massive PUT-request charges. Which two sink settings do you change?
vector validatefails with “this expression is fallible”. What are your three fixes?- During an ES outage, which metric tells you how much outage budget remains?
Answers
- Three — one per matching route (
archive,searchable,security). Route is fan-out; every matching condition gets a copy. - A persistent
data_dir— without it, checkpoints are lost andread_from: beginningre-ingests history (duplicate storm). batch.max_bytesandbatch.timeout_secson theaws_s3sink — bigger, less frequent objects (e.g. 64 MiB / 300 s).- Capture the error (
result, err = ...), coalesce with??, or assert with the!variant (acceptingdrop_on_errorsemantics). vector_buffer_events/vector_buffer_byte_sizefor the ES sink versus itsmax_size— depth ÷ ingest rate = minutes left.
Glossary
- Vector — Rust-based open-source observability pipeline (sources → transforms → sinks) originally from Timber, now stewarded by Datadog.
- VRL (Vector Remap Language) — compiled, typed expression language used in
remaptransforms and conditions; forces error handling at compile time. - Source / Transform / Sink — the three component classes: ingest, reshape/route, deliver.
- DAG — directed acyclic graph; the shape of a Vector config, wired by
inputs. - Agent / Aggregator — deployment roles: thin per-node collector vs central processing tier (Helm: DaemonSet vs StatefulSet).
routetransform — fan-out component copying each event to every named output whose VRL condition matches; non-matches exit via_unmatched.- Fallible expression — a VRL operation that can fail (e.g.
parse_json); must be handled via captured error,??, or!. abort— VRL statement that drops the current event from the transform.- Disk buffer — per-sink on-disk queue under
data_dir(buffer.type: disk), sized bymax_size, surviving restarts. when_full— buffer policy:block(backpressure upstream) ordrop_newest(shed load).- End-to-end acknowledgements — sources defer checkpoints/commits until all sinks durably accept an event; yields at-least-once delivery.
- Adaptive request concurrency (ARC) — sink algorithm that discovers safe parallelism from latency/429 signals and backs off under sink stress.
- Enrichment table — CSV/memory lookup table queried from VRL (
get_enrichment_table_record) for joins like service → team. vector top/vector tap— live CLI views of per-component throughput and of events flowing on any edge, via the API on :8686.internal_metrics— source exposing Vector’s own telemetry (buffer depth, errors, utilization) for Prometheus-style scraping.
Next steps
- Build the destination you just routed to: Deploy Loki in Distributed Microservices Mode with S3 Chunk Storage and Index Gateway.
- Go deeper on the label discipline the Loki sink demands: Grafana Loki Deep Dive: LogQL, Label Cardinality, and Chunk Storage Tuning.
- Compare the OTel-native alternative spine: Building Production OpenTelemetry Collector Pipelines: Receivers, Processors, and Tail Sampling.
- Stand up the analytics sink: Deploy ClickHouse Cluster with ReplicatedMergeTree and ClickHouse Keeper.
- Wire the alerts this pipeline’s metrics should fire: Set Up Grafana OnCall for Alerting and Rotation Management.