In a nutshell
Think of a large airline. One organisation builds the planes, runways, and terminals; a completely different organisation — the operations control centre — keeps every flight running safely, on time, and recovers the schedule when a storm rolls in. On AWS, the Platform perspective builds the planes and terminals (the landing zone, the workloads). The Operations perspective is the control centre: it keeps what you built healthy in production, sees trouble coming, responds when it breaks, and proves it can recover from a disaster. The AWS Cloud Adoption Framework (CAF) puts a name to that discipline so a whole company can do it consistently, not just one heroic engineer at 3 a.m.
This lesson is the Operations perspective of the AWS CAF — an organisation-wide adoption discipline spanning people, process, and tooling across your entire estate. Do not confuse it with two neighbours that share vocabulary: it is not a firewall (CAF here = Cloud Adoption Framework), and it is not the Well-Architected Operational Excellence pillar — that pillar is a per-workload design review, while this perspective is how the whole company runs everything it operates. A total beginner should care because “we deployed it” and “we operate it to a promise” are two different worlds, and every real job — SRE, platform engineer, DevOps, IT service manager — lives in the second one. The framework gives you the vocabulary (SLO, MTTR, RTO, error budget, blameless review) that senior engineers use every day.
We walk the nine Operations capabilities: observability; event management (AIOps); incident and problem management; change, release, and configuration management; performance and capacity management; availability and continuity; patch management; plus application management and the operating model that ties them together. For each one you get the plain idea, why it matters, the AWS services that make it real, and a worked example you can follow line by line.
Level: Advanced (approachable) · Time: ~55 min
Prerequisites — you’ll get the most from this if you have already met the framework itself in the CAF overview (the six perspectives and the Envision–Align–Launch–Scale loop), and you’re comfortable with core AWS building blocks (EC2, VPC/NAT, IAM, CloudWatch, an autoscaling group). You do not need to have run any of these tools; every command here is illustrative and labelled representative.
After this lesson you will be able to:
- Explain, in plain language, what each of the nine Operations capabilities delivers and which AWS service operationalises it.
- Turn a business promise into a measurable SLO, compute its error budget, and wire a burn-rate alarm.
- Separate incident management (restore now) from problem management (never again) and run each with the right AWS tooling.
- Choose a DR pattern (backup & restore → pilot light → warm standby → active/active) from an RTO/RPO and a downtime-cost number, and know how to prove it.
- Pick the right autoscaling signal, treat service quotas as capacity, and design a fleet patch program that is immutable-first, reported, and exception-managed.
- Recognise the operating-model choice (you-build-you-run vs a central platform/SRE team) and map these capabilities onto ITIL practices for a mixed enterprise audience.
Where this fits
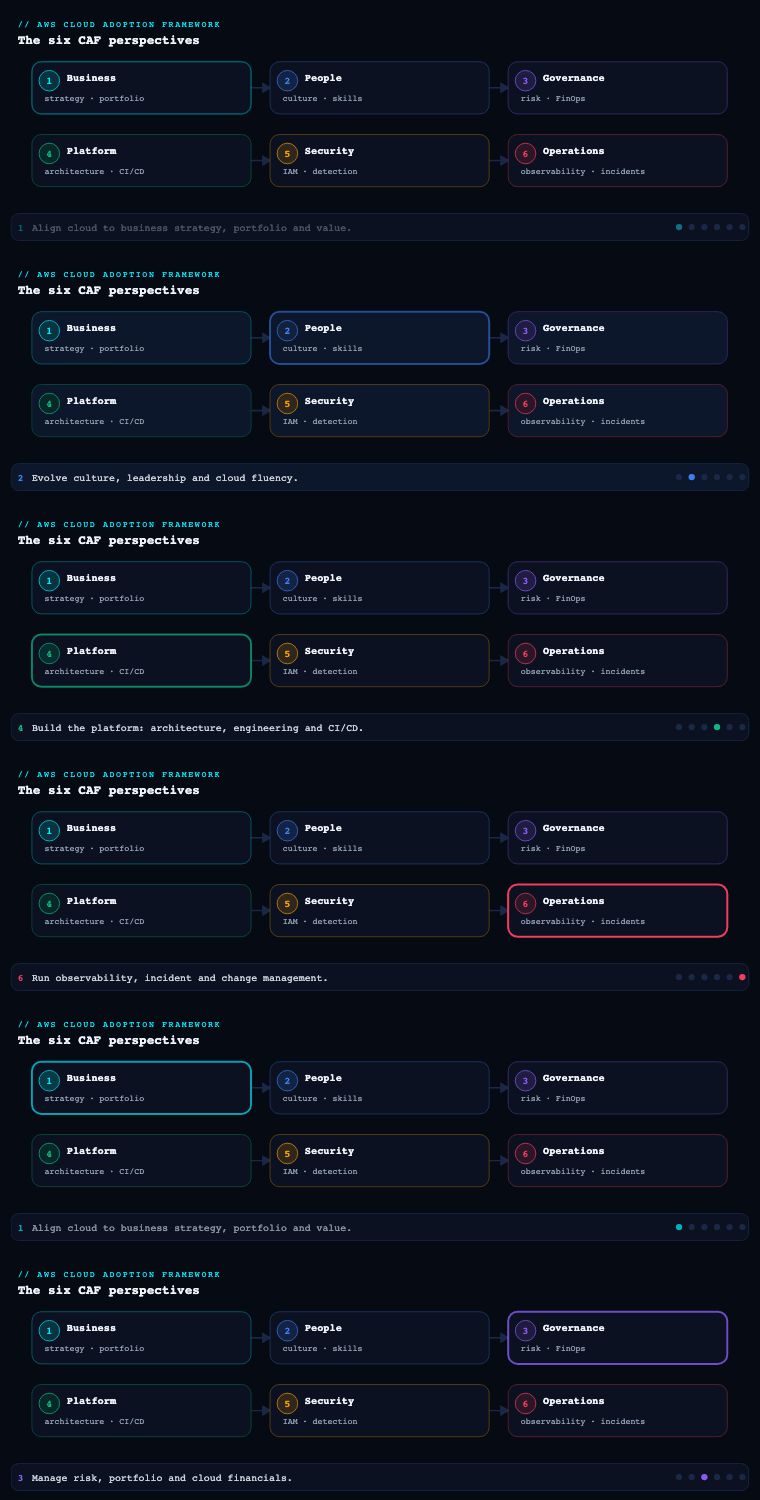
The AWS Cloud Adoption Framework organizes cloud transformation into six perspectives — Business, People, Governance, Platform, Security, and Operations — and the Operations perspective is the one that ensures cloud services are delivered at a level that meets the needs of your business. Where Platform builds the landing zone and the workloads, Operations is what keeps them running, observable, and recoverable in production; its stakeholders are the infrastructure and operations leaders, site-reliability engineers, IT service managers, and the platform/SRE teams who carry the pager. This is part 7 of the series, and it goes deep on seven of the Operations capabilities — observability, event management (AIOps), incident and problem management, change/release/configuration management, performance and capacity management, availability and continuity, and patch management — the disciplines that turn “we deployed it” into “we operate it to an SLO.” Operations is also where the abstract promise of operational resilience from the Business perspective becomes a measured, defended number, and where the Well-Architected Operational Excellence and Reliability pillars become day-2 practice rather than a design review checkbox.
Observability
What it is. Observability is the capability of gaining visibility into the state and behaviour of your workloads — not just whether a host is up, but whether the user-facing service is healthy and why it is or is not. AWS frames it around the three classic telemetry signals — metrics, logs, and traces — plus the curation of dashboards, service-level objectives (SLOs), and synthetic checks that turn raw signal into operational truth. The distinction from plain monitoring matters: monitoring answers known questions (“is CPU above 80%?”); observability lets you ask new questions of a system you did not anticipate (“why are only checkout requests from the EU edge slow, and only since the 14:05 deploy?”).
Why it matters. Every other capability in this perspective depends on it. You cannot manage an incident you cannot see, set a capacity threshold you cannot measure, or prove an availability SLO you do not instrument. Observability is also the single biggest determinant of MTTD (mean time to detect) and a major lever on MTTR (mean time to resolve) — and in a distributed, microservice, event-driven AWS estate, the failure modes are emergent and partial, so host-up/host-down monitoring is actively misleading. The goal is to detect degradation from the customer’s viewpoint before a customer reports it.
How to do it well. Standardize on structured, correlated telemetry and adopt OpenTelemetry so instrumentation is vendor-portable. Concretely:
- Metrics — emit application and business metrics as CloudWatch metrics (custom + Embedded Metric Format so a single structured log line publishes high-cardinality metrics without throttling
PutMetricData). Use CloudWatch Metric Math and anomaly detection bands rather than static thresholds where load is seasonal. - Logs — centralize in CloudWatch Logs, query with Logs Insights, and ship a curated subset to Amazon OpenSearch Service or a security/data lake when you need long-retention full-text search. Enforce a structured (JSON) logging standard with a correlation/trace ID on every line.
- Traces — instrument with AWS X-Ray (or OTel exporting to X-Ray) so you get a service map and per-segment latency; this is what isolates “the slow EU checkout” to a single downstream dependency.
- SLOs — define SLIs (availability, latency p99, error rate) and error budgets per service; CloudWatch Application Signals now provides first-class SLO objects and burn-rate alarms on top of auto-instrumented services.
- Synthetics & RUM — run CloudWatch Synthetics canaries against critical user journeys from outside the system, and use CloudWatch RUM for real-user front-end performance.
- Curation — publish a service health dashboard per workload (golden signals + dependencies) and a roll-up; Amazon Managed Grafana and Amazon Managed Service for Prometheus (AMP) are the standard for container/Kubernetes-heavy estates.
Artifacts, decisions, and AWS tooling.
| Telemetry signal | What you produce | Primary AWS service |
|---|---|---|
| Metrics | Golden-signal + business metrics, anomaly bands | Amazon CloudWatch, CloudWatch EMF, AMP/Prometheus |
| Logs | Structured JSON logs with correlation IDs, Logs Insights queries | CloudWatch Logs, OpenSearch Service |
| Traces | Service map, p99 segment latency | AWS X-Ray, AWS Distro for OpenTelemetry (ADOT) |
| SLOs / SLIs | Per-service SLO objects, error budgets, burn-rate alarms | CloudWatch Application Signals |
| Synthetic / RUM | Canaries on critical journeys, real-user metrics | CloudWatch Synthetics, CloudWatch RUM |
| Dashboards | Service health + roll-up dashboards | CloudWatch Dashboards, Amazon Managed Grafana |
The decisions to make explicit: your telemetry standard (OTel + structured logs + mandatory correlation ID), your retention/cost tiers (hot in CloudWatch, warm in OpenSearch, cold in S3 — observability cost is real and runs away silently), and what an SLO actually is for each tier-1 service, because that number anchors incident severity, change risk, and capacity planning downstream.
Worked example: turning a business promise into an SLO, an error budget, and an alarm
The abstractions above (SLI, SLO, error budget, burn rate) only click once you push real numbers through them. Take one tier-1 journey — starting a telemedicine session — and turn “it should basically always work” into something a machine can alarm on.
Step 1 — pick the SLI. An SLI (service-level indicator) is a ratio of good events to total events, measured from the user’s side. Here: good = session-start requests that returned 200 in under 800 ms, total = all session-start requests. Availability and latency fold into one number by defining a slow response as a bad one.
Step 2 — set the SLO and read off the error budget. An SLO (service-level objective) is the target for that SLI over a window — say 99.95% over a rolling 30 days. The error budget is simply what’s left over: 1 − 0.9995 = 0.0005 = 0.05%. Turn it into wall-clock and requests:
| Quantity | Formula | Value |
|---|---|---|
| Window | 30 days | 43,200 min |
| Downtime budget | 43,200 × (1 − 0.9995) |
21.6 min / 30 days |
| Request budget (at 4M req/30d) | 4,000,000 × 0.0005 |
2,000 bad requests |
That 21.6 minutes is the single most useful number in operations: it is the permission to fail that funds every risky deploy, and when it’s gone you stop shipping features and spend the budget on reliability instead (the error-budget policy).
Step 3 — emit the metric cheaply with EMF. You do not call PutMetricData per request — you’d throttle and pay per call. Instead emit CloudWatch Embedded Metric Format (EMF): one structured log line that CloudWatch parses into a metric automatically, keeping the full-cardinality log and the metric from a single write.
{
  "_aws": {
    "Timestamp": 1717900000000,
    "CloudWatchMetrics": [
      {
        "Namespace": "Aurelius/Telemedicine",
        "Dimensions": [["Service", "Operation"]],
        "Metrics": [{ "Name": "SessionStartLatencyMs", "Unit": "Milliseconds" }]
      }
    ]
  },
  "Service": "session-api",
  "Operation": "StartSession",
  "correlation_id": "c1a2b3d4-5e6f-7a8b-9c0d-1e2f3a4b5c6d",
  "StatusCode": 200,
  "SessionStartLatencyMs": 812
}
Every line already carries the correlation_id — the same ID your load balancer, X-Ray trace, and downstream services stamp — so a single grep pivots from metric spike to trace to log with no guesswork.
Step 4 — find the breaches in the logs. A CloudWatch Logs Insights query turns raw lines into the breach count that feeds the SLO:
fields @timestamp, correlation_id, SessionStartLatencyMs
| filter Operation = "StartSession" and (StatusCode != 200 or SessionStartLatencyMs > 800)
| stats count() as bad_events by bin(5m)
| sort @timestamp desc
Step 5 — alarm on burn rate, not on a raw threshold. A static “latency > 800 ms” alarm pages on every transient blip. A burn-rate alarm asks a smarter question: how fast am I spending the 30-day budget right now? Burn rate = (observed bad-event rate) ÷ (budget rate). A 2% bad rate against a 0.05% budget burns at 0.02 / 0.0005 = 40× — at that pace the whole month’s budget is gone in 30d ÷ 40 ≈ 18 hours. The industry-standard pattern is multi-window, multi-burn-rate:
| Alert | Burn rate | Windows | Budget consumed | Action |
|---|---|---|---|---|
| Fast (page) | ≥ 14.4× | 1 h and 5 min | ~2% in 1 h | Page on-call now |
| Slow (ticket) | ≥ 3× | 6 h and 30 min | ~10% in 2 days | Open a ticket |
Requiring the short and long window to both trip suppresses one-off spikes while still catching a genuine sustained burn fast. CloudWatch Application Signals now models the SLO and its burn-rate alarms as first-class objects on auto-instrumented services, so you declare the objective and it derives the alarms — you do not hand-build the metric math. This is exactly the CloudWatch/CloudTrail observability and X-Ray tracing machinery, promoted from “graphs we look at” to “the contract we operate against.”
Event management (AIOps)
What it is. Event management is detecting events, assessing their potential impact, and determining the appropriate control action — and at scale this becomes AIOps: using machine learning to reduce the operational noise that a large AWS estate generates so humans only see signal. An event is any observable change of state (an alarm firing, a config drift, a deployment, a quota breach); event management is the pipeline that ingests, deduplicates, correlates, enriches, prioritizes, and routes those events — and ideally auto-remediates the well-understood ones.
Why it matters. A mature account structure emits a torrent of events. Without correlation you drown: one root cause (a saturated NAT gateway) fans out into forty downstream CloudWatch alarms across ten services, and the on-call engineer pages on the symptoms, not the cause. AIOps attacks alert fatigue and shrinks MTTD/MTTR by collapsing that storm into a single, root-cause-tagged, actionable event. It is also the bridge between observability (which produces signal) and incident management (which responds to it).
How to do it well. Build an event-driven pipeline and apply ML where it earns its keep:
- Ingest and route — make Amazon EventBridge the event bus. AWS service events, CloudWatch alarms (via EventBridge), Health events, Config rule evaluations, and GuardDuty findings all land here and route by rule to the right target.
- Correlate with ML — Amazon DevOps Guru ingests CloudWatch, X-Ray, and Config data and uses ML to surface operational insights with likely root cause and related anomalies, dramatically cutting the correlation work; DevOps Guru for RDS adds database-specific detection. CloudWatch anomaly detection and Contributor Insights find the top-N talkers behind a spike.
- Enrich — attach context (which deployment, which change ticket, owning team, runbook link) so an event is actionable on arrival.
- Auto-remediate the known-knowns — wire EventBridge → Systems Manager Automation runbooks or Lambda for deterministic responses (restart a task, clear a queue, scale out, fail over a read replica). AWS Config auto-remediation handles drift (re-encrypt a bucket, re-attach an SG).
- Stay ahead with proactive events — AWS Health (and the Health API/EventBridge integration) tells you about scheduled maintenance, deprecations, and account-impacting issues before they bite; Trusted Advisor flags service-limit and resilience risks.
Artifacts, decisions, and AWS tooling.
| Stage | What it does | AWS service |
|---|---|---|
| Event bus | Ingest and route all operational events | Amazon EventBridge |
| ML correlation | Root-cause insights, anomaly + related-event grouping | Amazon DevOps Guru, CloudWatch anomaly detection |
| Enrichment | Add change/owner/runbook context | EventBridge input transformer, Lambda |
| Auto-remediation | Deterministic fixes for known events | SSM Automation runbooks, AWS Config remediation, Lambda |
| Proactive | Maintenance, deprecation, limits, resilience | AWS Health, AWS Trusted Advisor |
Key decisions: which events are auto-remediated vs paged (start conservative, promote to auto only after the runbook is proven), your deduplication/correlation strategy (DevOps Guru insight as the primary alert unit, not the raw alarm), and a noise budget — track alert-to-action ratio and treat a low ratio as a defect to fix, not background hum.
Incident and problem management
What it is. Two distinct disciplines AWS deliberately separates. Incident management restores service operation as quickly as possible (it is about recovery and is time-bounded by an SLA). Problem management identifies and addresses the root causes of incidents to prevent recurrence (it is about learning and is not time-bounded). One asks “how do we make it work again now?”; the other asks “why did it break, and how do we make sure it never breaks that way again?”
Why it matters. Conflating them is the classic operations failure: teams firefight the same incident monthly because the post-incident “problem” work never happens. Separating them lets you optimize incident response for speed (clear severities, defined on-call, a war room, a single incident commander) while running a parallel, blameless learning loop that permanently retires recurring failure classes — the only thing that bends the long-run incident curve downward.
How to do it well.
- Define severities and SLAs up front — a Sev-1/2/3/4 matrix tied to SLO/error-budget impact, each with a response-time target, an escalation path, and a communications cadence.
- Operationalize on-call — AWS Systems Manager Incident Manager provides response plans, engagement/escalation schedules and contacts, runbooks (SSM Automation) that execute during an incident, and a structured incident timeline. It integrates with CloudWatch alarms and EventBridge so a Sev-1 alarm auto-creates the incident, pages the on-call rotation, opens the chat war room (via AWS Chatbot to Slack/Microsoft Teams), and starts the timeline.
- Run the incident with roles — incident commander, comms lead, ops lead; Incident Manager’s timeline captures actions and decisions for the post-incident analysis automatically.
- Close the loop with problem management — every Sev-1/2 triggers a blameless post-incident review (PIR/COE) producing root cause, contributing factors, and corrective actions with owners and due dates that go on the backlog as first-class work. Track recurrence and time-to-close on corrective actions as KPIs.
- Curate runbooks — maintain versioned SSM Automation runbooks and human runbooks in AWS Systems Manager Documents; the goal is that the response to a known incident is “run this,” not “improvise.”
Artifacts, decisions, and AWS tooling.
| Artifact | What it captures | AWS service |
|---|---|---|
| Severity matrix + SLAs | Sev levels, response targets, escalation, comms | Documented standard; tied to CloudWatch SLOs |
| Response plans | Auto-create incident, page, runbooks, chat | SSM Incident Manager + EventBridge + AWS Chatbot |
| On-call schedule | Rotations, contacts, escalation | Incident Manager engagement/escalation |
| Incident timeline | Auto-captured actions, decisions | Incident Manager |
| PIR / COE | Root cause, corrective actions, owners, dates | Documented; backlog-tracked |
| Runbook library | Versioned automation + human runbooks | SSM Automation / SSM Documents |
The decisions that matter: the severity definition (anchor it to customer/SLO impact, not internal opinion), who can declare a Sev-1 (anyone, no permission needed — false alarms are cheaper than delayed response), and a hard rule that problem-management corrective actions are sprint-committed work, not a wiki page nobody reads.
Worked example: one incident, from alarm to corrective action
Walk a single Sev-1 end to end so the two disciplines — restore now and never again — are concrete rather than slogans.
The severity matrix (decide this before the incident, not during it). Anchor severity to customer/SLO impact, never to internal drama. A concrete, defensible matrix:
| Sev | Definition (customer/SLO impact) | Response target | Comms cadence | Who is engaged |
|---|---|---|---|---|
| Sev-1 | Tier-1 journey down or SLO burning ≥14.4× | Ack ≤ 5 min, 24×7 | Every 30 min to stakeholders | On-call + IC + comms lead |
| Sev-2 | Degraded / partial; error budget at risk | Ack ≤ 15 min, business hrs + on-call | Hourly | On-call + IC |
| Sev-3 | Minor, workaround exists | Next business day | On ticket | Owning team |
| Sev-4 | Cosmetic / no user impact | Backlog | None | Owning team |
Two rules make it work: anyone may declare a Sev-1 (a false alarm is far cheaper than a delayed response), and the severity drives the machinery automatically — you don’t want a human deciding whether to page at 3 a.m.
Restore (incident management). The SLO burn-rate alarm from the observability example fires at 14:05. Because it is wired CloudWatch alarm → EventBridge → Systems Manager Incident Manager, a response plan runs with no human in the loop:
# Representative — normally EventBridge starts this, not a person.
aws ssm-incidents start-incident \
  --response-plan-arn "arn:aws:ssm-incidents::123456789012:response-plan/telemed-sev1" \
  --title "Telemedicine session-start SLO breach" \
  --impact 1 \
  --trigger-details '{"source":"aws.cloudwatch","timestamp":"2026-06-09T14:05:00Z","rawData":"SessionStartBurnRate>=14.4"}'
Within ~60 seconds the response plan has: paged the on-call rotation (engagement/escalation contacts), opened a Slack war room via AWS Chatbot, attached the runbook, and started an incident timeline that auto-captures every action and metric change. The on-call runs the pre-written SSM Automation runbook — “NAT saturation: scale the NAT gateway path / fail traffic to the standby subnet” — so the response is run this, not improvise this. Roles are explicit: incident commander (decides, delegates, does not type), ops lead (drives the runbook), comms lead (updates stakeholders on cadence). Service is restored at 14:11 — MTTR ≈ 6 minutes — and the timeline is the raw material for the next step.
Never again (problem management). The incident is closed, but the problem is not. Every Sev-1/Sev-2 triggers a blameless correction-of-error (COE), on the backlog as first-class work. A minimal COE template:
# COE-2026-06-09 — Telemedicine session-start SLO breach
Summary:      NAT gateway port-allocation exhaustion dropped 22% of session starts for 6 min.
Impact:       ~2,900 failed session starts; 6 min of 21.6-min monthly budget spent (28%).
Detection:    Burn-rate alarm at 14:05 (MTTD 40 s). Previously: 90 min manual triage.
Timeline:     14:05 alarm → 14:06 IC engaged → 14:08 root cause (DevOps Guru insight) → 14:11 restored.
Root cause:   5 Whys → single NAT gateway, no port-reuse headroom, no autoscaling on NAT path.
Contributing: No SLO on egress path; runbook existed but was untested.
Corrective actions (each OWNED, DATED, sprint-committed):
  - [ ] Add second NAT gateway + per-AZ routing            @neta  due 2026-06-20
  - [ ] DevOps Guru insight → auto-remediation runbook     @sre   due 2026-06-27
  - [ ] SLO + burn alarm on egress path                    @obs   due 2026-06-16
The hard rule that bends the long-run incident curve down: corrective actions are sprint-committed, owned, and recurrence-tracked — not a wiki page nobody reads. Track time-to-close on corrective actions and recurrence rate as KPIs, because an incident that recurs monthly is a problem-management failure, not bad luck.
Change, release, and configuration management
What it is. Three intertwined capabilities. Change management introduces, modifies, or removes anything that could affect production in a controlled way. Release management plans, schedules, and controls the build, test, and deployment of changes into production. Configuration management maintains an accurate record of the configuration of your resources and their relationships (your CMDB). Together they answer “what is allowed to change, how do we ship it safely, and do we know exactly what is running right now?”
Why it matters. In the cloud, the temptation is to swing between two failure modes: heavyweight ITIL change-advisory-board gates that throttle deployment frequency (and push people to make changes out-of-band), or a free-for-all where undocumented console changes cause drift, surprise outages, and an estate nobody can describe to an auditor. The mature answer is deployment safety through automation and progressive delivery — make the safe path the easy path — plus everything-as-code so the configuration record is the deployment mechanism, not a stale spreadsheet maintained by hand.
How to do it well.
- Infrastructure and config as code — define resources in AWS CloudFormation, the AWS CDK, or Terraform; the repo is the source of truth, and drift is detected (CloudFormation drift detection) rather than discovered. Standardize approved patterns via AWS Service Catalog and enforce guardrails with Control Tower and AWS Organizations SCPs.
- Pipelines with progressive delivery — ship through AWS CodePipeline / CodeBuild / CodeDeploy (or your CI of choice) with automated tests, manual approval actions as the lightweight “change gate,” and canary or blue/green deployment (CodeDeploy traffic shifting, Lambda/ALB weighted routing) so blast radius is bounded and automatic rollback on CloudWatch alarms is the default.
- Configuration record (CMDB) — AWS Config continuously records resource configuration and relationships, gives you a point-in-time configuration timeline, evaluates Config rules/conformance packs for compliance, and (with the aggregator) gives an org-wide view. AWS Systems Manager Inventory captures in-guest software/OS config across the fleet.
- Standard vs normal vs emergency changes — pre-approve standard changes (well-understood, automated, low-risk) so they need no per-change approval; reserve human review for normal (higher-risk) and define an emergency path with after-the-fact review. Track change success rate and change failure rate (a DORA metric) so the process is data-driven, not ceremonial.
Artifacts, decisions, and AWS tooling.
| Discipline | Artifact | AWS service |
|---|---|---|
| Change | Change policy (standard/normal/emergency), approval gates | CodePipeline approvals, Service Catalog, SCPs |
| Release | Pipelines, canary/blue-green, auto-rollback | CodePipeline, CodeDeploy, CodeBuild |
| Configuration (IaC) | CloudFormation/CDK/Terraform repos, drift detection | CloudFormation, CDK, drift detection |
| Configuration record | Resource config + relationships, timeline, compliance | AWS Config, Config aggregator, conformance packs |
| In-guest inventory | OS/app/patch inventory across fleet | SSM Inventory |
DORA’s four metrics — deployment frequency, lead time for changes, change failure rate, time to restore — are the scoreboard here; AWS exposes the pipeline data to compute them. The decision to make: define your standard-change catalogue aggressively, because every change you can safely auto-approve is a change that ships faster and is fully recorded.
Worked example: classifying a change, shipping it safely, and scoring it with DORA
Step 1 — classify the change. The whole point of the standard/normal/emergency split is to make the safe path the fast path. Decide the class from two questions: is it well-understood and automated? and what is the blast radius?
| Change | Well-understood + automated? | Blast radius | Class | Approval |
|---|---|---|---|---|
| Deploy a tested app version via pipeline (blue/green) | Yes | Bounded (canary + auto-rollback) | Standard | Pre-approved — no ticket |
| Bump an Auto Scaling max from 20 → 40 | Yes | Low | Standard | Pre-approved |
| Change the prod VPC route table / NACL | Partly | Wide, hard to test | Normal | Human review |
| Restore service during a Sev-1 | No time | Whatever it takes | Emergency | After-the-fact review |
Every change you can safely auto-approve is one that ships faster and is fully recorded (because it went through the pipeline and AWS Config saw it). Aggressively grow the standard-change catalogue: at Aurelius, moving ~70% of changes to standard is what let deployment frequency rise while the change record got better, not worse.
Step 2 — bound the blast radius with progressive delivery. A standard deploy ships canary first: shift a slice of traffic, watch the SLO alarm, then ramp — and roll back automatically if the alarm trips. For ECS via CodeDeploy, the appspec.yaml wires the traffic shift and validation hooks:
version: 0.0
Resources:
  - TargetService:
      Type: AWS::ECS::Service
      Properties:
        TaskDefinition: "arn:aws:ecs:ap-south-1:123456789012:task-definition/session-api:42"
        LoadBalancerInfo:
          ContainerName: "session-api"
          ContainerPort: 8080
Hooks:
  - BeforeAllowTraffic: "arn:aws:lambda:ap-south-1:123456789012:function:validate-pre"
  - AfterAllowTraffic:  "arn:aws:lambda:ap-south-1:123456789012:function:validate-post"
Deploy it with a canary config — CodeDeployDefault.ECSCanary10Percent5Minutes sends 10% of traffic for 5 minutes, then the rest — and attach the SLO burn-rate alarm to the deployment group. If it fires during the bake, CodeDeploy auto-rolls back to the old task set. That single wiring is what turns change-failure-rate from “we find out from customers” into “the pipeline finds out and undoes it.”
Step 3 — score the process with DORA, not opinion. The four DORA metrics turn “are we good at change?” into numbers the pipeline already emits:
| DORA metric | Definition | Aurelius before → after |
|---|---|---|
| Deployment frequency | Deploys to prod per period | 4/wk → 30/wk |
| Lead time for changes | Commit → running in prod | 6 days → 4 hours |
| Change failure rate | failed deploys ÷ total deploys |
38 ÷ 200 = 19% → 14 ÷ 200 = 7% |
| Time to restore | Incident start → restored | 90 min → 6 min |
Change failure rate is the honest one: 38 of 200 monthly deploys caused a rollback or incident at 19%; after canary + auto-rollback made failures cheap and self-healing, that fell to 7%. Note the counter-intuitive lesson — the fix for a high failure rate is usually smaller, more frequent, auto-rolled-back changes, not a heavier change-advisory board (which just pushes people to make risky changes out-of-band, off the record). And because every change flowed through the pipeline and AWS Config recorded the resulting resource state and relationships, the CMDB is the deployment mechanism, not a stale spreadsheet — drift is detected, not discovered during an audit.
Performance and capacity management
What it is. Performance management ensures cloud services meet performance expectations (latency, throughput, the SLIs you committed to), while capacity management ensures sufficient capacity is available to meet demand — neither starving the service (breaching SLOs) nor over-provisioning (burning money). In the cloud the two are deeply linked because capacity is elastic and priced per-second, so the question is rarely “do we own enough servers?” and almost always “are we scaling the right resource on the right signal at the right cost?”
Why it matters. Get capacity wrong upward and you waste a fortune on idle reserved fleet; get it wrong downward and you breach your latency SLO during the exact peak (sale, launch, quarter-end) that matters most. Performance management is also where you catch the slow regression — the deploy that quietly added 40ms to p99 — before it compounds into an incident. And capacity in AWS has a non-obvious dimension: service quotas and account limits, which silently cap you long before your code does.
How to do it well.
- Scale on demand, on the right signal — EC2 Auto Scaling with target-tracking / predictive scaling, Application Auto Scaling for ECS/DynamoDB/Aurora, Kubernetes HPA/KEDA + Karpenter for EKS, and serverless (Lambda, Fargate, Aurora Serverless v2, DynamoDB on-demand) where you want capacity management to disappear into the platform.
- Right-size continuously — AWS Compute Optimizer recommends instance/Lambda/EBS/Auto-Scaling-group right-sizing from real utilization; Cost Explorer right-sizing and rightsizing recommendations close the loop with finance.
- Load test and find limits — performance-test critical paths before peak (AWS Distributed Load Testing solution / Fault Injection); use CloudWatch Application Signals and X-Ray to attribute latency, and DevOps Guru to flag proactive resource-exhaustion risks (e.g., a table approaching throughput limits).
- Manage quotas as capacity — track and raise Service Quotas ahead of demand, watch limit-approach with Trusted Advisor, and use EC2 On-Demand Capacity Reservations (or Capacity Blocks for ML/GPU) when you must guarantee capacity for a known peak.
- Forecast — turn historical CloudWatch metrics and business-event calendars (sale dates, marketing pushes) into a capacity forecast, and pre-warm/pre-provision for known spikes rather than relying on cold-start autoscaling at T-zero.
Artifacts, decisions, and AWS tooling.
| Concern | What you produce | AWS service |
|---|---|---|
| Elastic scaling | Scaling policies (target-tracking/predictive) | EC2 Auto Scaling, Application Auto Scaling, Karpenter/KEDA |
| Right-sizing | Utilization-based resize recommendations | AWS Compute Optimizer, Cost Explorer |
| Load/perf testing | Pre-peak load test results, latency budgets | Distributed Load Testing, AWS FIS, X-Ray, App Signals |
| Quota/capacity | Quota dashboard, capacity reservations for peaks | Service Quotas, On-Demand Capacity Reservations, Capacity Blocks |
| Forecast | Capacity forecast tied to business calendar | CloudWatch metrics + business-event calendar |
The decisions worth pinning: the scaling signal per service (CPU is often the wrong one — scale on queue depth, concurrency, or p99 latency), the headroom target (how much spare capacity above forecast peak you carry), and where you deliberately trade cost for guaranteed capacity (Capacity Reservations) versus accept autoscaling risk.
Worked example: scaling on the right signal, and treating quotas as capacity
Beginners reach for CPU because it is the default autoscaling metric — and for a queue-driven or latency-bound service it is usually the wrong one. Work a real case: an ECS worker fleet draining an SQS queue, where the promise is “every job starts within 30 seconds.”
Step 1 — derive the scaling target from the promise, not from CPU. The AWS-recommended signal for queue workers is backlog per task = messages visible ÷ running tasks. Convert the latency promise into a target backlog:
target_latency        = 30 s        (each message must start within 30 s)
avg_processing_time    = 0.5 s/msg   (measured p50)
messages one task clears in 30 s     = 30 / 0.5 = 60
=> target backlog per task           = 60
Emit backlog_per_task as a custom CloudWatch metric and put a target-tracking Application Auto Scaling policy on it with target = 60. Now the fleet scales on the thing the SLO actually cares about: if backlog per task climbs above 60, latency is about to breach, and capacity is added before the promise is broken — not after CPU happens to notice.
Step 2 — match the mechanism to the workload. Different tiers want different scalers:
| Workload | Right scaler | Signal |
|---|---|---|
| EC2 fleet, predictable daily shape | EC2 Auto Scaling predictive + target-tracking | Forecast + CPU/custom |
| ECS/DynamoDB/Aurora | Application Auto Scaling | Backlog, RCU/WCU, connections |
| EKS | Karpenter (nodes) + HPA/KEDA (pods) | Pending pods, queue depth |
| Spiky, want it to disappear | Serverless (Lambda, Fargate, Aurora Serverless v2, DynamoDB on-demand) | Managed for you |
Step 3 — treat service quotas as a form of capacity. This is the trap that autoscaling hides: your code is not the first thing to cap you — an account limit is. Lambda’s default 1,000 concurrent executions per region, an EC2 vCPU quota, a NAT gateway’s port budget — any of these will throttle a launch while every dashboard shows headroom. So:
# Representative — check a quota's current value before a known peak.
aws service-quotas get-service-quota \
  --service-code lambda \
  --quota-code L-B99A9384          # "Concurrent executions"

# Request an increase AHEAD of demand, not during the incident.
aws service-quotas request-service-quota-increase \
  --service-code lambda --quota-code L-B99A9384 --desired-value 5000
Step 4 — carry headroom and forecast. Pick a headroom target — spare capacity above forecast peak — and pre-provision for known spikes (a sale, flu season, quarter-end) rather than trusting cold-start autoscaling at T-zero. Where you must guarantee capacity, pay for it deliberately with On-Demand Capacity Reservations (or Capacity Blocks for GPU/ML). The decision to write down per service is the triad: what signal do I scale on, how much headroom do I carry, and where do I trade cost for a capacity guarantee. Compute Optimizer then closes the loop from the other side — right-sizing from real utilisation so headroom is deliberate, not accidental idle spend.
Availability and continuity
What it is. Availability management ensures cloud services are available as needed (designing and operating to meet an availability/SLO target), and continuity management ensures business operations continue during and after a disruption — disaster recovery and business continuity. This is where you commit to numbers: an availability target (e.g., 99.95%), a Recovery Time Objective (RTO), and a Recovery Point Objective (RPO), and then architect and prove you meet them.
Why it matters. Availability and continuity are the operational expression of the Well-Architected Reliability pillar and the entire reason the Operations perspective exists — “delivered at a level that meets the needs of the business” is an availability commitment. The trap is treating DR as a binder that is never tested; an untested DR plan is a hypothesis, and you discover during the real outage that the runbook is stale, the backups don’t restore, or the failover region was missing a quota. Continuity is only real if it is rehearsed.
How to do it well.
- Design for it — Multi-AZ by default for every stateful tier (RDS/Aurora Multi-AZ, ElastiCache, MSK), spread compute across AZs, and front with Elastic Load Balancing + Auto Scaling so an AZ loss is a non-event. Use Route 53 health checks + failover/latency routing and the Application Recovery Controller (ARC) with readiness checks and routing controls for deliberate, audited regional failover.
- Pick a DR strategy by RTO/RPO and cost — AWS’s four canonical patterns, in increasing cost and decreasing RTO/RPO:
| DR strategy | RTO / RPO | What runs in the recovery region | Typical use |
|---|---|---|---|
| Backup & restore | Hours / hours | Nothing; restore from backups | Tier-3 workloads, cost-sensitive |
| Pilot light | 10s of minutes / minutes | Core data replicated, servers off | Tier-2 workloads |
| Warm standby | Minutes / seconds | Scaled-down full stack, always on | Tier-1 business apps |
| Multi-site active/active | Near-zero / near-zero | Full stack live in 2+ regions | Tier-0, can’t-go-down |
- Back up centrally — AWS Backup for policy-based, cross-account and cross-region backups with a backup vault, Vault Lock (immutability) against ransomware, and restore testing. Aurora/DynamoDB global tables and S3 Cross-Region Replication handle data-layer continuity for higher tiers.
- Prove it with game days — run chaos engineering with AWS Fault Injection Service (FIS) (kill an AZ, inject latency, throttle an API) and scheduled DR game days that actually fail over and measure achieved RTO/RPO against target. Resilience Hub assesses a workload against its RTO/RPO policy, finds gaps, and tracks resilience score over time.
Artifacts, decisions, and AWS tooling.
| Artifact | What it captures | AWS service |
|---|---|---|
| Availability/SLO targets | Per-tier availability %, error budget | CloudWatch Application Signals |
| RTO/RPO + DR strategy | Per-workload tier → DR pattern | AWS Resilience Hub (policy + score) |
| HA architecture | Multi-AZ, ELB, failover routing | Route 53 ARC, ELB, Auto Scaling |
| Backup policy | Schedules, retention, cross-region, immutability | AWS Backup, Backup Vault Lock |
| Replication | Cross-region data continuity | Aurora/DynamoDB global tables, S3 CRR |
| Resilience testing | Game-day results, chaos experiments, achieved RTO/RPO | AWS FIS, DR game days |
The core decisions: a workload-to-tier-to-DR-pattern map (not everything needs active/active — match the pattern to the business cost of downtime), the immutability/ransomware posture on backups (Vault Lock is non-negotiable for tier-1), and a mandatory DR test cadence with achieved-vs-target RTO/RPO as a reported KPI.
Worked example: the nines, compound availability, and choosing a DR tier from a number
Step 1 — know what a “nine” actually costs you. An availability target is a downtime budget; each nine shrinks it by ~10×:
| Availability | Downtime / 30 days | Downtime / year |
|---|---|---|
| 99.9% (“three nines”) | 43.2 min | ~8.8 h |
| 99.95% | 21.6 min | ~4.4 h |
| 99.99% (“four nines”) | 4.32 min | ~52 min |
| 99.999% (“five nines”) | 25.9 s | ~5.3 min |
Committing to “four nines” is committing to resolve any outage in under ~4 minutes a month — which is a statement about your MTTR and your architecture, not a marketing adjective.
Step 2 — do the compound-availability maths (the part beginners miss). Availability multiplies down a serial dependency chain and improves with parallel redundancy. If a request must pass through three components each at 99.9%:
serial (chain): 0.999 × 0.999 × 0.999 = 0.997 → 99.7% (WORSE than any single part!)
So a service can be less reliable than its weakest dependency simply by depending on several of them. Redundancy pulls the other way — two independent replicas of a 99% component in parallel:
parallel (either works): 1 − (1 − 0.99)² = 1 − 0.0001 = 0.9999 → 99.99%
The design lesson: remove serial single points of failure and add parallel redundancy (Multi-AZ, ELB + Auto Scaling, read replicas) — that is why Multi-AZ is the default for every stateful tier, not a nice-to-have.
Step 3 — choose the DR tier from the cost of downtime. Don’t ask “how resilient can we be?” — ask “what does an hour of downtime cost, and what RTO/RPO does that justify?” Match the answer to the four canonical patterns from the table above:
| If downtime costs… | And you can lose… | Choose | Approx. run-cost |
|---|---|---|---|
| A little (internal tool) | Hours of data | Backup & restore | ~nil |
| Real money (tier-2 app) | Minutes | Pilot light | Low |
| A lot (tier-1 revenue/clinical) | Seconds | Warm standby | Medium |
| Catastrophic (can’t-go-down) | ~Zero | Multi-site active/active | High |
Aurelius put telemedicine on warm standby: a scaled-down full stack always running in a second region, Aurora global database replicating with sub-second lag (RPO ~1 min) and Route 53 Application Recovery Controller routing controls for a deliberate, audited failover — targeting RTO 15 min.
Step 4 — prove it, because an untested DR plan is a hypothesis. The number on the runbook is a claim until a game day makes it a measurement. A quarterly AWS FIS experiment fails the primary region over for real and stops the clock on recovery:
DR game day (Q3):
  14:00:00  FIS experiment: block primary-region endpoint
  14:03:30  ARC routing control flips traffic to standby region
  14:11:40  synthetic canary "book → join call" green in standby
  ACHIEVED RTO = 11 min 40 s   vs   TARGET 15 min   ✅  (RPO measured 48 s vs 60 s target)
Resilience Hub scores each workload against its RTO/RPO policy between game days and flags drift (a config change that would have blown the target). Two decisions are non-negotiable for tier-1: AWS Backup with Vault Lock immutability (an untested, mutable backup is worthless against ransomware) and a mandatory DR-test cadence reporting achieved-vs-target as a KPI. For the deeper strategy trade-offs across all four patterns, see enterprise DR strategies on AWS.
Patch management
What it is. Patch management is distributing and applying software updates — OS and application patches, AMI refreshes, and runtime/dependency updates — to keep the estate secure, compliant, and stable. It sits in Operations (delivery and stability) but is joined at the hip with the Security perspective’s vulnerability management; an unpatched fleet is both an availability risk (known crash bugs) and the most common breach vector.
Why it matters. Patching is where good intentions go to die at scale: a handful of servers is trivial, but a few thousand instances across dozens of accounts, with maintenance windows, blast-radius concerns, and “we can’t reboot the payments host during business hours” constraints, is a genuine operational program. Drift here is silent and cumulative — six months of skipped patches is how a single CVE turns into a ransomware event. The mature posture is automated, reported, exception-managed patching with immutable replacement preferred over in-place patching wherever the architecture allows.
How to do it well.
- Automate in-place patching — AWS Systems Manager Patch Manager with patch baselines (per-OS approval rules, auto-approve after N days, explicit allow/deny CVEs), patch groups (tag-based: dev patches before prod), and maintenance windows so patching happens in approved, low-traffic windows. State Manager keeps configuration converged; Fleet Manager gives a fleet-wide view.
- Prefer immutable replacement — for autoscaled and container workloads, don’t patch the running host: bake a new golden AMI with EC2 Image Builder (which can run on a schedule, patch, test, and distribute AMIs across accounts/regions), or rebuild the container image, then roll it out through the deployment pipeline (blue/green). The instance/task is cattle, not a pet — replace, don’t repair.
- Patch what isn’t an OS — containers via base-image rebuilds, Lambda runtimes (track deprecations via AWS Health), managed-service engine versions (RDS/Aurora/ElastiCache/EKS version upgrades on a planned cadence), and application dependencies via Amazon Inspector, which continuously scans EC2, ECR images, and Lambda for vulnerable packages and feeds the priority list.
- Report and manage exceptions — compliance reporting in Patch Manager / AWS Config rules / Security Hub shows percent-compliant by account and patch group; treat any host that can’t be patched on schedule as a tracked exception with a compensating control and an expiry, not a permanent blind spot. Drive a patch SLA (e.g., critical CVEs remediated within 7 days, high within 30).
Artifacts, decisions, and AWS tooling.
| Concern | What you produce | AWS service |
|---|---|---|
| In-place patching | Baselines, patch groups, maintenance windows | SSM Patch Manager, State Manager, Fleet Manager |
| Immutable patching | Scheduled golden-AMI / image rebuild + roll-out | EC2 Image Builder + deployment pipeline |
| Vulnerability feed | Continuous CVE scan of EC2/ECR/Lambda | Amazon Inspector |
| Managed-service patching | Planned engine-version upgrade calendar | RDS/Aurora/EKS/ElastiCache version upgrades |
| Compliance & exceptions | % compliant, exception register with expiry, patch SLA | Patch Manager compliance, AWS Config, Security Hub |
The decisions: in-place vs immutable per workload class (immutable for everything autoscaled/containerized; in-place only for true pets), your patch SLA by severity (tie it to Inspector’s scoring and your Security perspective’s vuln-management policy), and the maintenance-window strategy that respects business-critical hours while still hitting the SLA.
Worked example: a patch baseline, a maintenance window, and a compliance SLA
For the pets you can’t rebuild (a couple of legacy claims hosts), in-place patching still has to be automated, windowed, and reported. Three artifacts do it.
Step 1 — a patch baseline (what counts as “approved”). A patch baseline encodes approval rules so you’re not hand-picking patches. This one auto-approves Critical/Important security patches 7 days after release (a soak period to dodge bad patches) and marks anything unpatched as CRITICAL-severity non-compliance:
# Representative — define approval rules once, apply fleet-wide.
aws ssm create-patch-baseline \
  --name "prod-al2023-security" \
  --operating-system AMAZON_LINUX_2023 \
  --approval-rules '{
    "PatchRules": [{
      "PatchFilterGroup": {"PatchFilters": [
        {"Key": "CLASSIFICATION", "Values": ["Security"]},
        {"Key": "SEVERITY", "Values": ["Critical", "Important"]}
      ]},
      "ApproveAfterDays": 7,
      "ComplianceLevel": "CRITICAL"
    }]
  }'
Step 2 — patch groups (who patches when). Tag instances with the Patch Group tag so the same baseline rolls out dev before prod: Patch Group = al2023-dev patches on Tuesday, al2023-prod the following Tuesday — the dev tier is your canary for the patch itself.
Step 3 — a maintenance window (patch only in approved hours). Never patch a payments host mid-afternoon. A maintenance window runs the AWS-RunPatchBaseline document on a cron, targeting the patch-group tag, at low traffic:
aws ssm create-maintenance-window \
  --name "prod-patch-sun-0200" \
  --schedule "cron(0 0 2 ? * SUN *)" \
  --duration 3 --cutoff 1 --allow-unassociated-targets
# then register the target (by Patch Group tag) and the AWS-RunPatchBaseline task
Step 4 — report compliance and manage exceptions against an SLA. Patch Manager reports percent-compliant by patch group; a host that genuinely can’t be patched on schedule becomes a tracked exception with a compensating control and an expiry — never a permanent blind spot.
aws ssm list-compliance-summaries --filters \
  "Key=ComplianceType,Values=Patch,Type=EQUAL"
# => CompliantCount 486 / NonCompliantCount 8  → 98.4% compliant
Drive it against a severity-based patch SLA — critical CVEs remediated ≤ 7 days, high ≤ 30 — tied to Amazon Inspector’s continuous CVE scoring, and surface the roll-up in Security Hub. Remember the hierarchy though: this whole in-place dance is the fallback. For anything autoscaled or containerised, don’t patch the running host at all — bake a fresh golden AMI with EC2 Image Builder (or rebuild the image) and roll it through the deployment pipeline. Cattle, not pets: replace, don’t repair.
Going deeper
The capabilities above are what Operations does. This section is the how it actually runs at scale — the operating model, the cross-account plumbing, and the internals that separate a checklist from a program.
The operating model: who carries the pager?
Every capability above assumes an answer to one org-design question: who operates the workload? Three models, and the choice shapes everything downstream.
| Model | Who runs it in prod | Strength | Failure mode |
|---|---|---|---|
| You-build-you-run | The product team that wrote it | Fast feedback, ownership, incentive to fix root causes | Every team reinvents observability/on-call; uneven maturity |
| Centralised platform / SRE | A dedicated ops/SRE team | Consistency, deep expertise, one pager | Bottleneck; “throw it over the wall”; ops detached from code |
| Hybrid “paved road” (most mature) | Platform team owns the paved road; product teams own their pager on it | Consistency and ownership | Requires real platform investment and clear interfaces |
The mature enterprise answer is the hybrid: a central platform/SRE team provides a paved road — the golden telemetry pipeline, the Incident Manager response plans, the deployment templates, the patch baselines — and product teams operate their own services on that road, owning their SLOs and their pager. This is Conway’s law used deliberately: the system’s reliability boundaries end up mirroring the team boundaries, so you draw the team boundaries to match the failure domains you want. The application management capability lives here too — cataloguing each application, its owner, its dependencies, its SLOs, and its runbooks — because you cannot operate what you cannot enumerate. AWS Service Catalog, an AppRegistry application definition, and the AWS Config CMDB together answer “what applications do we run, who owns each, and what does it depend on?”
Mapping CAF Operations to ITIL (for the enterprise audience)
Many organisations arriving on AWS already run ITIL. The CAF Operations capabilities map onto ITIL 4 practices almost one-to-one — useful when you have to speak to an existing service-management function:
| CAF Operations capability | ITIL 4 practice | The cloud-native shift |
|---|---|---|
| Observability | Monitoring & event management | From host checks to SLI/SLO + traces |
| Event management (AIOps) | Event management | ML correlation replaces manual triage |
| Incident management | Incident management | Auto-created, auto-paged, timed by SLA |
| Problem management | Problem management | Blameless COE, sprint-committed actions |
| Change / release | Change enablement + Release management | Standard-change catalogue + progressive delivery |
| Configuration management | Service configuration management (CMDB) | AWS Config is the CMDB, auto-populated |
| Availability & continuity | Availability + Service continuity management | RTO/RPO proven by game days |
| Capacity & performance | Capacity & performance management | Elastic + quota-aware, priced per-second |
The message to a traditional ITIL shop is not “throw away ITIL” — it is “keep the intent of each practice, but automate the mechanism,” so change enablement becomes a pipeline gate rather than a weekly CAB meeting.
The error-budget policy: the mechanism, not the metric
An error budget is inert until a policy binds it to behaviour. The canonical policy: while the 30-day error budget is intact, the team ships features freely and takes deploy risk; when the budget is exhausted, a change freeze kicks in — only reliability work and critical fixes ship until the budget recovers. This is what makes the SLO self-enforcing: it removes the perennial feature-vs-reliability argument by pre-agreeing the trade in numbers. Encode it operationally — a burn-rate alarm that flips a pipeline variable, gating non-critical deploys — so the freeze is a fact, not a conversation. The subtle failure mode is an SLO set too loose (budget never depletes, so the policy never bites) or too tight (permanent freeze, team routes around it); calibrate the SLO to the reliability customers actually perceive, and revisit it.
Cross-account observability at scale
A 42-account estate cannot have engineers logging into 42 CloudWatch consoles during an incident. CloudWatch cross-account observability (the Observability Access Manager — OAM) solves this with a monitoring account that holds a sink, and source accounts that create a link to it; metrics, logs, and traces then surface centrally, read-only, without copying data. The pattern mirrors the org: the monitoring account sits in a central Operations OU, links are provisioned by the landing-zone automation, and the on-call sees the whole estate from one pane. The same shape applies to AWS Config — a delegated-admin aggregator account rolls up configuration and conformance-pack compliance org-wide, so “which of our 2,600 instances is non-compliant with the encryption rule?” is one query, not 42.
Event pipeline internals: archive, replay, and schema
Two EventBridge features matter once the bus is load-bearing. Archive & replay lets you retain events and re-drive them — indispensable when a downstream consumer had a bug and you must reprocess an hour of events after fixing it, and a genuine part of incident recovery. The schema registry (with generated code bindings) keeps producers and consumers from drifting — an event’s shape is a contract, and a silently changed field is a distributed-systems landmine. Design idempotent consumers, because at-least-once delivery plus replay guarantees you will see duplicates.
Decomposing MTTR (where the minutes actually go)
“Reduce MTTR” is too coarse to act on. Decompose it and each capability targets one term:
MTTR = MTTD (detect) + MTTA (acknowledge) + MTT-diagnose + MTT-repair + verify
        └ observability   └ paging/on-call    └ AIOps + traces  └ runbooks   └ synthetics
Aurelius’s 90-min → 6-min win was almost entirely in MTTD (burn-rate alarm: 90 min → 40 s) and diagnose (one DevOps Guru insight + correlation IDs instead of 40 alarms) — not in repair. Knowing which term dominates tells you where to invest; teams often over-invest in faster repair when their real cost is slow detection.
Static stability and cell-based architecture (advanced reliability)
Two ideas push availability past “Multi-AZ + failover.” Static stability means a system keeps working during a failure without needing to make a change — e.g., pre-provisioning enough capacity across AZs so that losing one AZ needs no scaling action (the control plane you’d depend on to react may itself be impaired during the event). Cell-based architecture partitions the service into independent cells, each a full stack serving a slice of customers, so a bad deploy or a poison request blasts only one cell — the blast radius is bounded by design, and you can deploy cell-by-cell. Both are how you buy the fifth nine when Multi-AZ alone plateaus at four.
On-call health is an operational metric
The people are part of the system. Track toil (manual, repetitive, automatable work) and treat a high-toil on-call as a defect — spend the error budget and engineering time to automate it away. A follow-the-sun rotation avoids night pages where team geography allows; page load, alert-to-action ratio, and time-on-call are health metrics for the operators, and a burned-out rotation is an availability risk as real as a missing replica.
Cost is an operational dimension
Observability and resilience are not free, and the cost runs away silently. High-cardinality custom metrics, verbose log ingestion, and full-fidelity tracing can quietly become a top-five line item; the discipline is tiered retention (hot in CloudWatch, warm in OpenSearch, cold in S3), sampling on high-volume traces, and treating the telemetry bill as a reviewed number. Likewise, an always-on warm-standby DR region is a permanent cost you are paying to shorten RTO — a deliberate purchase of a business outcome, which is exactly why the workload-to-tier map matters: you do not buy active/active for a workload whose downtime costs less than the standby.
Real-world enterprise scenario
Aurelius Health Systems is a fictional pan-India digital-health provider: ~₹9,400 crore revenue, a patient-facing app and clinician portal, a telemedicine platform, and a claims/billing back office, all on AWS across 42 accounts under a Control Tower landing zone, organized into a Patient Apps OU, a Clinical Platform OU, and a Corporate/Claims OU. The platform/SRE org runs roughly 2,600 EC2 instances, 180 ECS/EKS services, and a mix of Aurora, DynamoDB, and OpenSearch. The VP of Engineering sponsors an Operations-perspective uplift after a 3-hour telemedicine outage (a saturated NAT gateway that took 90 minutes just to diagnose) breached their patient-facing SLA. Here is how each capability plays out.
- Observability. They standardize on ADOT/OpenTelemetry, mandate structured JSON logs with a
correlation_id, and adopt CloudWatch Application Signals to define SLOs: telemedicine session-start availability 99.95%, p99 latency 800ms, with error budgets and burn-rate alarms. X-Ray service maps cover all 180 services; Synthetics canaries run the “book a consult → join call” journey from three regions every minute; tier-1 service-health dashboards live in Amazon Managed Grafana. Artifact: a telemetry standard + per-service SLO catalogue. - Event management (AIOps). EventBridge becomes the single operational bus; DevOps Guru (and DevOps Guru for RDS) ingests CloudWatch/X-Ray/Config. The NAT-saturation pattern that caused the outage now surfaces as one DevOps Guru insight with likely root cause instead of forty downstream alarms. Deterministic responses (scale ECS, fail over an Aurora reader) are wired EventBridge → SSM Automation. Artifact: an event pipeline with a documented auto-remediate-vs-page list and a tracked alert-to-action ratio (baseline 6%, target >40%).
- Incident and problem management. They stand up Systems Manager Incident Manager: a Sev-1 SLO-breach alarm now auto-creates an incident, pages the rotation, opens a Slack war room via AWS Chatbot, and starts the timeline within 60 seconds. A Sev-1/Sev-2 severity matrix is tied to error-budget burn. Every Sev-1/2 yields a blameless COE with corrective actions sprint-committed. Artifact: a severity matrix, response plans, on-call schedule, and a COE process with recurrence tracking.
- Change/release/configuration. All infra moves to CDK; Service Catalog + SCPs enforce approved patterns; pipelines (CodePipeline/CodeDeploy) deploy tier-1 services blue/green with automatic rollback on CloudWatch alarms. A standard-change catalogue auto-approves ~70% of changes. AWS Config (with an org aggregator and conformance packs) is the CMDB; SSM Inventory captures in-guest state. They start reporting DORA metrics; baseline change-failure-rate is 19%. Artifact: a change policy, IaC repos, and a Config-backed configuration record.
- Performance and capacity management. Scaling moves off CPU to queue-depth and p99-latency target-tracking; Karpenter handles EKS; Compute Optimizer drives a right-sizing pass that trims 14% off compute spend. Before flu-season peak they run Distributed Load Testing and reserve capacity with On-Demand Capacity Reservations for the telemedicine fleet, and raise Service Quotas ahead of demand. Artifact: a scaling-signal map, right-sizing report, and a capacity forecast tied to the seasonal calendar.
- Availability and continuity. Workloads are tiered: telemedicine and clinician portal = Tier-1 warm standby in a second region (RTO 15 min / RPO 1 min) via Aurora global database and Route 53 ARC routing controls; claims/billing = Tier-2 pilot light; internal tools = backup & restore. AWS Backup runs cross-region with Vault Lock immutability (a hard requirement given health data and ransomware risk). Resilience Hub scores each workload against its RTO/RPO policy; quarterly FIS game days fail over for real. Artifact: a workload→tier→DR map, backup policy, and game-day results with achieved-vs-target RTO/RPO.
- Patch management. Autoscaled and container fleets go immutable: EC2 Image Builder bakes weekly golden AMIs (patched, tested, distributed across 42 accounts) that roll out via the pipeline; Amazon Inspector continuously scans EC2/ECR/Lambda. True pets (a few legacy claims hosts) use Patch Manager baselines + maintenance windows. Patch SLA: critical CVEs ≤7 days, high ≤30; compliance reported in Security Hub, exceptions tracked with expiry. Artifact: a patch policy (immutable-first), Inspector-driven priority list, and a compliance/exception register.
Measurable outcome (9 months in): MTTD on the NAT-class failure dropped from 90 minutes to under 5 (single DevOps Guru insight + correlation IDs); telemedicine availability moved from 99.7% to 99.96%, inside SLO; change-failure-rate fell from 19% to 7% via blue/green + auto-rollback; a Q3 DR game day hit RTO 12 min against a 15-min target; compute spend dropped 14% from right-sizing; and patch compliance for critical CVEs reached 98% within the 7-day SLA. The 3-hour outage class has not recurred — the corrective action (NAT-gateway autoscaling + a DevOps Guru insight + a proven runbook) permanently retired it.
Deliverables & checklist
Common pitfalls
- Monitoring instead of observing. Host-up dashboards miss the partial, customer-visible failures that dominate distributed AWS estates. Avoid it by defining SLIs/SLOs from the user’s viewpoint, instrumenting traces (X-Ray/ADOT), and putting a correlation ID on every log line.
- Alert storms and alert fatigue. Forty alarms for one root cause trains on-call to ignore the pager. Avoid it by making the DevOps Guru insight (not the raw alarm) the alert unit, tracking alert-to-action ratio, and treating a low ratio as a defect.
- Firefighting without problem management. Restoring service but never doing the root-cause work means the same incident recurs monthly. Avoid it by separating incident from problem management and making blameless-COE corrective actions sprint-committed, owned, and recurrence-tracked.
- Change control that throttles or that’s absent. Heavy CABs push people to make undocumented out-of-band changes; no control causes drift and surprise outages. Avoid it with a wide standard-change catalogue, progressive delivery with auto-rollback, and AWS Config as the always-current record.
- DR as an untested binder. A plan you’ve never executed is a hypothesis; the real failover finds the stale runbook and the missing quota. Avoid it with Resilience Hub scoring and mandatory FIS/DR game days reporting achieved-vs-target RTO/RPO.
- Patching that drifts silently at scale. A few thousand instances quietly fall behind until one CVE becomes a breach. Avoid it with immutable-first patching (EC2 Image Builder), Inspector-driven prioritization, a severity-based patch SLA, and exception-with-expiry tracking — never a permanent blind spot.
Common beginner mistakes
These are conceptual traps — wrong mental models — distinct from the program-level pitfalls above. Fix the model and the practice follows.
-
“CAF Operations is the same as the Well-Architected Operational Excellence pillar.” No. The pillar is a per-workload design review (“is this app well-run?”). The CAF Operations perspective is an organisation-wide adoption discipline — the people, process, and tooling that let a whole company operate everything consistently. Right model: the pillar hardens one workload; the perspective builds the operating model that hardens every workload the same way.
-
“Observability is just more dashboards and monitoring.” No. Monitoring answers known questions (“is CPU > 80%?”); observability lets you ask new questions of a system you didn’t anticipate (“why only EU checkout, only since the 14:05 deploy?”). Right model: observability needs high-cardinality signals, traces, and a correlation ID on every line — you can’t add a dashboard for a failure you didn’t predict.
-
“SLA, SLO, and SLI are three words for the same thing.” No. SLI = the measured indicator (a ratio of good/total). SLO = your internal target for that indicator (99.95%). SLA = the contract with a customer, with penalties — always set looser than the SLO so you breach the objective (and react) long before the contract. Right model: SLI is the number, SLO is the goal, SLA is the promise-with-teeth.
-
“Incident management and problem management are the same activity.” No. Incident = restore service now (time-bounded, optimised for speed). Problem = find and kill the root cause so it never recurs (not time-bounded, optimised for learning). Right model: the incident ends when service is back; the problem ends when the corrective action ships. Skip the second and you firefight the same outage monthly.
-
“We should auto-remediate everything.” No. Auto-remediation of an unproven response can turn a small incident into a large one (flapping, cascading restarts). Right model: start conservative — page a human, run the runbook by hand — and promote a response to automatic only after it’s proven safe. Auto-remediate the known-knowns; page the rest.
-
“DR just means we have backups.” No. Backups are an RPO mechanism; they say nothing about RTO (how fast you’re running again) and nothing about whether they restore. Right model: DR is a tested RTO/RPO commitment — an untested backup is a hope, and a game day is what turns the hope into a number.
-
“Patching means SSH in and run
yum update.” No — at fleet scale that’s how drift and breaches happen. Right model: immutable-first — bake a patched golden AMI / rebuild the image and roll it through the pipeline (cattle, not pets); reserve in-place Patch Manager for the rare true pet, and even then automate, window, and report it against an SLA. -
“More alerts mean we’re safer.” No. Forty alarms for one root cause trains on-call to ignore the pager (alert fatigue), which makes you less safe. Right model: alert on symptoms the user feels (burn rate) and on correlated root cause (a DevOps Guru insight), not on every raw threshold — and treat a low alert-to-action ratio as a defect to fix.
Practice challenges
Work these in order — they escalate from beginner to advanced. Try each before opening the solution.
1 (Beginner) — Downtime budget. A tier-1 service commits to a 99.9% SLO over a rolling 30-day window. How many minutes of downtime is that per month, and what is that budget for?
<details> <summary>Solution</summary>
43,200 min × (1 − 0.999) = 43,200 × 0.001 = 43.2 minutes / 30 days. That budget is the team’s permission to take deploy risk; when it’s spent, the error-budget policy freezes non-critical changes until it recovers.
Why: error budget = (1 − SLO) × window — the single number that funds change velocity and triggers the freeze.
</details>
2 (Beginner) — Right signal for the question. For each question, name the telemetry signal that answers it: (a) “Is our p99 latency creeping up week over week?” (b) “Which exact request failed for customer c-9931, and what did it log?” © “Which downstream dependency added the 200 ms?”
<details> <summary>Solution</summary>
(a) Metrics (aggregated, cheap trend). (b) Logs (per-event detail, found via the correlation_id). © Traces (per-segment latency on the X-Ray service map).
Why: metrics/logs/traces answer trend / event / causal-path questions respectively — using the wrong one wastes an incident. </details>
3 (Intermediate) — Find the breaches. Write a CloudWatch Logs Insights query that counts, per 5-minute bucket, the StartSession events that were either non-200 or slower than 800 ms (the EMF field is SessionStartLatencyMs, status is StatusCode).
<details> <summary>Solution</summary>
fields @timestamp, correlation_id, SessionStartLatencyMs
| filter Operation = "StartSession" and (StatusCode != 200 or SessionStartLatencyMs > 800)
| stats count() as bad_events by bin(5m)
| sort @timestamp desc
Why: filter selects “bad” per the SLI definition, stats … by bin(5m) buckets it — this is the raw material the SLO and burn-rate alarm consume.
</details>
4 (Intermediate) — Classify the change. Classify each as standard, normal, or emergency, and say who approves it: (a) a pipeline deploy of a tested app version, blue/green with auto-rollback; (b) editing the production VPC route table by hand; © restarting a stuck service mid-Sev-1 to restore it.
<details> <summary>Solution</summary>
(a) Standard — pre-approved, no ticket (well-understood, automated, bounded blast radius). (b) Normal — human review (wide, hard-to-test blast radius). © Emergency — do it now, review after the fact.
Why: class = (well-understood + automated?) × (blast radius?); growing the standard catalogue is what makes safe changes fast and fully recorded. </details>
5 (Advanced) — Compound availability. A request traverses three serial components at 99.95%, 99.9%, and 99.99%. What is the end-to-end availability, does it meet a 99.9% SLO, and what’s the cheapest structural fix if it doesn’t?
<details> <summary>Solution</summary>
0.9995 × 0.999 × 0.9999 ≈ 0.99840 → 99.84%. It misses the 99.9% SLO (99.84 < 99.90) — a chain is less available than its weakest link. Cheapest fix: add parallel redundancy to the weakest component (the 99.9% one); two independent replicas give 1 − (1 − 0.999)² ≈ 99.9999%, lifting the chain above target.
Why: availability multiplies down serial dependencies and improves with parallel redundancy — attack the weakest serial link first. </details>
6 (Advanced) — Scaling target + DR tier. (a) An SQS-worker fleet must start each job within 20 s; measured processing time is 0.4 s/msg. What target backlog-per-task should the target-tracking policy use? (b) The workload loses ₹40 lakh per hour of downtime and can tolerate ~1 min of data loss. Which DR pattern fits?
<details> <summary>Solution</summary>
(a) One task clears 20 / 0.4 = 50 messages in 20 s → target backlog-per-task = 50. Emit messages_visible ÷ running_tasks as a custom metric and target-track to 50. (b) High downtime cost + seconds-of-data-loss tolerance → warm standby (scaled-down full stack always on in a second region, sub-second replication), not pilot light (too slow) or active/active (over-spend unless downtime is catastrophic).
Why: scale on the signal the SLO cares about (backlog, not CPU), and choose the DR tier from the cost of downtime, not from “how resilient can we be?” </details>
Glossary
- CAF (Cloud Adoption Framework) — AWS’s model organising cloud transformation into six perspectives (Business, People, Governance, Platform, Security, Operations). Here “CAF” is the framework, not a firewall.
- Operations perspective — the CAF perspective that ensures cloud services are delivered to a level that meets the business — an org-wide discipline, distinct from the per-workload Well-Architected Operational Excellence pillar.
- Observability — the ability to understand a system’s internal state from its outputs well enough to ask new questions, built on metrics, logs, and traces. Broader than monitoring (known questions only).
- SLI / SLO / SLA — Indicator (the measured good/total ratio), Objective (your internal target for it), Agreement (the customer contract, set looser than the SLO).
- Error budget —
(1 − SLO) × window; the allowed amount of failure. When spent, the error-budget policy freezes non-critical change. - Burn rate — how fast you’re consuming the error budget =
observed bad-rate ÷ budget-rate; multi-window multi-burn-rate alarms page on fast burn, ticket on slow burn. - EMF (Embedded Metric Format) — a CloudWatch JSON log convention that publishes metrics from a single structured log line, avoiding per-request
PutMetricDatacalls. - Correlation ID — a unique ID stamped on every log/metric/trace for one request so you can pivot across all three signals during an incident.
- ADOT / OpenTelemetry — AWS Distro for OpenTelemetry; vendor-neutral instrumentation so telemetry isn’t locked to one backend.
- AIOps — using ML to reduce operational noise: dedupe, correlate, and root-cause events so humans see signal, not a storm (e.g., Amazon DevOps Guru).
- Event — any observable change of state (an alarm, a config drift, a deploy, a quota breach); the unit an event pipeline (EventBridge) ingests and routes.
- MTTD / MTTA / MTTR / MTBF — mean time to detect / acknowledge / restore / between failures; MTTR decomposes into detect + ack + diagnose + repair + verify.
- Incident vs problem management — incident restores service now (time-bounded); problem kills the root cause so it never recurs (not time-bounded).
- COE / PIR — Correction of Error / Post-Incident Review; a blameless write-up producing owned, dated, sprint-committed corrective actions.
- Runbook vs playbook — a runbook is the automatable step-by-step fix (e.g., SSM Automation); a playbook is the broader human decision guide for a class of incident.
- CMDB — Configuration Management Database; the always-current record of resources and their relationships. On AWS, AWS Config is the CMDB, auto-populated.
- Drift — divergence between the declared (IaC) state and the running state; detected (CloudFormation drift detection / Config) rather than discovered in an audit.
- DORA metrics — deployment frequency, lead time for changes, change-failure-rate, time-to-restore; the data-driven scoreboard for change/release health.
- Standard / normal / emergency change — pre-approved low-risk automated change / human-reviewed higher-risk change / do-it-now-review-later change.
- Canary / blue-green — progressive-delivery deploy patterns that shift a slice of traffic first (canary) or run two environments and switch (blue-green), bounding blast radius with auto-rollback on alarm.
- Service quota — a per-account, per-region limit (e.g., Lambda 1,000 concurrent executions by default) that caps you before your code does; managed as a form of capacity.
- Backlog per task — messages-visible ÷ running-tasks; the correct target-tracking signal for queue-driven workers (scale on the SLO, not CPU).
- RTO / RPO — Recovery Time Objective (how fast you’re running again) and Recovery Point Objective (how much data you can lose).
- DR patterns — backup & restore → pilot light → warm standby → multi-site active/active, in increasing cost and decreasing RTO/RPO.
- Static stability — a system that keeps working through a failure without needing to make a change (don’t depend on a control plane that may itself be impaired).
- Cell-based architecture — partitioning a service into independent full-stack cells so a failure or bad deploy is contained to one cell.
- Game day / chaos engineering — deliberately injecting failure (AWS FIS) to prove resilience and measure achieved-vs-target RTO/RPO.
- Vault Lock — AWS Backup immutability that prevents backups being altered or deleted early — the ransomware defence for tier-1 data.
- Immutable infrastructure / golden AMI — replace rather than repair: bake a patched, tested AMI (EC2 Image Builder) and roll it out; cattle, not pets.
- Patch baseline / patch group / maintenance window — the approval rules for patches / the tag-based rollout order (dev before prod) / the approved low-traffic hours in which patching runs.
- OAM (Observability Access Manager) — CloudWatch cross-account observability: a central monitoring account (sink) that source accounts link to, so on-call sees the whole estate from one pane.
- Paved road — the platform team’s supported, opinionated default path (telemetry, pipelines, response plans) that product teams operate their services on while owning their own pager.
What’s next
This is the final perspective in the series — with Operations covered alongside Business, People, Governance, Platform, and Security, the next part returns to the Envision–Align–Launch–Scale loop to assemble these capabilities into a single, sequenced transformation roadmap and CAF Action Plan.