In a nutshell
Think of the Sustainability pillar as fuel efficiency for your cloud. A delivery company can cut emissions two ways: burn cleaner fuel, and get more deliveries out of every litre. The cloud is the same. You can run where the electricity is cleaner (fuel), and you can do more useful work per server-hour, per stored gigabyte, and per watt (efficiency). The pillar is the AWS playbook for both — and, conveniently, almost every move that lowers your carbon also lowers your bill.
Here is the one-sentence version: the Sustainability pillar asks you to maximize the useful work done per unit of resource consumed, so the energy, carbon, water, and hardware footprint of your workload shrinks over time. An idle server still burns power. A forgotten terabyte still spins on a disk. A workload pinned to a coal-heavy Region emits far more than the identical workload on a hydro-powered grid. Sustainability is the discipline of noticing that waste and engineering it out.
Naming note for beginners: this lesson’s file is
aws-waf-sustainability, and WAF here means Well-Architected Framework, not AWS WAF the Web Application Firewall. They are unrelated. Everything below is about architecture and efficiency, not firewalls.
The Framework splits the responsibility in two, the shared responsibility model for sustainability:
- AWS owns sustainability of the cloud — building efficient data centers, buying renewable energy, designing custom silicon, and driving toward net-zero. Amazon reports it matched 100% of its electricity consumption with renewable energy in 2023, and The Climate Pledge targets net-zero carbon by 2040. AWS also reports a low fleet-wide PUE (Power Usage Effectiveness, around 1.1–1.15 — energy into the building divided by energy that reaches the servers).
- You own sustainability in the cloud — the Region you pick, how tightly you scale to demand, how efficient your code is, how much data you hoard, which chips you run on, and how lean your pipelines are. That “in the cloud” half is what this lesson teaches, expressed as six improvement areas the Framework labels SUS 1 through SUS 6.
Underneath those six areas sit the pillar’s six design principles — the mindset the areas put into practice. Memorize these; they are the whole pillar in one breath:
- Understand your impact — measure before you optimize; establish proxy metrics.
- Establish sustainability goals — set targets against those proxies and track the trend.
- Maximize utilization — right-size and consolidate; idle capacity is pure waste.
- Anticipate and adopt new, more efficient offerings — move to newer, greener hardware and software as it ships.
- Use managed services — let AWS run shared infrastructure at fleet-wide efficiency you can’t reach alone.
- Reduce the downstream impact — cut the energy your workload pushes onto users’ devices and networks.
Level: Intermediate → Advanced · Time: ~60 min
Prerequisites — what to know first. You’ll get the most from this if you already understand basic AWS Regions and Availability Zones, EC2 and Auto Scaling, S3 storage classes, and the idea of a managed vs. self-managed service. A working sense of the other Well-Architected pillars helps too, because Sustainability constantly overlaps with them — especially Cost Optimization (carbon and cost usually move together) and Performance Efficiency (right-sizing is a shared lever). If S3 lifecycle tiering or Graviton are new to you, this lesson links to deeper dives on both at the points where they come up.
After this lesson you will be able to:
- Explain the shared responsibility model for sustainability and place any decision on the AWS side or your side of the line.
- Recite the six design principles and the six improvement areas (SUS 1–6) and say what each one changes.
- Choose a Region on carbon grounds, and know when not to (latency, residency).
- Define a proxy metric (e.g., gCO₂e per 1,000 requests) and explain why the Customer Carbon Footprint Tool can’t replace it for day-to-day decisions.
- Apply the demand, software, data, hardware, and deployment levers — scale-to-zero, event-driven design, S3 lifecycle tiering, Graviton/Inferentia, ephemeral non-production — and estimate the savings.
Where this fits
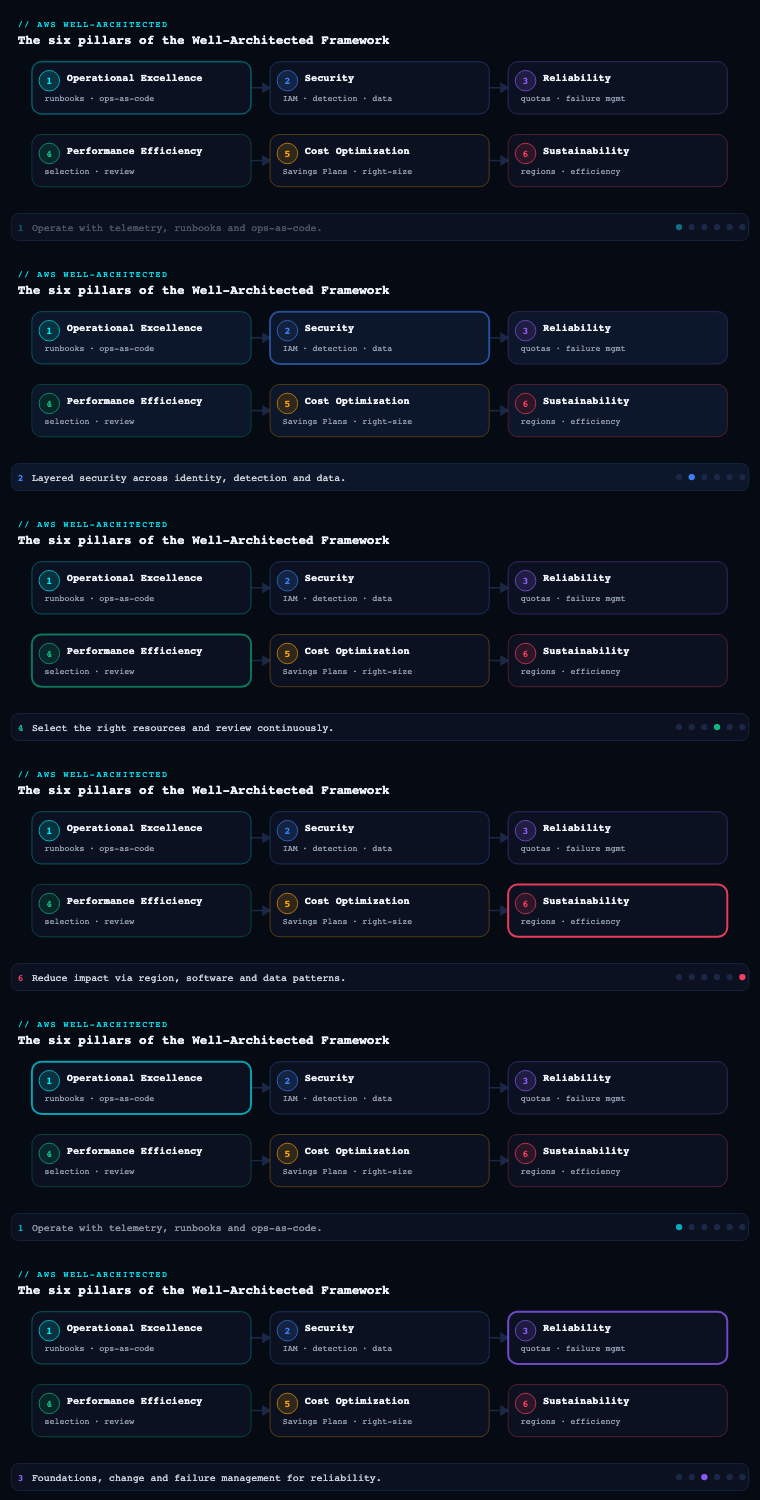
Sustainability is the sixth and newest pillar of the AWS Well-Architected Framework (added in late 2021, after Operational Excellence, Security, Reliability, Performance Efficiency, and Cost Optimization). Its single design goal is to maximize the useful work done per unit of resource consumed so that the carbon, energy, water, and embodied-material footprint of a workload falls over time. AWS frames this through the shared responsibility model for sustainability: AWS is responsible for sustainability of the cloud (efficient data centers, renewable-energy procurement, custom silicon, the path to net-zero), while you are responsible for sustainability in the cloud — the architecture, code, and data choices that govern how much of that infrastructure your workload actually draws on. The pillar decomposes into six improvement areas, each expressed as a numbered best-practice question (SUS 1 through SUS 6): Region selection, alignment to demand (user-behavior patterns), software and architecture patterns, data patterns, hardware patterns, and development and deployment process patterns. This article walks each area as you would implement it in a real AWS estate, naming the concrete metrics, artifacts, and services involved.
Before the six areas, internalize the pillar’s working method, because it is unusual: sustainability is hard to measure directly, so the Framework tells you to establish proxy metrics — energy, or more usefully a business-output-normalized metric such as “watt-hours per 1,000 requests,” “gCO₂e per active user,” or “vCPU-hours per transaction.” You set improvement targets against those proxies, evaluate every change for whether it raises useful work per resource, and treat the sustainability of your demand, data, and deployment as a continuous optimization — not a one-off audit. Keep that “maximize utilization, minimize total provisioned resources, normalize per unit of business value” lens active through every section below.
Region selection (SUS 1)
What it is. Region selection is the decision of where on the planet your workload physically runs, evaluated through a sustainability lens rather than only latency and cost. It maps to SUS 1 (“How do you select Regions for your workload?”). Two Regions running identical infrastructure can have very different carbon footprints because the local electricity grid has a different fuel mix, and because AWS’s renewable-energy matching varies by location.
Why it matters. Region choice is often the single highest-leverage sustainability decision you make, and it is essentially free to get right at design time and painful to change later. The grid carbon intensity of the bulk-power grid that feeds a data center can vary by an order of magnitude between a hydro- or nuclear-heavy grid and a coal-heavy one. Choosing the cleaner Region for a new, latency-insensitive workload can cut its operational emissions dramatically with zero code change.
How to do it well. Start from your hard constraints — data-residency and compliance, the latency your users can tolerate, and which services the workload needs (not every service is in every Region). Within the set of Regions that satisfy those constraints, prefer the one with the lowest grid carbon intensity and the strongest renewable matching. AWS publishes which Regions are powered by a high share of renewable energy and reports on its progress toward powering operations with 100% renewable energy; combine that with public grid-intensity data (e.g., the kind surfaced by Electricity Maps / WattTime) to rank candidates. For new, non-latency-critical work — batch analytics, ML training, async pipelines, dev/test — deliberately place it in a low-carbon Region even if it is not the closest one, since the user-facing latency penalty is irrelevant for asynchronous work. Keep latency-sensitive interactive traffic close to users, but push everything else toward the cleanest viable Region. Re-evaluate periodically: AWS continually brings new renewable projects online, so a Region’s profile improves over time, and your placement assumptions should be revisited.
| Decision input | Where it comes from | How it shapes Region choice |
|---|---|---|
| Data residency / compliance | Legal, GDPR/sovereignty rules | Hard filter — eliminates non-compliant Regions first |
| User latency budget | RUM / synthetic latency tests | Interactive traffic stays near users; async does not |
| Service & feature availability | AWS Regional Services List | Filters Regions lacking required services |
| Grid carbon intensity | Electricity Maps / WattTime, AWS renewable reporting | Rank survivors by gCO₂e/kWh; prefer the cleanest |
| Renewable matching status | AWS Sustainability site, CCFT trend | Prefer Regions AWS reports as renewable-powered |
Artifacts and decisions. A documented Region-selection decision record per workload (constraints considered, candidate Regions, the carbon ranking, and the final choice with rationale); a workload-placement map distinguishing latency-critical from latency-tolerant components; and a policy that new asynchronous/batch workloads default to a designated low-carbon Region. The recurring decision is the trade-off between proximity and grid cleanliness — resolve it by component, not by workload: it is entirely legitimate to serve the API from a near Region while running nightly training jobs in a far, clean one.
Worked example — ranking three Regions by carbon
Suppose you have a nightly batch job (recommendation-model retraining) that draws roughly 10,000 kWh per year of server energy. It is asynchronous — no user waits on it — so latency is irrelevant, and your only compliance constraint is “keep the data inside the US.” Three Regions survive that filter. The numbers below are illustrative (real grid-intensity figures come from Electricity Maps or WattTime, and AWS’s own renewable reporting), but they show the method:
| Candidate Region | Grid carbon intensity (illustrative) | Annual operational emissions of the job | Notes |
|---|---|---|---|
| Region A (coal-heavy grid) | ~500 gCO₂e/kWh | 10,000 kWh × 500 g = 5,000 kgCO₂e | Closest to your team, but dirtiest |
| Region B (hydro/nuclear grid) | ~50 gCO₂e/kWh | 10,000 kWh × 50 g = 500 kgCO₂e | Farther, but ~10× cleaner |
| Region C (mixed grid) | ~250 gCO₂e/kWh | 10,000 kWh × 250 g = 2,500 kgCO₂e | Middle of the road |
Same job, same kWh, a 10× swing in emissions — decided entirely by where it runs. Moving the retraining job from Region A to Region B cuts ~4,500 kgCO₂e/year with zero code change. That is why Region selection is the highest-leverage, lowest-effort decision in the whole pillar, and why you make it at design time: relocating a stateful workload later means data migration, replication re-plumbing, and re-testing.
The trade you must resolve is proximity vs. cleanliness, and you resolve it per component, not per workload. The user-facing API and CDN origin stay near users (latency wins there). The nightly training, the analytics batch layer, and dev/test go to the clean Region (nobody notices the extra 60 ms on a job that runs at 3 a.m.). Write it down as a Region-selection decision record per workload — constraints, candidates, the carbon ranking, the final pick — so the reasoning survives the person who made it.
One honest caveat for the advanced reader: AWS’s reported emissions use a market-based method that already credits its renewable-energy purchases, so the number AWS attributes to you may not swing as sharply as the raw grid intensity above suggests. The raw grid figure is still the right signal for the real-world atmosphere, and it is the number that improves fastest when you act. We unpack that market-based vs. location-based distinction in Going deeper.
Alignment to demand — user-behavior patterns (SUS 2)
What it is. This area is about scaling the resources you provision to match real demand as tightly as possible, and about influencing user and consumer behavior so that demand itself becomes more efficient. It maps to SUS 2 (“How do you take advantage of user-behavior patterns to support your sustainability goals?”). The core insight: every idle resource is pure waste — it consumes energy and embodied carbon while doing zero useful work.
Why it matters. Most environments are provisioned for peak (or peak-times-a-safety-factor) and then run far below that peak the vast majority of the time. The gap between provisioned and used capacity is the largest, most reliably recoverable source of wasted energy in a typical estate. Shrinking it directly raises the “useful work per resource” ratio the whole pillar optimizes for.
How to do it well. Eliminate the idle gap from both sides — supply and demand.
- Match supply to demand dynamically. Use EC2 Auto Scaling (target-tracking and predictive scaling), Application Auto Scaling for ECS/DynamoDB/Aurora, and Karpenter or the Cluster Autoscaler on EKS so capacity tracks load minute by minute instead of sitting at a static high-water mark. Adopt serverless where it fits — Lambda, Fargate, DynamoDB on-demand, Aurora Serverless v2 — so that with no requests there is (close to) no running compute, which is the ideal “scale to zero” behavior for sustainability.
- Stop paying for nights and weekends. Use AWS Instance Scheduler to stop non-production EC2/RDS outside business hours; a dev fleet that runs 50 hours a week instead of 168 cuts its energy roughly 70%.
- Shape the demand, not just serve it. Convert synchronous, always-on patterns into asynchronous, buffered ones: put work behind Amazon SQS / EventBridge and process it in batches, which lets you run fewer, better-utilized instances and shift work to off-peak (and lower-carbon) windows. Apply back-off, retry, and rate-limiting so misbehaving clients don’t generate wasteful load. Reduce the work that ever reaches your origin at all with caching — CloudFront and ElastiCache — and right-size the device experience (don’t push a 4K asset to a phone).
- Decommission ruthlessly. Track utilization with CloudWatch and Compute Optimizer; anything chronically near-idle is a candidate to consolidate, downsize, schedule, or delete.
| Lever | Mechanism | AWS service | Effect on the idle gap |
|---|---|---|---|
| Dynamic scaling | Target-tracking / predictive | EC2 Auto Scaling, Karpenter | Tracks load instead of static peak |
| Scale to zero | Serverless / on-demand | Lambda, Fargate, DynamoDB, Aurora Serverless v2 | Near-zero resource when idle |
| Time-based off | Stop non-prod off-hours | AWS Instance Scheduler | Removes nights/weekends (~70% of week) |
| Demand shaping | Queue + batch + off-peak | SQS, EventBridge, Batch | Fewer, fuller instances; shift to clean hours |
| Demand reduction | Caching, right-sized payloads | CloudFront, ElastiCache | Less origin work per user request |
Artifacts and decisions. A scaling policy per service (metric, target, min/max); a non-production scheduling calendar; a demand-shaping design that names which flows are async and buffered; and a utilization baseline that defines your “idle” threshold. The key decision is your minimum-capacity floor: set it too high and you re-create the idle gap; set it too low and you risk cold-start or scaling lag on real spikes — tune it against measured traffic, not guesses.
Worked example — what off-hours scheduling actually saves
The single most reliable win in SUS 2 is turning things off. A week has 168 hours. A development or staging fleet that nobody touches on nights and weekends only needs to be up during working hours. Do the arithmetic explicitly:
- Business hours ≈ 5 days × 9 hours = 45 hours/week running.
- Scheduled off the rest: 168 − 45 = 123 hours/week stopped.
- Energy (and on-demand cost) roughly tracks running hours, so you cut 123 ÷ 168 ≈ 73% of that fleet’s footprint — for free, with no architecture change.
AWS Instance Scheduler (a CloudFormation-deployed solution backed by DynamoDB tag schedules) does exactly this for EC2 and RDS. You tag resources with a schedule name and it starts/stops them on cron. A minimal tag-and-go looks like:
# Tag a dev instance so Instance Scheduler stops it outside a "office-hours" schedule
aws ec2 create-tags \
  --resources i-0abc123def4567890 \
  --tags Key=Schedule,Value=office-hours
The other half of SUS 2 is making production track demand instead of sitting at a static high-water mark. A target-tracking scaling policy keeps average CPU near a set point, adding capacity on the way up and — crucially for sustainability — removing it on the way down:
{
  "TargetValue": 55.0,
  "PredefinedMetricSpecification": {
    "PredefinedMetricType": "ASGAverageCPUUtilization"
  },
  "ScaleInCooldown": 300,
  "ScaleOutCooldown": 60
}
The scale-in behaviour is the sustainability lever: without it, a fleet that scaled out for a lunchtime spike never gives the capacity back. The ideal endpoint is scale-to-zero — Lambda, Fargate, DynamoDB on-demand, and Aurora Serverless v2 draw (almost) nothing when there are no requests, which no fixed fleet can match.
The one number to tune is the minimum-capacity floor. Set it too high and you rebuild the idle gap you just closed; set it too low and a real spike hits cold-starts or scaling lag. Tune it against your measured traffic trough, not a guess — and remember that “provisioned for peak, run flat 24/7” is the default failure mode this whole area exists to kill.
Software and architecture patterns (SUS 3)
What it is. This area covers the software-design and architecture choices that determine how much compute, memory, and network a workload needs to deliver a given outcome. It maps to SUS 3 (“How do you take advantage of software and architecture patterns to support your sustainability goals?”). It is the difference between two systems that do the same thing where one needs half the fleet.
Why it matters. Inefficient software taxes every resource underneath it forever. A hot loop that wastes CPU, a chatty service mesh, or an event handler that polls instead of reacts multiplies energy use across every instance and every hour the workload runs. Architecture is where you bank the largest structural efficiency gains — the ones that compound with scale.
How to do it well. Favor event-driven and asynchronous architectures over busy-wait and constant polling: an EventBridge/SQS-triggered Lambda consumes resources only when there is work, whereas a service polling every second burns CPU around the clock for nothing. Decompose monoliths so each component can be scaled and optimized independently — the right-sizing and scale-to-zero levers above only work cleanly on well-separated components. Move work off the synchronous request path: defer, batch, and queue anything the user doesn’t need to wait for. Choose efficient runtimes and algorithms — a workload’s language, framework, and data structures materially change its CPU and memory draw; offload heavy lifting to managed services (let Amazon handle the always-on plumbing of a database, queue, or search cluster at fleet-wide efficiency you can’t match per-workload). Right-size aggressively using AWS Compute Optimizer recommendations, and re-architect chronically over-provisioned services. Where it suits the workload, edge and on-device placement (CloudFront Functions, Lambda@Edge) cuts the round trips and origin compute per request.
| Anti-pattern | Why it wastes | Well-Architected pattern |
|---|---|---|
| Constant polling / busy-wait | Burns CPU with no work to do | Event-driven (EventBridge, SQS, Lambda) |
| Monolith scaled as one block | Must over-provision the whole to satisfy one hot part | Decoupled components scaled independently |
| Synchronous everything | Holds resources while the user waits | Async/queued for anything off the critical path |
| Self-managed always-on infra | Per-workload idle plumbing | Managed services at fleet-wide efficiency |
| Static, over-sized instances | Pays energy for headroom never used | Compute Optimizer-driven right-sizing |
Artifacts and decisions. An architecture decision record per major component justifying the synchronous-vs-async and managed-vs-self-managed choices on efficiency grounds; a Compute Optimizer right-sizing backlog; and a list of identified hot paths with their optimization status. The central decision is where to spend complexity: event-driven and decoupled designs are more efficient but harder to operate, so apply them where the resource savings (and scale) justify the added moving parts.
Worked example — polling vs. event-driven, counted out
“Event-driven over polling” sounds abstract until you count the wasted work. Take a service that reacts to new objects in an S3 bucket. New objects arrive maybe 200 times a day, unevenly.
The polling anti-pattern — a function (or a always-on container) checks every 5 seconds whether anything new showed up:
# Anti-pattern: busy-poll. Runs forever, mostly finding nothing.
while True:
    new = list_new_objects(bucket)     # a LIST call every tick
    if new:
        process(new)
    time.sleep(5)                       # 17,280 ticks/day
That is 17,280 wake-ups per day, of which ~200 do real work and ~17,080 do nothing — pure CPU, API calls, and (if it’s a running container) 24×7 energy for a job that is busy about 1% of the time. Utilization is abysmal.
The event-driven pattern — S3 emits an event to EventBridge (or directly to Lambda/SQS) only when an object actually lands, and the function runs only then:
# Pattern: invoked by the event itself. Runs ~200 times/day, each doing real work.
def handler(event, context):
    for record in event["Records"]:
        process(record)                 # 100% of invocations are useful work
Same outcome, ~200 invocations instead of 17,280, and zero idle compute between events. The resource-per-useful-unit ratio — the thing the whole pillar optimizes — improves by roughly two orders of magnitude.
The same logic scales up to architecture. Decompose a monolith so each component right-sizes and scales-to-zero independently (you can’t scale-to-zero one hot path inside a monolith). Push anything the user doesn’t wait for off the synchronous request path into SQS/EventBridge and batch it. And prefer managed services for the always-on plumbing: a self-managed database, queue, or search cluster carries its own idle footprint per workload, whereas Amazon runs the managed equivalent at a fleet-wide utilization you can’t reach in a single tenant. Efficient runtime and algorithm choices matter too — for serverless specifically, right-sizing a Lambda’s memory (which also sets its CPU) with a tool like Lambda Power Tuning often finds a setting that finishes faster and uses less total energy.
Data patterns (SUS 4)
What it is. This area covers how you classify, store, move, and retain data so that you keep the minimum data on the minimum-footprint medium for the minimum necessary time. It maps to SUS 4 (“How do you take advantage of data access and usage patterns to support your sustainability goals?”). Storage looks cheap and inert, but every byte you keep occupies a spinning disk or flash cell, gets replicated, gets backed up, and gets copied across networks — all of which consume energy indefinitely.
Why it matters. Data is the silent, ever-growing footprint. Unlike compute, which scales down when idle, stored data keeps consuming until you actively remove or demote it. Untiered logs, forgotten snapshots, duplicate datasets, and over-replicated archives quietly accumulate into one of the largest avoidable footprints in a mature estate.
How to do it well. Treat data lifecycle as a first-class sustainability control.
- Tier automatically by access pattern. Use S3 Lifecycle policies and S3 Intelligent-Tiering to move objects from Standard to Infrequent Access to Glacier Instant/Flexible Retrieval to Glacier Deep Archive as they cool. Colder tiers sit on lower-energy media, so matching the tier to real access frequency cuts the footprint of the same data.
- Set retention and actually delete. Define retention per data class and enforce it — S3 Lifecycle expiration, CloudWatch Logs and CloudTrail retention windows, DynamoDB TTL, and scheduled cleanup of orphaned EBS/RDS snapshots and unattached EBS volumes. Deleting data you are not required to keep is the cleanest possible win.
- Don’t move or duplicate more than you must. Minimize cross-Region replication and redundant copies to only what reliability and compliance genuinely require — every replica is a second full footprint. Use compression and efficient formats (columnar Parquet/ORC for analytics) so the same information occupies fewer bytes on disk and on the wire, and so query engines like Athena scan less data per query.
- Right-size durability and protection to the data’s value. Not everything needs maximum-redundancy storage or daily backups; align replication and backup frequency (managed via AWS Backup) to each dataset’s actual criticality.
- Find what you’ve forgotten. Use Storage Lens to surface cold, stale, and non-current-version data across the estate, and act on it.
| Data class | Access pattern | Target medium | Sustainability lever |
|---|---|---|---|
| Hot transactional | Frequent, low-latency | S3 Standard / DynamoDB / SSD | Keep small, cache, compress |
| Warm / occasional | Periodic | S3 IA / Intelligent-Tiering | Auto-tier on access frequency |
| Cold archive | Rare, recovery-only | Glacier Flexible / Deep Archive | Lowest-energy medium |
| Logs / telemetry | Decaying value | CloudWatch Logs + S3 + expiry | Retention + delete, don’t hoard |
| Analytics | Scan-heavy | Parquet/ORC in S3 + Athena | Columnar + compression = less scanned |
Artifacts and decisions. A data classification and retention matrix mapping each class to a storage tier and a deletion rule; lifecycle policies as code; a Storage Lens dashboard with a recurring cold-data review; and a replication/backup policy justified per dataset. The key decision is retention duration — anchor it to the actual legal/business requirement, not to “keep everything forever just in case,” because the default of infinite retention is the most expensive sustainability anti-pattern in storage.
Worked example — an S3 lifecycle policy that tiers and expires
Data is the footprint that never scales down on its own — a byte you wrote in 2022 is still spinning today unless you tell AWS to move or delete it. The fix is to make the lifecycle a policy, not a good intention. Here is a concrete S3 Lifecycle configuration that tiers cooling data onto lower-energy media and deletes it when retention expires:
{
  "Rules": [
    {
      "ID": "tier-and-expire-logs",
      "Filter": { "Prefix": "logs/" },
      "Status": "Enabled",
      "Transitions": [
        { "Days": 30,  "StorageClass": "STANDARD_IA" },
        { "Days": 90,  "StorageClass": "GLACIER" },
        { "Days": 180, "StorageClass": "DEEP_ARCHIVE" }
      ],
      "Expiration": { "Days": 365 },
      "NoncurrentVersionExpiration": { "NoncurrentDays": 30 }
    }
  ]
}
Apply it with:
aws s3api put-bucket-lifecycle-configuration \
  --bucket my-log-bucket \
  --lifecycle-configuration file://lifecycle.json
Read it top to bottom the way S3 acts on it: for the first 30 days the object is hot and in Standard; at day 30 it drops to Standard-Infrequent Access; at day 90 it moves to Glacier Flexible Retrieval; at day 180 it lands in Glacier Deep Archive, the lowest-energy, lowest-cost tier; at day 365 it is deleted. The NoncurrentVersionExpiration line is the one people forget — in a versioned bucket, every overwrite leaves an old version quietly accruing footprint, so you expire non-current versions too. If access patterns are unpredictable, S3 Intelligent-Tiering does the tiering automatically based on observed access, which is often the safer default.
The second data lever is scanning less of what you keep. Store analytics data as a columnar, compressed format — Parquet or ORC — instead of raw JSON/CSV. A query that needs 3 of 40 columns reads only those 3 column chunks, so an Athena query might scan, say, 50 GB instead of 500 GB for the same answer. Athena bills (and spends energy) per byte scanned, so a 10× reduction in bytes scanned is a ~10× reduction in the query’s compute and cost — the same information, a fraction of the work. Round it out by right-sizing durability (not every dataset needs cross-Region replication or daily backups) and by using S3 Storage Lens to surface the cold, stale, and non-current data you’ve already forgotten. For the full storage-class mechanics, see the S3 storage-classes deep dive.
Hardware patterns (SUS 5)
What it is. This area is about choosing the most efficient underlying hardware for the work and using the least of it — picking instance types and accelerators whose performance-per-watt is highest, and minimizing the total devices you provision. It maps to SUS 5 (“How do your hardware management and usage practices support your sustainability goals?”). It also accounts for embodied carbon — the emissions baked into manufacturing the hardware — which you amortize better by using fewer devices at higher utilization.
Why it matters. The same workload on a more efficient processor draws materially less energy for the same result, and AWS’s custom silicon offers some of the best performance-per-watt available. Beyond energy, minimizing the count of physical devices reduces the embodied-carbon share of your footprint, since manufacturing emissions are fixed per device and only get amortized through high utilization and long, effective use.
How to do it well. Migrate compute to AWS Graviton (Arm-based) instances wherever the workload supports it — Graviton consistently delivers better performance-per-watt (AWS cites large energy-efficiency gains versus comparable x86 instances), and most managed services (Lambda, Fargate, RDS, ElastiCache, OpenSearch, EMR) offer a Graviton option, so the migration is frequently a configuration change plus a recompile/test pass. For ML, use purpose-built accelerators — AWS Trainium for training and AWS Inferentia for inference — which are designed for far higher throughput-per-watt than running the same models on general-purpose GPUs, and which let you do more ML work for the same energy. Use the newest instance generation for a given family, since each generation typically improves efficiency. Maximize utilization through bin-packing (consolidate workloads onto fewer, fuller hosts with ECS/EKS and Karpenter, which actively consolidates underutilized nodes), and prefer managed services so AWS runs the hardware at fleet-wide utilization you cannot reach in a single-tenant fleet. Use Spot capacity for fault-tolerant work to consume otherwise-idle pooled capacity efficiently. Right-size with Compute Optimizer, including its recommendations to move to Graviton.
| Workload | Less efficient default | Efficient hardware choice | Why it’s better |
|---|---|---|---|
| General compute / web / microservices | x86 (Intel/AMD) | AWS Graviton (Arm) | Higher performance-per-watt; lower energy per request |
| ML training | General-purpose GPU | AWS Trainium | Purpose-built throughput-per-watt for training |
| ML inference | General-purpose GPU | AWS Inferentia | Far better inferences-per-watt at scale |
| Fragmented small instances | Many under-used hosts | Bin-pack via Karpenter / ECS | Fewer devices; better embodied-carbon amortization |
| Fault-tolerant batch | On-demand only | Spot | Uses pooled idle capacity efficiently |
Artifacts and decisions. A hardware-migration plan (which services move to Graviton, in what order, with the compatibility/test gate); an ML accelerator decision for training vs inference; a utilization target per cluster with a bin-packing strategy; and a “newest-generation by default” instance policy. The core decision is the Graviton migration trade-off: the efficiency win is large, but it requires validating Arm compatibility for native dependencies — prioritize the high-volume, long-running services where the per-watt savings compound, and stage the migration behind tests.
Worked example — Graviton perf-per-watt and bin-packing
Hardware efficiency has two dials: pick chips with more work-per-watt, and use fewer of them at higher utilization so their embodied carbon (the emissions baked into manufacturing) is amortized well.
Dial one — the chip. AWS Graviton (Arm-based) processors are the headline move: AWS states Graviton3 delivers the same performance using up to 60% less energy than comparable x86 instances for certain workloads. Because most managed services offer a Graviton option, the switch is frequently a configuration change plus a recompile-and-test pass. In an Auto Scaling launch template it can be as small as choosing an Arm instance type and an Arm AMI:
resource "aws_launch_template" "api" {
  name          = "api-graviton"
  instance_type = "m7g.large"          # m7g = Graviton3; was m6i.large (x86)
  image_id      = data.aws_ami.al2023_arm64.id   # an arm64 AMI
}
The catch to validate is architecture compatibility: native dependencies and container images must be built for arm64 (or multi-arch). That is exactly what the Graviton migration lesson covers — multi-arch builds and benchmarking — so prioritize the high-volume, long-running services where the per-watt saving compounds, and stage the move behind your test suite. For ML, the equivalent move is off general-purpose GPUs onto purpose-built silicon: AWS Trainium for training and AWS Inferentia for inference, both designed for far higher throughput-per-watt on their respective jobs.
Dial two — utilization and device count. Imagine 20 microservices each pinned to its own lightly used node — say 20 nodes at 15% CPU. Every one of those nodes carries a full share of manufacturing (embodied) carbon whether it’s busy or not. Bin-pack them with Karpenter (or ECS) and the same work consolidates onto, say, 5 nodes at ~60% CPU. You just quartered the device count. Fewer physical devices means the fixed embodied carbon is spread over far more useful work, and Karpenter actively consolidates — it notices underused nodes, reschedules their pods, and terminates the emptied nodes:
# Karpenter: let it choose Graviton (arm64) Spot capacity and consolidate idle nodes
apiVersion: karpenter.sh/v1
kind: NodePool
metadata: { name: default }
spec:
  disruption:
    consolidationPolicy: WhenEmptyOrUnderutilized   # actively bin-packs down
  template:
    spec:
      requirements:
        - { key: kubernetes.io/arch, operator: In, values: ["arm64"] }
        - { key: karpenter.sh/capacity-type, operator: In, values: ["spot"] }
Add Spot for fault-tolerant work (it consumes otherwise-idle pooled capacity), adopt a newest-generation-by-default instance policy (each generation is typically more efficient), and let Compute Optimizer — which now recommends Graviton moves directly — drive the right-sizing backlog.
Development and deployment process patterns (SUS 6)
What it is. This area covers the process by which you build, test, and operate the workload — keeping development and operational overhead lean, adopting efficiency improvements quickly, and measuring the sustainability impact of changes. It maps to SUS 6 (“How do your development and deployment processes support your sustainability goals?”). The principle: the pipeline, the test estate, and the unused features are part of the footprint too.
Why it matters. A surprising share of cloud energy goes to non-production — sprawling dev/test/staging environments, build farms that idle between commits, redundant pre-production copies, and stale resources nobody owns. And the speed at which you can ship matters for sustainability: if adopting a more efficient instance type, runtime, or service takes six months of manual change, you forgo months of savings. Automation and a tight feedback loop turn efficiency from a project into a habit.
How to do it well. Keep non-production small and ephemeral — spin environments up on demand and tear them down after use (Infrastructure as Code with CloudFormation/AWS CDK/Terraform, ephemeral preview environments, Instance Scheduler on what must persist) rather than running full-time clones of production. Build on managed CI/CD (CodePipeline / CodeBuild or your platform) so the build fleet itself scales to demand instead of idling. Adopt new efficient technologies fast by keeping the path to change short: automated tests, canary/blue-green deploys, and IaC let you roll out a Graviton move or a runtime upgrade safely and quickly. Measure the impact of changes against your proxy metrics, and crucially, use the AWS Customer Carbon Footprint Tool (CCFT) in the Billing console to track your estate’s estimated emissions over time and validate that your optimizations actually move the number — close the loop so sustainability decisions are evidence-based, not assumed. Reduce unused surface area: retire features, environments, and resources that no longer earn their footprint, and feed utilization data (CloudWatch, Compute Optimizer, Storage Lens) back into the backlog as recurring sustainability work.
| Process lever | Anti-pattern | Well-Architected pattern | AWS support |
|---|---|---|---|
| Non-prod environments | Full-time prod clones | Ephemeral, on-demand, scheduled-off | IaC (CDK/CFN), Instance Scheduler |
| Build infrastructure | Always-on build servers | Demand-scaled managed CI/CD | CodeBuild / CodePipeline |
| Adopting efficiency gains | Slow, manual, risky rollouts | Fast, tested, canary/blue-green | Deploy pipelines, automated tests |
| Knowing if it worked | Assume savings | Measure emissions trend | Customer Carbon Footprint Tool |
| Unused surface area | Accumulates silently | Periodic retirement of stale resources | CloudWatch, Compute Optimizer, Storage Lens |
Artifacts and decisions. An IaC standard mandating ephemeral non-production; a CCFT-based emissions trend report reviewed on a regular cadence; a sustainability backlog fed by utilization/right-sizing findings; and a definition-of-done that includes the proxy-metric impact of significant changes. The key decision is what to measure as your business-output proxy — pick a normalized KPI (e.g., gCO₂e or watt-hours per 1,000 requests or per active user) that ties resource use to value delivered, so growth in usage doesn’t masquerade as a sustainability regression.
Worked example — ephemeral preview environments and reading the CCFT
Two ideas make SUS 6 concrete: stop paying for non-production that no user touches, and actually measure whether your changes worked.
Ephemeral non-production. The anti-pattern is three full-time staging clones of production running 24×7 so a handful of engineers can test occasionally. The pattern is an environment that exists only while a pull request is open. With IaC (CDK, CloudFormation, or Terraform), a CI job creates a stack on PR open and destroys it on merge:
# On PR open — stand up an isolated preview stack
cdk deploy PreviewStack-$PR_NUMBER --require-approval never

# On merge/close — tear it down so it stops consuming anything
cdk destroy PreviewStack-$PR_NUMBER --force
A preview stack that lives for the few hours a PR is open, instead of a clone that runs 8,760 hours a year, is a rounding error by comparison. Pair it with demand-scaled managed CI/CD (CodeBuild spins build capacity up per commit and back down after) so the build fleet itself doesn’t idle, and with fast, tested canary/blue-green pipelines so you can actually adopt efficiency gains — a Graviton move or a runtime upgrade — in weeks, not quarters. A change you can’t ship safely is a saving you forgo.
Reading the Customer Carbon Footprint Tool (CCFT). The CCFT lives in the AWS Billing and Cost Management console and reports your estimated emissions in MTCO₂e (metric tons of CO₂-equivalent), following the Greenhouse Gas Protocol, broken down by service and by geography, alongside an estimate of emissions you avoided versus a comparable on-premises setup and a forecast as AWS approaches 100% renewable. Treat it as your trend line: enable it, capture a baseline, and review the curve on a regular cadence (monthly is common) to confirm your optimizations actually bend the number.
The essential caveat — and the reason the whole pillar leans on proxy metrics — is that the CCFT is a lagging, coarse estimate: data appears roughly three months late, at monthly granularity, at the account/service level. There is no real-time, per-workload carbon API you can wire into a dashboard or A/B against a single deploy. So you close the loop with two instruments: the CCFT for the slow, authoritative trend, and a business-output-normalized proxy (gCO₂e or watt-hours per 1,000 requests, per active user, per transaction) that you can compute from CloudWatch and billing data in near-real-time for sprint-level decisions. The AWS Well-Architected Tool ties this together — its Sustainability lens walks you through the SUS questions and records milestones so the improvement process is tracked, not remembered.
Real-world enterprise scenario
StreamForge Media is a fictional ad-supported video-streaming company: ~12 million monthly active users, a 60-engineer platform org across four teams, and a workload that includes a customer-facing API, a video-transcoding pipeline, a recommendations ML system, and a large analytics/data-lake estate. They run primarily in us-east-1 for historical reasons, with everything (prod, staging, dev, and the build farm) provisioned for peak and running 24/7. A board-level ESG commitment to cut operational emissions per active user by 40% within a year forces them to apply the Sustainability pillar end to end. They begin by enabling the Customer Carbon Footprint Tool to set a baseline and defining a proxy KPI: gCO₂e per 1,000 minutes streamed.
Region selection. They keep the latency-sensitive streaming API and CDN origin near users, but audit their asynchronous workloads — nightly transcoding, recommendation-model training, and the analytics batch layer — none of which are latency-critical. Cross-referencing AWS renewable-Region reporting with grid-intensity data, they relocate transcoding, ML training, and the data-lake batch jobs to a lower-carbon Region, capturing a large operational-emissions cut on those components with no user-facing latency change. They record a Region-selection decision per workload and set a policy that new async/batch services default to the clean Region.
Alignment to demand (user-behavior). Their fleet was sized for prime-time peak and ran flat all day. They move the API to EC2 Auto Scaling with predictive scaling, put the transcoding workers on AWS Batch with Spot, and schedule all non-production with AWS Instance Scheduler (dev/staging now run ~50 hrs/week, not 168). They convert transcoding from synchronous-on-upload to SQS-buffered batch processed in off-peak, lower-carbon windows, and push more delivery to CloudFront to cut origin work. Idle gap on the API fleet drops from roughly 65% to under 20%.
Software and architecture. A profiling pass finds a recommendations service polling a feature store every second; they re-architect it to EventBridge-driven updates, eliminating constant idle CPU. They decompose the transcoding monolith so each stage scales independently and offload session/state to managed ElastiCache and DynamoDB instead of self-managed always-on instances. Compute Optimizer drives a right-sizing pass across 40+ over-provisioned services.
Data patterns. The data lake had years of un-tiered logs and orphaned snapshots. They apply S3 Intelligent-Tiering and Lifecycle rules (Standard → IA → Glacier Deep Archive), set CloudWatch Logs and CloudTrail retention windows, add DynamoDB TTL on ephemeral tables, and script cleanup of unattached EBS volumes and stale RDS snapshots. They convert analytics datasets to Parquet so Athena scans far less per query. Storage Lens surfaces 300+ TB of cold, non-current data they expire. Total stored footprint falls sharply.
Hardware patterns. They migrate the API, ElastiCache, RDS, and Lambda functions to AWS Graviton, validated behind their test suite, for a substantial per-request energy reduction. ML training moves to AWS Trainium and inference to AWS Inferentia, doing the same ML work at far better throughput-per-watt. Karpenter bin-packs the EKS fleet onto fewer, fuller Graviton nodes, improving embodied-carbon amortization, and a “newest-generation by default” policy is adopted.
Development and deployment. Non-production becomes ephemeral: PR preview environments spin up via AWS CDK and tear down on merge, replacing three full-time staging clones. Builds move to demand-scaled CodeBuild. Blue-green pipelines let them roll out the Graviton and runtime changes in weeks, not quarters. The Customer Carbon Footprint Tool trend, reviewed monthly, confirms the savings are real, and right-sizing findings feed a standing sustainability backlog.
Measurable outcome. Within the year: gCO₂e per 1,000 minutes streamed falls 47% (beating the 40% target); API fleet idle drops from ~65% to <20%; ~60% of compute now runs on Graviton/Trainium/Inferentia; stored data footprint down ~35% after expiring 300+ TB of cold data and tiering the rest; non-production energy down ~70% from scheduling and ephemeral environments; and — a co-benefit — the AWS bill falls by a low-seven-figure annual sum, since nearly every sustainability move (less idle, fewer/efficient instances, less stored data) is also a cost move.
Going deeper
The six areas are the what. This section is the why underneath, for the reader who has to defend these choices in an architecture review or an ESG report.
The shared responsibility line, in detail
Sustainability splits exactly like security does, and getting the split right prevents both complacency and wasted effort.
AWS’s side — sustainability of the cloud — is a set of levers you benefit from but do not control: data-center efficiency (a low PUE, the ratio of total facility energy to energy delivered to compute — AWS reports a fleet-wide figure around 1.1–1.15, versus ~1.5–2.0 for a typical enterprise data center); renewable energy procurement (Amazon reports matching 100% of its electricity with renewables in 2023, and targets net-zero carbon by 2040 under The Climate Pledge); custom silicon (Graviton, Trainium, Inferentia, Nitro) that raises work-per-watt; and water and materials stewardship. The practical takeaway: moving a workload to AWS at all typically improves its efficiency versus self-hosting, because you inherit that PUE and renewable mix — but that is a one-time step-change, not an ongoing license to be wasteful.
Your side — sustainability in the cloud — is everything this lesson teaches. The trap is assuming AWS’s renewable goals mean your workload is “already green, nothing to do.” They don’t: a bloated, idle, over-replicated workload still draws more of that (finite, shared) efficient infrastructure than it needs, and that marginal draw is yours to minimize.
Why there is no per-workload carbon API — and what to do instead
The CCFT is built on the Greenhouse Gas Protocol and reports market-based emissions — a method that credits AWS’s renewable-energy purchases against its consumption. That is the correct accounting standard, but it has two consequences you must design around:
- It lags and it’s coarse. ~3-month delay, monthly buckets, account/service granularity. You cannot see the carbon of one Lambda function this afternoon.
- Market-based ≠ location-based. The location-based number reflects the actual grid your electrons came from (the raw gCO₂e/kWh of that Region’s grid at that time). The market-based number reflects AWS’s contracts. These can diverge sharply: a workload on a physically coal-heavy grid can show a low market-based figure because AWS bought renewable credits, even though the local grid still burned coal to serve that load in that hour.
This is why the pillar insists on proxy metrics. You approximate carbon from things you can measure in real time — vCPU-hours, GB-months of storage, GB of data transfer, watt-hour estimates — normalized per unit of business value. The proxy is what you optimize sprint to sprint; the CCFT is what you check quarterly to confirm the proxy is telling the truth.
| Instrument | Granularity | Latency | Use it for |
|---|---|---|---|
| Customer Carbon Footprint Tool | Account / service / geography, MTCO₂e | ~3 months | The authoritative long-run trend |
| Proxy metric (e.g., Wh / 1,000 req) | Per workload / per component | Near real-time | Day-to-day and per-deploy decisions |
| Grid intensity (Electricity Maps / WattTime) | Region / grid, gCO₂e/kWh | Real-time-ish | Region choice and carbon-aware timing |
Carbon-aware computing — and its honest limits
For flexible workloads you can shift work to when or where the grid is cleaner: temporal shifting (run the nightly batch during the hours the local grid has the most wind/solar) and spatial shifting (send it to a cleaner Region). Signals from WattTime or Electricity Maps drive this. The advanced nuance: because AWS reports market-based emissions, temporal/spatial shifting may not move AWS’s reported number much (its renewable matching is largely annual/contractual), yet it genuinely reduces the real-world, location-based grid impact in that hour. Do it for the atmosphere, and know which number it moves. Spatial shifting to a structurally cleaner Region is the more reliable win of the two.
Embodied carbon, Scope 3, and utilization
Operational energy is only part of the footprint; embodied carbon — the emissions from manufacturing the servers, chips, and racks (largely Scope 3) — is fixed per device and paid whether the device is busy or idle. The only way to amortize it well is high utilization over a long effective life: 20 nodes at 15% waste most of their embodied carbon; 5 nodes at 60% doing the same work amortize it four times better. This is the deep reason bin-packing, managed services (multi-tenant, high-utilization by design), and serverless (utilization is Amazon’s problem, at fleet scale) are sustainability wins beyond just saving running watts.
Where Sustainability tensions with the other pillars
Sustainability is not free of trade-offs, and Well-Architected reviews exist to surface them honestly:
| Tension | Sustainability wants | The other pillar wants | How to resolve |
|---|---|---|---|
| vs. Reliability | Fewer replicas, less redundancy | Multi-AZ/Region redundancy, spare capacity | Right-size redundancy to the actual RTO/RPO, not maximal everywhere |
| vs. Performance | Tighter right-sizing, scale-to-zero | Headroom, warm capacity, low p99 | Accept scale-to-zero cold-starts only where latency budget allows |
| vs. Cost | A clean far Region for async work | The cheapest Region | Usually aligned; when they diverge, decide per component with data |
Cost and carbon usually move together — nearly every lever here (less idle, fewer instances, less stored data) cuts both — but not always, which is exactly why you measure carbon on its own evidence.
The Jevons trap and measuring intensity vs. absolutes
One rigor point that separates a real sustainability program from theater: efficiency gains can increase total consumption (the Jevons paradox) — make something 2× more efficient and teams often use it 3× as much. So track both your normalized intensity (gCO₂e per unit of business value — is each unit getting greener?) and your absolute emissions (is the total actually falling, or just the per-unit number while growth swamps it?). A 47% cut in gCO₂e-per-1,000-requests is a real engineering win even if total emissions rise with a doubling user base — but you must report both numbers, or you’re hiding the ball.
Turning it into a tracked plan
Operationalize all of this with the AWS Well-Architected Tool: run the workload through the Sustainability lens, answer the SUS questions (each best practice carries an ID like SUS04-BP03), record milestones so you can see improvement over time, and feed high-risk items into a backlog. The Framework’s improvement process is a loop, not a project: identify targets (proxy metrics) → evaluate improvements → prioritize and deploy → measure against the CCFT and your proxies → repeat. Region profiles improve as AWS adds renewables, new efficient instances ship, and your usage shifts — so the review is recurring, not one-and-done.
Deliverables & checklist
Common pitfalls
- Optimizing everything except Region. Teams tune code and instances while ignoring the single highest-leverage choice — where the workload runs. Fix: at design time, place every latency-tolerant component in the cleanest viable Region; it is free carbon savings you can never recover as cheaply later.
- Provisioning for peak and leaving it there. A fleet sized for prime-time that runs flat 24/7 wastes most of its energy on idle headroom. Fix: dynamic scaling, scale-to-zero serverless, and off-hours scheduling so capacity tracks real demand — the largest reliably recoverable footprint in any estate.
- Treating storage as free and infinite. “Keep everything forever just in case” silently grows into one of the biggest avoidable footprints. Fix: a classification + retention matrix, automatic tiering to Glacier, real deletion rules, and a recurring Storage Lens cold-data sweep.
- Mistaking cost for the only signal. Cost and carbon usually move together, but not always (a clean far Region may cost more than a dirty near one). Fix: measure emissions explicitly with the Customer Carbon Footprint Tool against a normalized KPI, so sustainability is decided on its own evidence — not assumed from the bill.
- Forgetting non-production and pipelines. Full-time staging clones and always-on build farms are pure overhead that no user ever touches. Fix: ephemeral IaC environments, demand-scaled CI/CD, and scheduling — non-production should be a fraction of production’s footprint, not a mirror of it.
- Skipping the Graviton/accelerator migration as “too much effort.” Staying on general-purpose x86/GPU forgoes the largest per-watt hardware wins available. Fix: stage a tested migration to Graviton for high-volume services and to Trainium/Inferentia for ML, prioritizing the long-running workloads where per-watt savings compound.
Practice challenges
Work these in order — they escalate from recall to design. Try each before opening the solution.
1. (Beginner) Match the areas. Without scrolling up, name the six Sustainability improvement areas SUS 1 → SUS 6, and state which one is usually the single highest-leverage decision.
<details> <summary>Solution</summary>
SUS 1 Region selection, SUS 2 Alignment to demand (user-behavior patterns), SUS 3 Software and architecture patterns, SUS 4 Data patterns, SUS 5 Hardware patterns, SUS 6 Development and deployment process patterns. The highest-leverage decision is usually Region selection (SUS 1) — it can swing operational emissions by an order of magnitude for zero code change.
Why: the six areas are the backbone of the pillar; if you can’t list them you can’t audit against them. </details>
2. (Beginner) Do the off-hours math. A dev/test fleet currently runs 24×7. You schedule it to run only 45 hours a week. Roughly what percentage of its energy (and on-demand cost) do you remove?
<details> <summary>Solution</summary>
A week is 168 hours. Running 45 means stopping 123. 123 ÷ 168 ≈ 73% removed. Implement with AWS Instance Scheduler by tagging the instances with a schedule.
Why: eliminating idle non-production time is the most reliable, zero-architecture win in SUS 2. </details>
3. (Intermediate) Write the lifecycle rule. Write an S3 Lifecycle rule for objects under logs/ that transitions to Standard-IA at 30 days, to Glacier Flexible Retrieval at 90 days, and deletes at 365 days.
<details> <summary>Solution</summary>
{
  "Rules": [{
    "ID": "logs-tier-expire",
    "Filter": { "Prefix": "logs/" },
    "Status": "Enabled",
    "Transitions": [
      { "Days": 30, "StorageClass": "STANDARD_IA" },
      { "Days": 90, "StorageClass": "GLACIER" }
    ],
    "Expiration": { "Days": 365 }
  }]
}
Apply with aws s3api put-bucket-lifecycle-configuration --bucket <b> --lifecycle-configuration file://lifecycle.json.
Why: stored data never scales down on its own — tiering to lower-energy media and actually deleting is SUS 4’s core lever, and it must be a policy, not a hope. </details>
4. (Intermediate) Rank Regions by carbon. A latency-insensitive batch job uses ~8,000 kWh/year. Region X grid = 400 gCO₂e/kWh, Region Y = 40 gCO₂e/kWh. Compute each Region’s annual emissions and pick one. What single constraint could still veto the cleaner choice?
<details> <summary>Solution</summary>
Region X: 8,000 × 400 = 3,200 kgCO₂e/yr. Region Y: 8,000 × 40 = 320 kgCO₂e/yr. Pick Region Y (10× cleaner) since the job is async and latency doesn’t matter. A data-residency / compliance rule (the data must stay in a specific jurisdiction) could veto it — residency is a hard filter applied before the carbon ranking.
Why: Region choice dominates operational emissions, but hard constraints (residency, required services) filter the candidate set first. </details>
5. (Advanced) Design a proxy KPI. Your team wants to know, sprint by sprint, whether a serverless (Lambda + DynamoDB + S3) API is getting more sustainable. Propose a proxy metric and explain in one or two sentences why the Customer Carbon Footprint Tool alone can’t answer the question.
<details> <summary>Solution</summary>
Use a business-output-normalized proxy such as watt-hours (or gCO₂e) per 1,000 API requests, estimated from Lambda GB-seconds, DynamoDB consumed capacity, and S3/data-transfer usage pulled from CloudWatch and billing. The CCFT can’t answer it because it’s a lagging (~3-month), coarse (monthly, account/service-level) estimate with no per-workload, real-time API — it validates the long-run trend but can’t inform a sprint-level decision.
Why: the pillar runs on proxies precisely because there is no live per-workload carbon signal; the CCFT is the trend check, not the control loop. </details>
6. (Advanced) Explain the carbon-aware nuance. A team proposes shifting a flexible batch job to whichever hour the local grid is cleanest (“carbon-aware scheduling”). Explain, using market-based vs. location-based emissions, when this meaningfully helps and which number it actually moves.
<details> <summary>Solution</summary>
Temporal shifting reduces the location-based impact — the real grid’s gCO₂e/kWh in that hour — so it genuinely helps the atmosphere. But AWS reports market-based emissions, which already credit its (largely annual/contractual) renewable purchases, so your CCFT number may barely move. It helps most on physically dirty grids with high renewable variability; spatial shifting to a structurally cleaner Region is the more reliable win because it changes the underlying grid you draw from, not just the hour.
Why: conflating the two accounting methods leads teams to over-credit carbon-aware timing; knowing which number moves keeps the program honest. </details>
Common beginner mistakes
These are misconceptions — the wrong mental model that leads you astray — distinct from the architectural traps in Common pitfalls above.
-
“WAF here means the Web Application Firewall.” It does not. In this lesson WAF = Well-Architected Framework, and this is its Sustainability pillar. AWS WAF (the firewall) is a completely separate service. If you went looking for rules and IP sets, you’re in the wrong lesson. Right model: Well-Architected is an architecture-review framework of six pillars; Sustainability is the sixth.
-
“The Customer Carbon Footprint Tool tells me the carbon of this deploy.” No — it’s a lagging (~3-month), coarse (monthly, account/service-level) estimate, with no real-time per-workload API. Teams waste time trying to A/B a single change against it. Right model: use a near-real-time proxy metric (Wh or gCO₂e per unit of business value) for decisions; use the CCFT only to confirm the quarterly trend.
-
“Cheaper always means greener, so I’ll just follow the bill.” Usually true, occasionally false. A clean far Region can cost more than a dirty near one; a Savings Plan lowers your bill without changing a single watt; Spot changes cost more than energy. Right model: cost and carbon are strongly correlated but separate signals — measure carbon explicitly against a normalized KPI so you catch the cases where they diverge.
-
“AWS is going net-zero and runs on renewables, so my workload is already green — nothing to do.” That’s AWS’s side of the line (of the cloud). Your bloated, idle, over-replicated workload still draws more of that shared efficient infrastructure than it needs. Right model: shared responsibility — AWS owns the data centers and energy mix; you own the Region, scaling, code, data, and hardware choices in the cloud.
-
“Serverless is auto-magically sustainable, so efficiency doesn’t matter there.” Scale-to-zero is a huge win, but a running Lambda still burns energy, and an under- or over-provisioned memory setting wastes it. Right model: right-size Lambda memory (which also sets CPU) — often a setting exists that finishes faster and uses less total energy — and keep the code efficient.
-
“Sustainability is a one-time audit — do it once and tick the box.” Region carbon profiles improve as AWS adds renewables, new efficient instances ship, and your traffic grows (and efficiency gains can be eaten by more usage — the Jevons paradox). Right model: it’s a continuous improvement loop, and you track both per-unit intensity and absolute emissions so growth can’t hide a regression.
-
“Move everything to the cleanest Region.” Do that to interactive, latency-sensitive, or residency-bound components and you’ll hurt users or break compliance. Right model: resolve proximity-vs-cleanliness per component — latency-critical traffic stays near users; async/batch/dev goes to the clean Region.
Glossary
- Well-Architected Framework (WAF). AWS’s architecture-review framework of six pillars; here, not the Web Application Firewall. The Sustainability pillar is the sixth (added late 2021).
- Sustainability pillar. The pillar whose goal is to maximize useful work per unit of resource consumed, lowering a workload’s carbon, energy, water, and material footprint over time.
- Shared responsibility model (for sustainability). AWS is responsible for sustainability of the cloud (data centers, renewables, silicon); you are responsible for sustainability in the cloud (Region, scaling, code, data, hardware choices).
- Design principles. The pillar’s six mindsets: understand your impact; establish goals; maximize utilization; anticipate/adopt efficient offerings; use managed services; reduce downstream impact.
- Improvement process. The pillar’s loop: identify targets (proxies) → evaluate → prioritize and deploy → measure → repeat.
- SUS 1–6. The six improvement areas/questions: Region selection, alignment to demand, software & architecture, data, hardware, development & deployment. Best-practice IDs look like
SUS04-BP03. - Proxy metric. A measurable stand-in for carbon (e.g., watt-hours or gCO₂e per 1,000 requests, per active user, per transaction) used for real-time decisions because no per-workload carbon API exists.
- Customer Carbon Footprint Tool (CCFT). The AWS Billing-console tool that estimates your emissions in MTCO₂e by service and geography; lagging (~3 months) and coarse — a trend line, not a per-deploy signal.
- gCO₂e / MTCO₂e. Grams / metric tons of CO₂-equivalent — greenhouse gases normalized to the warming effect of CO₂.
- Greenhouse Gas (GHG) Protocol. The standard the CCFT follows; splits emissions into Scope 1 (direct), Scope 2 (purchased energy), Scope 3 (value chain, incl. manufacturing).
- Market-based vs. location-based emissions. Market-based credits AWS’s renewable-energy contracts (what the CCFT reports); location-based reflects the actual physical grid mix. They can diverge sharply.
- PUE (Power Usage Effectiveness). Total facility energy ÷ energy delivered to compute. Lower is better; AWS reports a fleet-wide ~1.1–1.15 vs. ~1.5–2.0 for typical enterprise data centers.
- Grid carbon intensity. The gCO₂e emitted per kWh of a given electricity grid; varies ~10× between clean (hydro/nuclear) and dirty (coal) grids. Sourced from Electricity Maps / WattTime.
- Renewable energy matching. AWS purchasing renewable energy equal to its consumption; Amazon reports reaching 100% in 2023, targeting net-zero by 2040 (The Climate Pledge).
- Embodied carbon. Emissions from manufacturing the hardware (largely Scope 3); fixed per device and amortized only through high utilization and long effective life.
- AWS Graviton. Arm-based AWS CPUs with higher performance-per-watt; AWS cites up to ~60% less energy for the same performance vs. comparable x86 on some workloads.
- AWS Trainium / Inferentia. Purpose-built ML chips for training (Trainium) and inference (Inferentia), with far higher throughput-per-watt than general-purpose GPUs.
- Right-sizing. Matching instance/memory size to actual need, removing paid-for-but-idle headroom; driven by AWS Compute Optimizer.
- Bin-packing. Consolidating workloads onto fewer, fuller hosts (via Karpenter/ECS) to raise utilization and amortize embodied carbon.
- Scale-to-zero. Consuming (near) no resource when there is no demand — Lambda, Fargate, DynamoDB on-demand, Aurora Serverless v2.
- S3 Lifecycle / Intelligent-Tiering. Rules (or automatic behavior) that move objects to lower-energy storage classes as they cool, and expire them on schedule.
- Glacier (Instant / Flexible / Deep Archive). S3’s cold storage classes on the lowest-energy media for rarely accessed, recovery-only data.
- S3 Storage Lens. Analytics that surface cold, stale, and non-current data across the estate for cleanup.
- AWS Instance Scheduler. A solution that starts/stops tagged EC2/RDS on a schedule to eliminate off-hours running.
- Karpenter. A Kubernetes node autoscaler that provisions right-sized capacity and consolidates underused nodes (bin-packing down).
- Carbon-aware computing. Shifting flexible work in time (to cleaner grid hours) or space (to cleaner Regions); moves the location-based number more than the market-based one.
- Jevons paradox. Efficiency gains can increase total consumption — why you track absolute emissions, not just per-unit intensity.
- Well-Architected Tool. The AWS console tool for running a pillar review (including the Sustainability lens) and tracking improvement via milestones.
What’s next
This concludes the AWS Well-Architected Framework series: with Sustainability covered alongside Operational Excellence, Security, Reliability, Performance Efficiency, and Cost Optimization, the next step is to run the AWS Well-Architected Tool review across all six pillars to turn these practices into a prioritized, tracked improvement plan for your own workloads.