In a nutshell
Imagine you run the facilities for a huge office building where electricity is metered and anyone can flip a switch. People leave lights, servers, and air-conditioners running in empty rooms all night, and the bill only lands 30 days later. You could slash the bill to zero by cutting the power — but then nobody could work. The real job is subtler: light the rooms that earn their keep, know who left which lights on, get a cheaper tariff for the load you run around the clock, put timers and motion-sensors on the rest, and keep revisiting the plan as tariffs and appliances change. That is exactly what the Cost Optimization pillar of the AWS Well-Architected Framework asks you to do for cloud spend.
The pillar’s headline idea is the one beginners most often get backwards: the goal is not to spend the least — it is to get the most business value for every rupee or dollar. Turning everything off is “cheap” and useless. Sometimes the right move is to spend more on a workload that drives revenue, and ruthlessly cut an idle test environment nobody remembers launching. Cost Optimization is the discipline that lets you tell those two apart, on purpose, continuously.
Heads-up on a confusing name: in this lesson WAF means the Well-Architected Framework, not the AWS WAF web-application-firewall service. They share three letters and nothing else. The file is called
aws-waf-cost-optimizationbecause it is the Cost Optimization pillar of the Well-Architected Framework — one of six sibling pillar lessons. No firewalls here.
Level: Beginner-friendly, builds to Advanced · Time: ~63 min read
Prerequisites — helpful but not required. You will get more from this if you already know, at a beginner level: what an AWS account and the AWS Organizations multi-account model are; roughly what EC2, S3, RDS, Lambda, and Auto Scaling do; and that AWS is billed pay-as-you-go (per-second or per-GB, after the fact). If any of those are fuzzy, skim the earlier fundamentals lessons first — this lesson re-explains each cost-relevant idea as it comes up, so you can also just keep reading.
After this lesson you will be able to:
- Explain the five Cost Optimization design principles and the five best-practice areas (COST 1–11) in plain language, and say why “value, not minimization” is the whole point.
- Set up the core visibility stack — Cost Explorer, AWS Budgets, cost-allocation tags, Cost Categories, and Cost Anomaly Detection — and read a bill by team, service, and unit cost.
- Pick the right purchasing model for a workload — On-Demand, Savings Plans, Reserved Instances, or Spot — and size a commitment from data instead of guessing.
- Right-size with Compute Optimizer, apply Graviton, and sequence work correctly as usage first, then rate.
- Shape and schedule demand (auto scaling, buffering, throttling, non-prod stop/start) and run cost optimization as a continuous flywheel, not a one-off sprint.
Where this fits
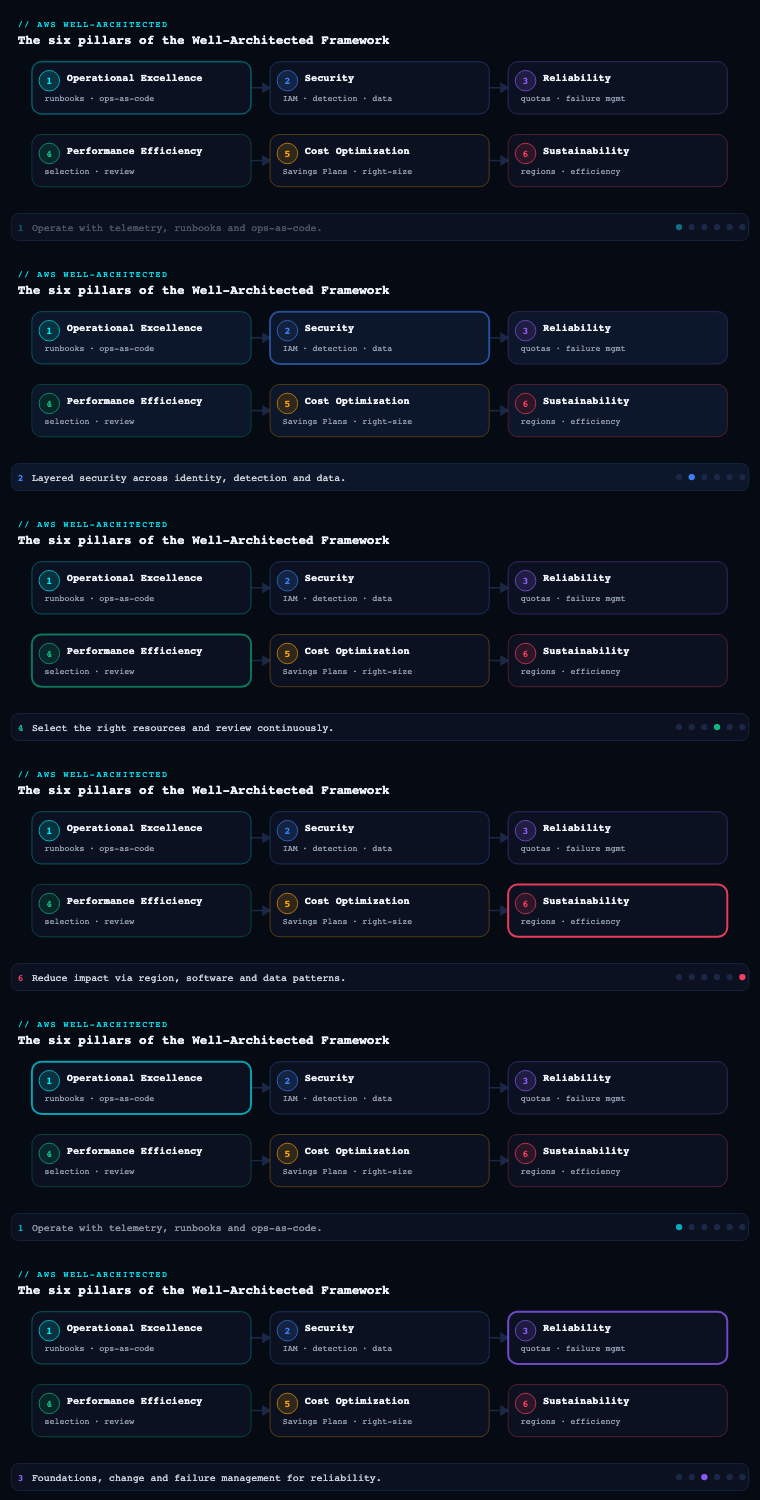
Cost Optimization is the fifth of the six pillars in the AWS Well-Architected Framework (after Operational Excellence, Security, Reliability, and Performance Efficiency, and before Sustainability). Its design principles set the tone for everything below — implement Cloud Financial Management, adopt a consumption model, measure overall efficiency, stop spending money on undifferentiated heavy lifting, and analyse and attribute expenditure — and its goal is explicitly not “spend the least”; it is to deliver the maximum business value for the lowest price point, which sometimes means spending more on a revenue-driving workload and ruthlessly cutting an idle one. The pillar decomposes into five best-practice areas — practice Cloud Financial Management, expenditure and usage awareness, cost-effective resources, manage demand and supply resources, and optimize over time — and the Framework expresses its expectations as numbered best-practice questions (COST 1 through COST 11). This article walks each area as you would actually implement it in a multi-account AWS organization, naming the concrete services, artifacts, and trade-offs.
Practice Cloud Financial Management (COST 1)
What it is. Cloud Financial Management (CFM) is the operating model for cost — the people, process, and culture that make cost a first-class, continuously-managed property of your workloads rather than a monthly invoice surprise. It maps to COST 1 (“How do you implement cloud financial management?”) and is the AWS framing of what the industry calls FinOps. It establishes a function (often a Cloud Cost Center of Excellence), a partnership between finance, engineering, and the business, and a cadence that runs the optimization flywheel as normal operations.
Why it matters. Cloud spend is variable, self-service, and post-paid — any engineer can launch a GPU instance at 2 a.m. and finance learns about it 30 days later on the bill. No tool saves an organization where nobody owns that dynamic. The single biggest predictor of cloud cost outcomes is not which Savings Plans you bought; it is whether the engineers who provision resources can see, and are accountable for, what those resources cost. CFM is the area that creates that accountability, and it deliberately frames the objective as value, not minimization — the recurring question is “is this spend earning its keep?”, the only framing that lets you increase spend where it pays off and cut where it does not.
How to do it well.
- Establish a function and a partnership. Stand up a small central Cloud Cost Center of Excellence (CCoE / FinOps team) that owns tooling, commitment purchasing, and standards, while workload teams own their own usage and budgets — central buys rate, the edge controls usage. Make finance, engineering, procurement, and product co-owners, not adversaries.
- Adopt the FinOps lifecycle. Run the Inform → Optimize → Operate phases from the FinOps Foundation: give engineers visibility and allocation (Inform), drive rate and usage improvements (Optimize), and embed accountability into day-to-day operations (Operate).
- Make spend visible to the people who cause it. Publish per-team cost dashboards and put the bill in front of engineers in the tools they already use, so cost is a real-time engineering signal, not a quarterly finance read-out.
- Run a regular review cadence. Hold a recurring (monthly is typical) cost review covering Trusted Advisor / Compute Optimizer recommendations, Savings Plans and Reserved Instance utilization and coverage, anomaly investigations, the unit-cost trend, and the top movers — with actions and owners, like any operational review.
- Account for personnel time and toil. Automating teardown, right-sizing, and reporting is itself a cost optimization; treat engineer hours as a real cost line and invest in self-service guardrails so teams move fast without finance-by-ticket.
| CFM discipline | What it establishes | Primary AWS mechanism |
|---|---|---|
| Function & accountability | A CCoE plus federated team ownership | Org structure, named cost owners, RACI |
| Visibility (Inform) | Engineers see their own spend | Cost Explorer, AWS Budgets, dashboards |
| Optimize | Rate + usage improvement backlog | Compute Optimizer, Cost Optimization Hub, Trusted Advisor |
| Operate | Continuous cadence & forecasting | Monthly cost review, Budgets forecasts |
| Toil reduction | Automated, self-service guardrails | IaC, scheduled cleanup, Service Catalog |
Artifacts and decisions. A FinOps/CFM charter (mission, roles, cadence); a RACI for cost roles; a cost-review meeting series with a standing agenda; a central-vs-federated operating model decision; and a KPI scorecard (unit cost, coverage, utilization, % allocable spend, forecast accuracy). The key decision is the operating model: fully centralized cost control throttles teams and breeds resentment; fully federated control yields no economies of scale on commitments — the durable answer is a thin central function that buys rate and sets standards, with usage owned at the edge.
Worked example — the unit-cost calculation that changes the conversation. The single most powerful artifact a new FinOps function produces is not a dashboard of dollars; it is a unit-economics metric — cost divided by a business driver. Picture a team whose bill grew from ₹40 lakh to ₹52 lakh in a year (a scary-looking +30%). Beginners panic and start deleting things. A FinOps engineer instead divides by the driver:
| Month | Monthly cost | Streaming-hours served | Unit cost (₹ / 1,000 hrs) |
|---|---|---|---|
| Last year | ₹40,00,000 | 620 million | ₹64.5 |
| This year | ₹52,00,000 | 900 million | ₹57.8 |
The bill rose 30%, but the workload grew 45%, so the unit cost actually fell ~10% — the team got more efficient while spending more. Without the unit metric you cannot see that, and you cannot defend the extra spend to finance. This is why “measure overall efficiency” is a design principle: watch the ratio, not the raw rupees. Pick a driver that tracks the value the workload delivers (streaming-hours, orders, active tenants, API calls, GB indexed) and headline that.
Worked example — a minimal monthly cost review. CFM is a cadence, not a tool. A workable first agenda, timeboxed to 45 minutes, with an owner on every line:
- Unit-cost trend (5 min) — is ₹/driver going up or down? Up is the alarm, not the total bill.
- Top movers (10 min) — the three services/accounts that changed most month-over-month, with a one-line “why.”
- Commitment health (10 min) — Savings Plans / RI coverage (how much eligible usage is discounted) and utilization (how much of what you bought you used); anything under ~95% utilization is leaking money.
- Recommendations (10 min) — new Compute Optimizer / Cost Optimization Hub / Trusted Advisor items, each assigned to a team’s backlog.
- Anomalies (5 min) — what Cost Anomaly Detection flagged and what it turned out to be.
- Actions (5 min) — owners and dates. No action, no point.
Central buys rate, the edge controls usage. The one CFM design decision that trips up every org is who owns cost. The durable pattern is a thin central function (the CCoE / FinOps team) that owns the levers needing scale — commitment purchasing (one org-wide Savings Plan portfolio beats fifty tiny ones), tagging standards, and shared tooling — while each product team owns their own usage and their own budget. Fully centralized control becomes finance-by-ticket and teams resent it; fully federated control means nobody negotiates the org-wide rate. Thin-center, strong-edge is the answer the mature FinOps orgs converge on, and it maps directly to how AWS consolidated billing works: the management (payer) account buys commitments that float across every member account automatically.
Expenditure and usage awareness (COST 2, COST 3, COST 4)
What it is. Awareness is your ability to govern, monitor, and attribute cloud spend — to know who is spending what, on which workload, against which budget, and to stop runaway or unapproved spend before it lands on the invoice. It spans three best-practice questions: governing usage (COST 2 — policies, account structure, guardrails), monitoring usage and cost (COST 3 — the data and tooling to see spend), and decommissioning resources (COST 4 — finding and removing what you no longer need).
Why it matters. You cannot optimize, budget, or even discuss what you cannot see and cannot attribute. A bill that is 30% “untagged / unallocable” is a bill no team is accountable for. And because cloud is self-service, governance (what is allowed) and monitoring (what is happening) are the two halves of keeping spend inside the envelope — governance is preventive, monitoring is detective, and the awareness area is where you build both so an anomaly is caught in minutes rather than discovered a month later.
How to do it well — govern. Use AWS Organizations with a sane OU and account structure so spend is naturally segmented by team, environment, and workload — the account is the cleanest cost-allocation boundary AWS gives you. Apply service control policies (SCPs) to deny expensive or unapproved choices (GPU instance families outside a data-science OU, disallowed Regions, public resources). Enforce a cost-allocation tagging taxonomy (CostCenter, Owner, Environment, Application, Project) and require it with AWS Organizations tag policies; activate those keys as cost allocation tags in the billing console so they appear in your cost data. Where account/tag boundaries don’t match how finance reports, group spend with AWS Cost Categories (rules that roll resources up into business dimensions like business unit or product line).
How to do it well — monitor. Use AWS Cost Explorer for interactive analysis (filter and group by service, account, tag, or Cost Category; view amortized vs unblended cost; forecast). For the source-of-truth, granular data, export the Cost and Usage Report (CUR 2.0) via AWS Data Exports to S3 and query it with Amazon Athena or load it into Amazon QuickSight for executive dashboards. Set AWS Budgets at every meaningful scope (account, OU via Cost Categories, tag) with actual and forecasted thresholds, and wire AWS Budgets Actions to act — apply a restrictive SCP/IAM policy or stop EC2/RDS instances when a non-prod budget is breached. Turn on AWS Cost Anomaly Detection (ML-based) so a sudden spike — a runaway loop, a leaked key mining crypto, a misconfigured autoscale — is caught independently of any threshold. The AWS Billing and Cost Management console and AWS Cost Optimization Hub consolidate the recommendation surface.
How to do it well — decommission. Idle resources bill forever. Find and remove unattached EBS volumes, unassociated Elastic IPs, idle load balancers, old snapshots, orphaned NAT gateways, and stale dev resources using Trusted Advisor cost checks, AWS Config rules, and scheduled queries. Codify teardown so environments don’t linger past their purpose.
| Awareness capability | What it answers | AWS service |
|---|---|---|
| Governance / account boundary | Who is allowed to spend, and where | AWS Organizations, OUs, SCPs |
| Cost allocation | Whose spend is this? | Cost allocation tags, tag policies, Cost Categories |
| Interactive analysis | Where is the money going? | AWS Cost Explorer |
| Granular source of truth | The line-item detail for any question | CUR 2.0 via Data Exports → Athena / QuickSight |
| Budgeting & enforcement | Are we inside the envelope (and act if not) | AWS Budgets + Budgets Actions |
| Anomaly detection | Did something spike unexpectedly? | AWS Cost Anomaly Detection |
| Decommissioning | What can we safely delete? | Trusted Advisor, AWS Config, scheduled cleanup |
Artifacts and decisions. A tagging standard enforced by tag policy with an allocability KPI; a Cost Categories definition mapping accounts/tags to business units; a budget hierarchy with owners and actions; a CUR 2.0 + Athena/QuickSight reporting pipeline; an anomaly-detection configuration with a triage owner; and a recurring orphaned-resource report. Key decisions: how to model cost allocation (by account, by tag, or by Cost Category — usually all three at different scopes), and whether to use AWS Billing Conductor for custom chargeback/showback rate cards when internal pricing differs from AWS list pricing.
Worked example — read the bill from the command line. Before any optimization, prove you can see spend. Cost Explorer has an API, so “top services last month, grouped by service” is one call (representative output — no live run here):
# Top spend by service for August, unblended cost
aws ce get-cost-and-usage \
  --time-period Start=2026-08-01,End=2026-09-01 \
  --granularity MONTHLY \
  --metrics "UnblendedCost" \
  --group-by Type=DIMENSION,Key=SERVICE \
  --output table
Two subtleties beginners miss. First, the End date is exclusive — End=2026-09-01 means “through 31 August.” Second, UnblendedCost is the raw on-invoice rate; when you own Savings Plans or RIs you almost always want AmortizedCost instead, which spreads a commitment’s cost evenly so a team’s dashboard does not show a misleading $0 on the days the commitment “paid” for their usage.
Worked example — enforce the tag taxonomy (governance is preventive). A tag standard nobody enforces is a wish. AWS Organizations tag policies make the tag mandatory-shaped, and you activate the key as a cost-allocation tag so it shows up in Cost Explorer and the CUR:
{
  "tags": {
    "CostCenter": {
      "tag_key":   { "@@assign": "CostCenter" },
      "tag_value": { "@@assign": ["streaming", "billing", "analytics", "platform"] },
      "enforced_for": { "@@assign": ["ec2:instance", "rds:db", "s3:bucket"] }
    }
  }
}
Pair it with a service control policy (SCP) so genuinely expensive choices are impossible, not merely discouraged — here, GPU families anywhere outside the data-science OU:
{
  "Version": "2012-10-17",
  "Statement": [{
    "Sid": "DenyGpuOutsideML",
    "Effect": "Deny",
    "Action": "ec2:RunInstances",
    "Resource": "arn:aws:ec2:*:*:instance/*",
    "Condition": {
      "StringLike": { "ec2:InstanceType": ["p4d.*", "p5.*", "g5.*", "g6.*"] }
    }
  }]
}
Remember the evaluation order: an SCP is a guardrail on the maximum permissions an account can have — it can only take permissions away, never grant them, and an explicit Deny here wins over any Allow in the account’s own IAM. (Deeper SCP mechanics live in AWS Organizations & SCP guardrails.)
Worked example — a budget that acts, not just emails. A budget wired only to an inbox is documentation. Create it with a forecasted threshold for early warning, then attach a Budgets Action so a non-prod breach does something:
# 1) A monthly budget for the non-prod environment (via activated tag)
aws budgets create-budget \
  --account-id 123456789012 \
  --budget '{ "BudgetName": "nonprod-monthly",
              "BudgetLimit": { "Amount": "5000", "Unit": "USD" },
              "TimeUnit": "MONTHLY", "BudgetType": "COST",
              "CostFilters": { "TagKeyValue": ["user:Environment$nonprod"] } }' \
  --notifications-with-subscribers \
    '[{ "Notification": { "NotificationType": "FORECASTED",
         "ComparisonOperator": "GREATER_THAN", "Threshold": 80,
         "ThresholdType": "PERCENTAGE" },
        "Subscribers": [{ "SubscriptionType": "EMAIL",
         "Address": "finops@example.com" }] }]'
Then a create-budget-action with --action-type APPLY_IAM_POLICY (attach a restrictive deny policy) or an SSM STOP_EC2_INSTANCES action so the system throttles the offender in minutes rather than after the month closes.
Worked example — the source-of-truth query. Cost Explorer is for exploring; the Cost and Usage Report (CUR 2.0), exported via AWS Data Exports to S3 and queried in Athena, is the line-item truth for any question Cost Explorer cannot answer:
SELECT  line_item_usage_account_id            AS account,
        product_servicecode                   AS service,
        SUM(line_item_unblended_cost)         AS unblended_cost
FROM    cur2_database.cur2_table
WHERE   billing_period = '2026-08'
  AND   line_item_line_item_type = 'Usage'
GROUP BY 1, 2
ORDER BY unblended_cost DESC
LIMIT 20;   -- representative
If you export in the newer FOCUS 1.0 format instead, the columns are vendor-neutral (BilledCost, ServiceName, SubAccountId) so the same query works across AWS, Azure, and GCP bills — the point of the FinOps FOCUS standard. Turn on Cost Anomaly Detection as well (ce create-anomaly-monitor with MonitorType=DIMENSIONAL, MonitorDimension=SERVICE) so a spike is caught by ML in hours, independently of any threshold you remembered to set.
Cost-effective resources (COST 5, COST 6, COST 7, COST 8)
What it is. This is the heart of the pillar: choosing the right service, the right resource type and size, and the right pricing model, and accounting for data-transfer cost. It spans evaluating cost when selecting services (COST 5), matching resource type and size to need — right-sizing (COST 6), choosing the best pricing model — Savings Plans, Reserved Instances, Spot, On-Demand (COST 7), and planning for data-transfer charges (COST 8). It is where the two genuinely different cost levers live: paying a lower rate for a unit of capacity (pricing models) versus picking the right shape and size of resource (service selection and right-sizing).
Why it matters. On-Demand is the most expensive way to run a stable baseline — you pay a premium for the right to walk away at any second, a right you never exercise on a database that runs 24/7. Pricing-model optimization recovers that premium and, on a seven-figure compute bill, is frequently the single largest lever available, requiring no code change. Right-sizing eliminates waste at the full rate and compounds with rate optimization, because right-sizing shrinks the baseline you then commit to. And data transfer is the line item teams forget until the invoice arrives — cross-AZ, cross-Region, and NAT-gateway egress can quietly dominate.
How to do it well — service selection (COST 5). The biggest cost win is often changing the shape: prefer managed and serverless services over self-managed IaaS so you stop paying for idle and for undifferentiated heavy lifting — AWS Lambda, AWS Fargate, Amazon Aurora Serverless v2, Amazon DynamoDB on-demand, Amazon S3 with Intelligent-Tiering. Price competing designs against the same usage assumptions with the AWS Pricing Calculator before you build.
How to do it well — right-sizing (COST 6). Resize from telemetry, not guesswork. Use AWS Compute Optimizer (it analyses CloudWatch metrics across EC2, EC2 Auto Scaling groups, EBS, Lambda, ECS-on-Fargate, RDS, and recommends a better instance type/size or memory setting) and Trusted Advisor to find under-utilized resources. Move to Graviton (Arm) instances where supported for a strong price/performance step-change. Re-run on a cadence — right-sizing is never one-and-done.
How to do it well — pricing models (COST 7). Choose the instrument that matches each workload’s commitment risk profile, and never commit to waste:
- Savings Plans — commit to a fixed $/hour of compute spend for 1 or 3 years. Compute Savings Plans are the flexible default (apply across EC2, Fargate, and Lambda, any Region/family/size, up to ~66% off). EC2 Instance Savings Plans trade flexibility for a deeper discount (up to ~72%) within a chosen instance family and Region. There are also SageMaker Savings Plans.
- Reserved Instances / capacity reservations — still relevant for services not covered by Savings Plans (e.g., RDS, ElastiCache, Redshift, OpenSearch Reserved Instances, DynamoDB reserved capacity).
- Spot Instances — bid on spare capacity at up to ~90% off for interruptible, stateless, fault-tolerant work (batch, CI/CD, big-data, rendering, and horizontally-scalable web tiers that tolerate a 2-minute interruption notice). Use EC2 Auto Scaling mixed instances, Spot Fleet, and Karpenter / EKS managed node groups with Spot to blend an On-Demand floor with a Spot burst layer.
- On-Demand — the right choice only for short-lived, spiky, or unpredictable workloads that can’t be committed or interrupted.
How to do it well — data transfer (COST 8). Design to keep traffic cheap: use VPC endpoints / PrivateLink so service traffic avoids NAT-gateway and internet egress charges; keep chatty components in the same AZ to avoid cross-AZ data charges; put Amazon CloudFront in front of S3/origins so egress is served at CDN rates; and model egress explicitly in the cost model.
| Instrument | Discount vs On-Demand (illustrative) | Commitment | Flexibility | Best for |
|---|---|---|---|---|
| Compute Savings Plan | up to ~66% | $/hr compute, 1 or 3 yr | High (EC2, Fargate, Lambda; any family/Region) | Fluid compute that changes shape |
| EC2 Instance Savings Plan | up to ~72% | $/hr, family + Region, term | Medium (size/OS flex within family) | Stable EC2 fleets in a known family |
| Reserved Instances | up to ~72% | Specific service/term | Low–Medium | RDS, ElastiCache, Redshift, OpenSearch |
| Spot Instances | up to ~90% | None | High, but interruptible (2-min notice) | Batch, CI, stateless burst, Spot node pools |
| On-Demand | baseline | None | Highest | Short-lived, spiky, uncommittable work |
The instruments stack: a Savings-Plan-covered baseline, Graviton + right-sized instances under it, and Spot for the burst layer is the canonical low-cost composition. The correct order is usage first, then rate — right-size and consolidate, settle the baseline, then buy commitments against it, or you simply lock in oversized waste at a discount.
Artifacts and decisions. A service-selection / pricing comparison for major components (from the Pricing Calculator); a right-sizing backlog sourced from Compute Optimizer; a commitment plan (baseline to cover, Compute vs EC2 Instance Savings Plan mix, 1-yr vs 3-yr split, target coverage %); a Spot adoption design (which tiers, interruption handling); and a data-transfer map. Key decisions: Compute (flexible) vs EC2 Instance (deeper) Savings Plans; 1-year (safer) vs 3-year (cheaper) terms given workload volatility; and how aggressively to push Spot given each tier’s interruption tolerance.
Worked example — right-size before you commit (usage first, then rate). The order matters so much it is worth showing why. Suppose Compute Optimizer flags a fleet as over-provisioned:
aws compute-optimizer get-ec2-instance-recommendations \
  --filters name=Finding,values=Overprovisioned \
  --query 'instanceRecommendations[].[instanceArn,currentInstanceType,
           recommendationOptions[0].instanceType,
           recommendationOptions[0].estimatedMonthlySavings.value]' \
  --output table   # representative
Say it recommends dropping 200 boxes from m5.2xlarge to m5.xlarge (half the size, half the on-demand rate). If you had already bought a 3-year Savings Plan sized to the m5.2xlarge baseline, you are now locked into paying for capacity you just proved you do not need — a discount on waste is still waste. Do it the right way round: right-size and consolidate first, let the baseline settle for a few weeks, then buy commitments against the smaller, stable baseline. The rule is a one-liner: usage first, then rate.
Worked example — commit to the floor, not the average (coverage vs utilization). This is the calculation that separates a FinOps beginner from a practitioner, and it is pure arithmetic. A Savings Plan bills you for the committed $/hour whether or not you use it — so committing above your always-on floor means paying for idle commitment during quiet hours. Two definitions:
- Coverage = share of your eligible usage that a commitment discounts (higher = less left at expensive On-Demand).
- Utilization = share of what you bought that you actually used (below ~95% means you are burning money on unused commitment).
Take a workload with a steady 100 compute-units/hour baseline (present all 730 hours of the month) plus a daytime burst of +80 units for 250 hours/month. Total eligible usage = 100×730 + 80×250 = 73,000 + 20,000 = 93,000 unit-hours.
| Commitment strategy | Capacity bought (unit-hrs) | Actually used | Utilization | Coverage of eligible |
|---|---|---|---|---|
| Commit to the floor (100 u/hr) | 100 × 730 = 73,000 | 73,000 (baseline is always ≥100) | 100% | 73,000 / 93,000 = 78% |
| Greedily commit to peak (180 u/hr) | 180 × 730 = 131,400 | 93,000 | 71% | looks “100%” but 29% of spend is idle |
Committing to the floor buys you 78% coverage at ~100% utilization — high coverage and no waste — and you leave the spiky daytime top on On-Demand or, better, Spot. Chasing 100% coverage by committing to the peak actively destroys value: utilization collapses to 71%, and you pay full commitment price for capacity that only exists during the day. Size commitments from the AWS-generated recommendation, which does this floor analysis for you across the whole org:
aws ce get-savings-plans-purchase-recommendation \
  --savings-plans-type COMPUTE_SP \
  --term-in-years THREE_YEARS \
  --payment-option NO_UPFRONT \
  --lookback-period-in-days SIXTY_DAYS \
  --query 'SavingsPlansPurchaseRecommendation.SavingsPlansPurchaseRecommendationSummary'
The response hands you an HourlyCommitmentToPurchase and an EstimatedSavingsPercentage — those are your data-driven inputs, not a guess.
Worked example — 1-year vs 3-year, the honest trade-off. A 3-year term carries a deeper discount than a 1-year term, but it locks you in for two extra years. The decision is a bet on how long the baseline survives. A defensible rule of thumb: if you are confident the workload’s floor will still exist in ~18 months, the 3-year’s deeper discount usually wins even after some drift; if the workload is new, volatile, or a migration that might be abandoned, take the 1-year term or the flexible Compute Savings Plan so you are not paying for a fleet you retired. And prefer Compute Savings Plans (flexible across EC2, Fargate, and Lambda, any family/Region) over EC2 Instance Savings Plans (deeper discount but pinned to a family + Region) unless the fleet is genuinely fixed — the extra few percent is rarely worth losing the freedom to re-architect. (Discount percentages quoted anywhere in this lesson are representative; confirm current numbers in the console for your Region and workload.)
Worked example — the data-transfer bill nobody budgets for. Compute and storage are visible; data transfer hides until the invoice. The classic trap is a NAT gateway: it charges both an hourly fee and a per-GB data-processing fee. Suppose a private-subnet fleet pushes 50 TB/month to Amazon S3 through a NAT gateway:
| Path to S3 | Data-processing rate (representative) | Monthly cost on 50 TB |
|---|---|---|
| Through a NAT gateway | ~$0.045 / GB | 50,000 GB × $0.045 = ~$2,250 |
| Through an S3 Gateway VPC endpoint | $0 (gateway endpoints are free) | $0 |
A one-time route-table change to an S3 Gateway endpoint erases ~$2,250/month — pure architecture, no rate negotiation. The same logic applies to cross-AZ chatter (~$0.01/GB each way, representative): keep tightly-coupled, chatty components in the same AZ, and put CloudFront in front of S3/origins so user-facing egress is served at CDN rates. Model egress explicitly in every cost estimate; it is the line item that most often blows a “we costed this” design.
Manage demand and supply resources (COST 9)
What it is. Matching supply (provisioned capacity) to demand (actual load) so you neither over-provision for a peak that rarely occurs nor under-provision and breach your SLOs. It maps to COST 9 (“How do you manage demand and supply resources?”) and covers two complementary techniques: supply-side management (scale capacity to track demand) and demand-side management (shape, throttle, buffer, or defer demand so you need less peak capacity).
Why it matters. Provisioning for peak means paying for idle capacity the rest of the time; the gap between peak and average is pure waste. Conversely, naive under-provisioning trades cost for outages. This area is where Cost Optimization and Performance Efficiency meet: the same telemetry that proves a tier can scale in safely is the telemetry that proves it was over-provisioned. Done well, you pay for roughly the capacity you use, minute by minute.
How to do it well — supply side. Use demand-based scaling with Amazon EC2 Auto Scaling (target-tracking, step, and predictive policies), Application Auto Scaling for ECS/Fargate, DynamoDB, and Aurora, Karpenter / Cluster Autoscaler for EKS, and Aurora Serverless v2 to scale database capacity to load. Add time-based scaling (scheduled scaling) for predictable diurnal or weekly patterns — scale up before the business day, down after. For non-prod, stop/start on a schedule with AWS Instance Scheduler so dev/test environments aren’t billing nights and weekends (a dev environment running 45 of 168 weekly hours costs ~27% of an always-on one).
How to do it well — demand side. Reduce the peak you must serve at all. Buffer spiky workloads through Amazon SQS / EventBridge so a backend can process at a steady rate instead of scaling to the spike. Throttle and protect with Amazon API Gateway usage plans and rate limits. Cache aggressively — CloudFront, ElastiCache, DAX, and API Gateway caching — so a large fraction of demand never reaches (and never has to be provisioned at) the origin. Each of these lets you provision for a smoothed load rather than the raw peak.
| Technique | Lever | AWS service | Saving driver |
|---|---|---|---|
| Demand-based scaling | Track load with metrics | EC2 Auto Scaling, Application Auto Scaling, Karpenter | Peak-to-average gap |
| Predictive scaling | Pre-scale to forecast | EC2 Auto Scaling predictive policy | Cold-start over-provisioning |
| Time-based scaling | Scale to schedule | Scheduled scaling, AWS Instance Scheduler | Predictable diurnal idle |
| Non-prod stop/start | Off when not in use | AWS Instance Scheduler | Nights/weekends idle |
| Buffering | Absorb spikes asynchronously | Amazon SQS, EventBridge | Avoids scaling to raw peak |
| Throttling | Cap demand | API Gateway usage plans | Bounds worst-case capacity |
| Caching | Serve without hitting origin | CloudFront, ElastiCache, DAX | Offloads origin capacity |
Artifacts and decisions. Auto Scaling policy definitions (metric, target, min/max) per tier; scheduled-scaling and Instance Scheduler configs for predictable and non-prod workloads; a buffering/throttling/caching design for spiky entry points; and the scaling-bounds decisions (min capacity for resilience vs cost). Key decision: how much headroom (min capacity and scale-out aggressiveness) to keep — too little risks SLO breaches and cold starts during spikes; too much reintroduces the idle you were trying to remove.
Worked example — the non-prod stop/start jackpot. Dev, test, and staging environments are the easiest large saving in most estates because nobody works nights and weekends but the instances bill 24×7. A week has 168 hours. Match runtime to when people actually use the environment:
| Schedule | Hours/week running | Fraction of always-on | Saving on schedulable spend |
|---|---|---|---|
| Always-on (no schedule) | 168 | 100% | — |
| Mon–Fri, 8am–8pm (12h × 5) | 60 | 35.7% | ~64% |
| Mon–Fri, 9am–6pm (9h × 5) | 45 | 26.8% | ~73% |
| Weekdays 12h + auto-off on idle | ~50 | ~30% | ~70% |
AWS Instance Scheduler (a supported AWS solution) tags instances with a schedule name and starts/stops them on cron, so a dev fleet on the 45-hour schedule costs about 27% of always-on — a ~73% cut on that slice, with zero code and zero risk to production. This is the “adopt a consumption model” design principle in its purest form: pay for what you use, switch off what you do not.
Worked example — supply-side scaling reads like a thermostat. A target-tracking Auto Scaling policy is the cloud version of a thermostat: you name a target (say “keep average CPU at 50%”) and AWS adds or removes capacity to hold it. Concretely, an ECS service:
aws application-autoscaling put-scaling-policy \
  --service-namespace ecs \
  --scalable-dimension ecs:service:DesiredCount \
  --resource-id service/prod-cluster/api \
  --policy-name cpu-target-50 \
  --policy-type TargetTrackingScaling \
  --target-tracking-scaling-policy-configuration \
    '{ "TargetValue": 50.0,
       "PredefinedMetricSpecification":
         { "PredefinedMetricType": "ECSServiceAverageCPUUtilization" },
       "ScaleInCooldown": 300, "ScaleOutCooldown": 60 }'
Note the asymmetric cooldowns: scale out fast (60s), scale in slow (300s). Removing capacity a beat too eagerly during a brief dip causes a thrash of scale-in/scale-out that hurts both cost and latency, so you err on the side of holding capacity a little longer than you add it. For predictable diurnal patterns, layer scheduled scaling (raise min before the business day) or predictive scaling so you are not paying the cold-start tax of reacting only after load arrives.
Demand-side: reshape the peak so you provision less of it. Supply-side scaling tracks demand; demand-side management reduces the peak you must serve at all. Buffer spiky writes through SQS or EventBridge so a backend drains a queue at a steady rate instead of scaling to the raw spike; throttle abusive callers with API Gateway usage plans so worst-case capacity is bounded; and cache aggressively (CloudFront, ElastiCache, DAX) so a large fraction of demand never reaches — and never has to be provisioned at — the origin. Each technique lets you size for a smoothed load instead of the jagged peak, and smoothing is cheaper than scaling.
Optimize over time (COST 10, COST 11)
What it is. Cost optimization is a flywheel, not a project — you continuously re-evaluate whether new services and features could lower cost (COST 10), and you automate cost management so optimization happens without standing manual toil (COST 11). It is the recognition that AWS ships new instance families, pricing models, and managed services constantly, your traffic shape shifts, and commitments expire — so a design that was optimal last year is leaving money on the table this year.
Why it matters. A one-off “cost sprint” saves money once, then the estate re-bloats because nothing changed operationally and no one revisits the architecture. Two forces specifically erode a frozen design: AWS innovation (Graviton generations, new Savings Plan terms, serverless options, S3 storage classes) means the cost-optimal implementation moves underneath you; and commitment drift means Savings Plans and RIs expire and fall out of fit as workloads evolve, turning unused commitment into pure loss. Optimizing over time keeps the gains compounding.
How to do it well — keep evaluating (COST 10). Make “could a newer service do this cheaper?” a standing agenda item in the monthly cost review and in every architecture review (use the Cost Optimization Pillar design-review questions and the AWS Well-Architected Tool, which now surfaces Trusted Advisor checks). Watch the What’s New and pricing announcements for migrations worth doing — moving a fleet to Graviton, a database to Aurora Serverless v2, logs to a cheaper retention tier, or workloads to a new-generation instance family. Re-run Compute Optimizer and review Savings Plans/RI utilization and coverage so the commitment portfolio is re-sized to current usage and renewed before it lapses.
How to do it well — automate (COST 11). Push optimization into the platform so it doesn’t depend on heroics. Schedule non-prod stop/start (Instance Scheduler) and orphan cleanup (Config rules / Lambda) by default. Bake right-sizing recommendations from AWS Cost Optimization Hub (which consolidates Compute Optimizer, idle-resource, RI/SP, and Graviton recommendations with estimated savings) into the team backlog. Use S3 Lifecycle policies and S3 Intelligent-Tiering so storage moves to cheaper classes automatically. Enforce cost guardrails as code (SCPs, tag policies, cfn-guard / Checkov in CI), embed AWS Budgets Actions for automated responses, and provide a guardrailed self-service path (Service Catalog / paved-road templates) so engineers move fast without re-introducing waste. Treat the toil you remove (manual teardown, manual right-sizing, manual reporting) as a measured cost saving in its own right.
| Over-time discipline | What it counters | AWS mechanism |
|---|---|---|
| Periodic re-evaluation | AWS innovation outpacing your design | Well-Architected Tool, monthly review, What’s New |
| Commitment portfolio review | RI/SP drift and lapse | Cost Explorer SP/RI utilization & coverage, Cost Optimization Hub |
| Recommendation pipeline | Manual right-sizing toil | Cost Optimization Hub, Compute Optimizer |
| Automated lifecycle | Stale storage and orphans | S3 Lifecycle / Intelligent-Tiering, Config + Lambda |
| Automated guardrails | Re-bloat after cleanup | SCPs, tag policies, Budgets Actions, Service Catalog |
Artifacts and decisions. A continuous-improvement cadence (review schedule, owners) tied to the CFM function; a commitment renewal calendar; an automation backlog for cost (stop/start, cleanup, lifecycle, self-service); and a Well-Architected review record for the Cost pillar. Key decision: how much to automate outright (auto-stop, auto-tier, auto-cleanup) versus gate behind human approval — over-aggressive automation (e.g., deleting a “stale” snapshot that was someone’s recovery point) causes its own incidents, so destructive actions usually warrant a tag-based opt-out and a grace period.
Worked example — make storage cheaper while you sleep. The cleanest “optimize over time” win is storage that tiers itself. An S3 Lifecycle rule moves objects to colder, cheaper classes on age, and S3 Intelligent-Tiering does it automatically based on access patterns with no retrieval-fee risk on the frequent tiers:
{
  "Rules": [{
    "ID": "logs-cooldown",
    "Filter": { "Prefix": "logs/" },
    "Status": "Enabled",
    "Transitions": [
      { "Days": 30,  "StorageClass": "STANDARD_IA" },
      { "Days": 90,  "StorageClass": "GLACIER_IR" },
      { "Days": 365, "StorageClass": "DEEP_ARCHIVE" }
    ],
    "Expiration": { "Days": 2555 }
  }]
}
Ninety-day-old logs sitting in S3 Standard are a recurring, invisible overspend; this rule collects that saving forever, without a human. That is the essence of COST 11 (automate): once an optimization is proven, push it into the platform so it happens by default and cannot be forgotten.
Worked example — feed the recommendation pipeline into the backlog. AWS Cost Optimization Hub consolidates Compute Optimizer right-sizing, idle-resource findings, Savings Plan/RI suggestions, and Graviton migrations into one ranked list with estimated savings:
aws cost-optimization-hub list-recommendations \
  --filter '{ "actionTypes": ["Rightsize", "MigrateToGraviton", "Stop"] }' \
  --query 'items[].[actionType,currentResourceType,
           estimatedMonthlySavings]' --output table   # representative
Pull that list into each team’s sprint backlog on a cadence and the estate keeps getting more efficient instead of slowly re-bloating. Guard the gains as code — SCPs, tag policies, and cfn-guard/Checkov in CI stop new waste at the door — and treat destructive automation (deleting “stale” snapshots, stopping “idle” instances) carefully: give it a tag-based opt-out and a grace period, because auto-deleting someone’s only recovery point is its own incident. Automate aggressively where actions are reversible; gate the irreversible ones behind a human.
Real-world enterprise scenario
Helios Streaming is a fictional video-on-demand company (~900 engineers, ₹-denominated, serving 12 million subscribers across India and Southeast Asia) running on AWS across a Control Tower landing zone: ~50 accounts, EKS for the streaming control plane and APIs, Aurora PostgreSQL for the subscriber and billing data, DynamoDB for the playback catalog, Lambda + EventBridge for entitlement events, S3 + CloudFront for media delivery, and a large analytics estate on EMR and Redshift. Their AWS bill has reached ₹6.5 crore/month and is rising faster than subscriber growth. The CTO charters a FinOps initiative led by a principal architect, working the Cost Optimization pillar end to end.
Practice Cloud Financial Management. The architect stands up a five-person Cloud Cost CoE that owns tooling and Savings Plan purchasing, while each of the ten product teams gets a named cost owner. They adopt the Inform → Optimize → Operate lifecycle, publish per-team QuickSight dashboards weekly, and institute a monthly cost review with a standing agenda (recommendations, coverage/utilization, anomalies, unit-cost trend). The headline unit metric is defined as ₹ per 1,000 streaming hours, found to have crept from ₹71 to ₹94 over a year — proof the spend growth is partly waste, not just subscribers.
Expenditure and usage awareness. A mandatory tag taxonomy (CostCenter, Owner, Environment, Application) is enforced via Organizations tag policies and activated as cost allocation tags; Cost Categories roll accounts and tags into the four business lines for finance. AWS Budgets are created at every account and per-CostCenter tag with 80%/100% actual and 100%-forecast thresholds; non-prod budgets get a Budgets Action that stops EC2/RDS on breach. Cost Anomaly Detection is enabled org-wide and pays for itself in week two by catching a misconfigured EMR autoscale that had spiked ₹11 lakh in three days. The CUR 2.0 is exported via Data Exports to S3 and queried in Athena for the source-of-truth detail. Trusted Advisor and a scheduled Lambda find and remove 900+ unattached EBS volumes and 70 idle Elastic IPs.
Cost-effective resources. Sequenced usage-first, then rate, the team runs Compute Optimizer to right-size 240 over-provisioned EC2 instances and migrate the stateless API tier to Graviton, then settles the baseline and buys 3-year Compute Savings Plans sized from 30-day usage to cover the steady EKS/Lambda/Fargate compute, plus RDS Reserved Instances for the always-on Aurora. The transcoding farm and all CI/CD move to EC2 Spot (via Karpenter with an On-Demand floor); media egress is already fronted by CloudFront, and VPC endpoints are added to cut NAT-gateway data charges. Target Savings-Plan + RI coverage of the eligible baseline is set at 80%.
Manage demand and supply resources. The API and control-plane tiers move to target-tracking and predictive EC2 Auto Scaling; EKS uses Karpenter to consolidate nodes; non-prod runs on a strict AWS Instance Scheduler stop/start (nights and weekends off). On the demand side, entitlement spikes during big launches are buffered through SQS so the billing backend processes at a steady rate instead of scaling to the spike, and API Gateway usage plans throttle a noisy partner integration. Non-prod runtime drops to ~30% of always-on.
Optimize over time. A commitment renewal calendar prevents lapses; Cost Optimization Hub feeds a recurring right-sizing and Graviton-migration backlog into each team; S3 Lifecycle + Intelligent-Tiering move cold media and logs to cheaper classes automatically; and the Cost pillar is reviewed quarterly in the AWS Well-Architected Tool. Cost guardrails (SCPs denying GPU families outside the ML account, mandatory tags, Budgets Actions) are codified so the estate cannot re-bloat, and self-service provisioning ships via Service Catalog with cost estimation in PRs.
Measurable outcome. Over two quarters the monthly bill falls from ₹6.5 crore to ₹4.6 crore (~29%) while subscribers grow 16% — so the real win shows in the unit metric: ₹ per 1,000 streaming hours drops from ₹94 to ₹58 (~38%). Savings-Plan + RI coverage reaches 82% at 97% utilization, 100% of spend becomes tag-allocable, anomaly detection cuts mean-time-to-detect a cost spike from ~30 days to under 24 hours, and Budgets forecast accuracy lands within ±4%. The CFO now reads a unit-cost trend, not a raw rupee scare.
Going deeper
The core teaching above is enough to run a competent cost program. This section is for the reader who wants the mechanics underneath — the cost lenses that trip up dashboards, how commitments actually apply across an org, and the failure modes that turn a well-meaning optimization into an incident.
The four ways AWS shows you a dollar (unblended, blended, amortized, net)
A recurring source of “the numbers don’t match” is that AWS reports cost through several lenses, and a dashboard that mixes them lies:
- Unblended cost — the raw rate on the invoice for each line item, at the moment it was incurred. What you literally paid per usage record.
- Blended cost — an averaged rate across a consolidated-billing family, used when multiple accounts share tiered/volume pricing. Mostly a historical artifact; rarely the lens you want for a decision.
- Amortized cost — spreads the cost of a commitment (a Savings Plan or an All/Partial-Upfront RI) evenly across the hours it covers. This is the honest lens for showback: it makes a team’s dashboard reflect the economic cost of the capacity they used, instead of showing a spuriously cheap day because a commitment “paid” for them and an expensive day when the upfront hit landed.
- Net (amortized) cost — amortized cost after discounts/credits, i.e. what it truly costs you after your Enterprise Discount Program and credits.
The rule: use amortized (or net amortized) for allocation and unit economics; use unblended only when you are reconciling to the literal invoice. A team dashboard on unblended cost will swing wildly around commitment purchases and mislead everyone reading it.
How a Savings Plan actually applies — the “floating” benefit
Beginners picture a Savings Plan as attached to specific instances. It is not. Each hour, AWS looks at your eligible usage across the entire consolidated-billing organization and applies your committed $/hour to the usage that yields the largest discount first, maximising your benefit automatically. Consequences that matter in production:
- A Savings Plan bought in the management (payer) account floats across every member account — one org-wide portfolio is strictly better than per-team plans, which is why commitment purchasing is a central CCoE responsibility.
- Because it optimizes highest-discount-first, you generally do not need to micro-manage which workload “gets” the plan; you manage the aggregate commitment level and let the allocator work.
- A Savings Plan gives you a rate discount but no capacity guarantee. If you also need guaranteed capacity in an AZ (a hard launch, a DR failover fleet), that is a separate instrument — an On-Demand Capacity Reservation (ODCR) — and a Savings Plan’s rate can apply on top of an ODCR. Rate and capacity are orthogonal.
RI vs Savings Plan vs ODCR vs Spot — which knob does what
| Instrument | Gives you | Capacity guaranteed? | Flexibility | Typical use |
|---|---|---|---|---|
| Compute Savings Plan | Rate discount on $/hr compute | No | High (EC2/Fargate/Lambda, any family/Region) | The default commitment |
| EC2 Instance Savings Plan | Deeper rate discount | No | Medium (locked to family + Region) | Genuinely fixed fleets |
| Reserved Instance (Standard) | Rate discount for a service | Zonal RIs: yes; Regional: no | Low–Medium | RDS/ElastiCache/Redshift/OpenSearch (no SP coverage) |
| On-Demand Capacity Reservation | Reserved capacity in an AZ | Yes | Buy/cancel anytime; no discount alone | Guaranteed launch/DR capacity |
| Spot | Up to ~90% off spare capacity | No (2-min reclaim) | High, interruptible | Batch, CI, stateless burst |
The subtlety worth internalizing: Savings Plans and RIs are rate instruments; ODCR is a capacity instrument; Spot is a cheap-but-interruptible instrument. Real fleets often stack them — an ODCR for the must-launch floor, a Savings Plan providing the rate on that floor, and Spot for the elastic top. For the interruption-handling patterns that make Spot production-safe (capacity-optimized allocation, rebalance recommendations, checkpointing), see EC2 Spot & mixed instances.
Allocating the un-allocable — shared costs, showback, and chargeback
At scale, some spend genuinely belongs to no single team: a shared-services account (central networking, logging, security tooling), Business/Enterprise Support (a percentage of the bill), org-wide data transfer, and the “10% that refuses to tag.” You cannot leave it unallocated and still have credible showback. The standard moves:
- Split shared costs by a fair key — proportional to each team’s direct spend, or by headcount, or by a usage metric — and document the rule so it is defensible rather than arbitrary.
- Showback vs chargeback. Showback tells a team what they cost (visibility, no invoice); chargeback actually bills their P&L. Showback drives most of the behaviour change at a fraction of the political cost; graduate to chargeback only when the org is ready.
- Custom rate cards. When internal pricing differs from AWS list pricing (a platform team reselling a shared cluster, a markup for support), AWS Billing Conductor builds pro-forma bills with your own rates. A full pattern lives in FinOps showback/chargeback platform.
“The cost of the pillar isn’t just dollars — it’s efficiency”
The most advanced idea in this pillar is that cost is a proxy for efficiency, and efficiency sometimes argues for spending more. Two places this bites:
- Serverless vs always-on crossover. Lambda/Fargate/Aurora Serverless have a higher unit price but you pay nothing at idle. Below some utilization crossover, serverless is cheaper in total despite the higher sticker rate; above it, a right-sized, Savings-Plan-covered, Graviton EC2 fleet wins. The cost-aware architect knows where their workload sits on that curve rather than dogmatically preferring one.
- Graviton is a price/performance decision, not a price decision. Moving to Graviton (Arm64) typically improves price and performance, but “typically” hides real work: your container images must be multi-arch, some dependencies lack Arm64 builds, and you should benchmark price-per-throughput, not just the hourly rate — a chip that is 20% cheaper but 25% slower on your workload is a loss. The migration mechanics are in Graviton Arm64 migration.
This is why the pillar’s north star is value per unit, not a smaller invoice. A team that halves its unit cost while doubling its (profitable) spend has optimized far better than one that froze a shrinking, stagnant estate.
The Well-Architected Tool, and the review as a mechanism
The AWS Well-Architected Tool (a free console service) is how the framework stops being a PDF and becomes a repeatable review. You define a workload, answer the pillar’s best-practice questions (COST 1–11 for this pillar), and the Tool produces a risk report — High Risk Issues (HRIs) and Medium Risk Issues — with links to remediation guidance, and now surfaces relevant Trusted Advisor checks inline. Two mechanics make it useful over time rather than once:
- Milestones freeze a point-in-time snapshot, so you can review a workload, do the work, and re-review to prove the risk count fell.
- Custom lenses let you encode your own org’s standards (a stricter tagging rule, a mandatory commitment-coverage target) as additional questions alongside the AWS pillars.
Run the Cost pillar review on a cadence tied to the CFM function, not once at launch — the whole point of optimize over time is that last year’s “no risks” answer decays as AWS ships new instance families and your traffic shape shifts.
Failure modes the happy path hides
- Over-committing during a migration. Buying a 3-year plan sized to a fleet you are mid-way through re-architecting locks in a shape you are about to abandon. Prefer 1-year or flexible Compute plans until the target architecture is stable.
- Budgets Actions on production. A Budgets Action that stops instances is a gift in non-prod and a self-inflicted outage in prod. Scope stop/deny actions to non-prod tags only; in prod, alert a human.
- Anomaly-detection fatigue. Set the impact threshold high enough that only material spikes page a human, or the signal drowns and everyone mutes it.
- Tag policy breaking deploys.
enforced_forwill fail resource creation that lacks the tag — roll it out in report mode / to a pilot OU first, or a Friday deploy fails for a “cost” reason nobody expects. - Coverage theatre. A dashboard bragging “95% coverage” while utilization sits at 70% is losing money — you bought commitment you are not using. Always read coverage and utilization together.
Deliverables & checklist
Common pitfalls
- Buying Savings Plans before right-sizing. A 3-year commitment against an over-provisioned fleet locks in waste at a discount. Avoid it: always run the usage track (right-size, consolidate, settle the baseline) before the rate track, and size commitments from 30/60-day Compute Optimizer data, not last year’s peak.
- Budgets that only email an inbox. A budget with no action at 100% is documentation, not a guardrail. Avoid it: use forecasted thresholds for early warning and wire at least the non-prod breach to a Budgets Action (apply a restrictive policy or stop instances) so the system reacts in minutes.
- Measuring dollars instead of unit cost. A bill that rose because subscribers tripled looks identical to runaway waste if you only watch the total. Avoid it: headline a unit-economics KPI (₹ per stream-hour / order / transaction) so growth and waste are distinguishable and you can defend increasing spend that earns its keep.
- Untagged, unallocable spend. If 30% of the bill has no owner, no team is accountable and showback is fiction. Avoid it: enforce the tag taxonomy with Organizations tag policies and Cost Categories, and treat allocation coverage as a tracked KPI.
- Set-and-forget commitments. Savings Plans and RIs expire and drift out of fit as workloads change; unused commitment is pure loss. Avoid it: review utilization and coverage monthly in Cost Explorer, keep a renewal calendar, and re-size from current usage before terms lapse.
- One-off cost sprints. A single cleanup saves money once, then the estate re-bloats because nothing changed operationally. Avoid it: stand up the CFM cadence (monthly review, owners, automated toil reduction) and codify guardrails so optimization is continuous, per the optimize over time best practice.
Common beginner mistakes
These are misconceptions — wrong mental models — as opposed to the operational traps in Common pitfalls above. Fix the model and the right behaviour follows.
- “WAF here means the Web Application Firewall.” It does not. In this lesson WAF = Well-Architected Framework, and this is its Cost Optimization pillar. AWS WAF (the firewall that filters HTTP requests) is an unrelated service that happens to share the acronym. If someone hands you a “WAF review,” ask which one they mean — a security-appliance audit and a six-pillar architecture review could not be more different.
- “Cost Optimization means spending the least.” The right model is maximum value per unit of spend. Spending zero is trivially “optimal” on cost and catastrophic on value. The pillar exists to help you spend more where it earns its keep and cut where it does not — you cannot do that if your only goal is a smaller number.
- “The bill went up, so we’re wasting money.” Not necessarily. Absolute dollars conflate growth with waste. The right model is unit economics: ₹ (or $) per stream-hour / order / tenant. A bill that rose because the business tripled, at a falling unit cost, is a success story — watch the ratio.
- “Savings Plans and Reserved Instances are basically the same.” Different instruments. A Savings Plan is a commitment to a $/hour of compute spend that floats flexibly across EC2, Fargate, and Lambda; a Reserved Instance reserves a specific service configuration (and, for zonal RIs, capacity). Reach for Savings Plans for general compute; RIs remain for services SPs do not cover (RDS, ElastiCache, Redshift, OpenSearch).
- “Spot instances get yanked at random, so they’re too risky.” The right model: Spot gives a 2-minute interruption notice plus an earlier rebalance recommendation, and the capacity-optimized allocation strategy draws from the deepest, least-interrupted pools. For stateless, fault-tolerant, checkpointable work (batch, CI, rendering, horizontally-scaled web tiers) it is production-grade at up to ~90% off — you just design for interruption instead of pretending it won’t happen.
- “On-Demand is the safe default, so leave everything on it.” On-Demand is the most expensive way to run a steady baseline — you pay a premium for the right to walk away every second, a right a 24×7 database never exercises. The right model: On-Demand is for short-lived, spiky, unpredictable work; commit the stable baseline and put the interruptible top on Spot.
- “Right-sizing means making everything smaller.” It means matching size to need — which is sometimes up. Compute Optimizer flags under-provisioned resources too; a too-small box that thrashes, retries, and runs twice as long can cost more than the right-sized one that finishes fast. Right-sizing is precision, not shrinkage.
- “We ran a cost-cutting sprint, so we’re done.” Cost optimization is a flywheel, not a project. AWS ships new instance families and pricing constantly, your traffic shifts, and commitments expire — a frozen design silently re-bloats. The right model is the CFM cadence plus automated guardrails, so optimization is continuous rather than a heroic annual event.
Practice challenges
Work these in order — they escalate from “see the spend” to “size a commitment from data.” Each has a worked solution; try it before you open it. (No live AWS account is needed to reason through them; commands are real and schema-correct.)
1 (Beginner) — See where the money goes. Using the Cost Explorer API, list last month’s spend grouped by service, so you know your top three cost drivers before touching anything.
<details> <summary>Solution</summary>
aws ce get-cost-and-usage \
  --time-period Start=2026-08-01,End=2026-09-01 \
  --granularity MONTHLY \
  --metrics "UnblendedCost" \
  --group-by Type=DIMENSION,Key=SERVICE \
  --output table
Remember End is exclusive (this covers 1–31 August). Why: you cannot optimize — or even discuss — what you cannot see; visibility is step zero of the whole pillar.
</details>
2 (Beginner) — A budget that warns early. Create a $5,000/month budget for the nonprod environment that alerts finance at 80% of forecast (not just actuals).
<details> <summary>Solution</summary>
aws budgets create-budget --account-id 123456789012 \
  --budget '{ "BudgetName":"nonprod-monthly",
              "BudgetLimit":{"Amount":"5000","Unit":"USD"},
              "TimeUnit":"MONTHLY","BudgetType":"COST",
              "CostFilters":{"TagKeyValue":["user:Environment$nonprod"]} }' \
  --notifications-with-subscribers \
    '[{"Notification":{"NotificationType":"FORECASTED",
        "ComparisonOperator":"GREATER_THAN","Threshold":80,
        "ThresholdType":"PERCENTAGE"},
       "Subscribers":[{"SubscriptionType":"EMAIL",
        "Address":"finops@example.com"}]}]'
Why: a forecasted threshold warns you before you overspend; an actuals-only alert fires when it is already too late to prevent it. </details>
3 (Intermediate) — Find right-sizing savings. Ask Compute Optimizer for over-provisioned EC2 instances and surface the estimated monthly saving per box.
<details> <summary>Solution</summary>
aws compute-optimizer get-ec2-instance-recommendations \
  --filters name=Finding,values=Overprovisioned \
  --query 'instanceRecommendations[].[currentInstanceType,
           recommendationOptions[0].instanceType,
           recommendationOptions[0].estimatedMonthlySavings.value]' \
  --output table
Why: right-sizing is the usage lever and it comes before the rate lever — shrinking the baseline first means you commit to less of it. </details>
4 (Intermediate) — Size a commitment from data. Generate a 3-year, No-Upfront Compute Savings Plan purchase recommendation from a 60-day lookback and read the hourly commitment AWS suggests.
<details> <summary>Solution</summary>
aws ce get-savings-plans-purchase-recommendation \
  --savings-plans-type COMPUTE_SP \
  --term-in-years THREE_YEARS \
  --payment-option NO_UPFRONT \
  --lookback-period-in-days SIXTY_DAYS \
  --query 'SavingsPlansPurchaseRecommendation.SavingsPlansPurchaseRecommendationSummary'
Read HourlyCommitmentToPurchase and EstimatedSavingsPercentage. Why: commitments must be sized from measured usage (the floor), never from last year’s peak or a hunch.
</details>
5 (Advanced) — Governance as code. Write (a) an Organizations tag policy that makes CostCenter mandatory on ec2:instance, and (b) an SCP that denies GPU instance families outside the ML OU. Then state which one wins if they conflict with an account’s own IAM allow.
<details> <summary>Solution</summary>
Tag policy:
{ "tags": { "CostCenter": {
    "tag_key":   { "@@assign": "CostCenter" },
    "enforced_for": { "@@assign": ["ec2:instance"] } } } }
SCP:
{ "Version": "2012-10-17", "Statement": [{
    "Sid": "DenyGpuOutsideML", "Effect": "Deny",
    "Action": "ec2:RunInstances",
    "Resource": "arn:aws:ec2:*:*:instance/*",
    "Condition": { "StringLike": { "ec2:InstanceType": ["p4d.*","p5.*","g5.*","g6.*"] } } }] }
The SCP Deny wins: an SCP bounds the maximum permissions of an account, and an explicit deny overrides any IAM Allow inside it. Why: governance is preventive (make the wrong thing impossible) while tagging makes spend attributable — you need both to keep an estate accountable.
</details>
6 (Advanced) — Commit to the floor. A workload has a steady 100 units/hr baseline (all 730 hrs/month) plus a +80 units daytime burst for 250 hrs/month. Compute coverage and utilization if you commit to 100 units/hr vs 180 units/hr, and recommend the commitment.
<details> <summary>Solution</summary>
Eligible usage = 100×730 + 80×250 = 93,000 unit-hours.
- Commit 100 u/hr: bought
100×730 = 73,000; all used (baseline always ≥100) → utilization 100%, coverage 73,000/93,000 = 78%. - Commit 180 u/hr: bought
180×730 = 131,400; only 93,000 used → utilization ~71%, and 29% of the commitment sits idle.
Commit to ~100 units/hr (the floor) and leave the daytime burst on On-Demand or Spot. Why: committing to the always-on floor gives high coverage and ~100% utilization; chasing 100% coverage by committing to the peak just buys idle commitment you pay for anyway. </details>
Glossary
- Well-Architected Framework (WAF) — AWS’s set of best practices organized into six pillars (Operational Excellence, Security, Reliability, Performance Efficiency, Cost Optimization, Sustainability). Not AWS WAF, the web-application firewall service — same acronym, unrelated thing.
- Cost Optimization pillar — the pillar covered here; delivering maximum business value for the lowest price point, expressed as best-practice questions COST 1–11.
- COST 1–11 — the numbered best-practice questions of the Cost pillar, grouped into five areas: CFM (1), expenditure & usage awareness (2–4), cost-effective resources (5–8), manage demand & supply (9), optimize over time (10–11).
- Cloud Financial Management (CFM) / FinOps — the operating model (people, process, culture) that makes cost a continuously managed property of workloads rather than a monthly surprise.
- CCoE (Cloud Cost Center of Excellence) — the small central team that owns cost tooling, standards, and commitment purchasing while workload teams own their usage.
- Inform → Optimize → Operate — the FinOps Foundation lifecycle: give visibility/allocation, drive rate & usage improvements, embed accountability into daily operations.
- Showback / Chargeback — showback tells a team what it cost (visibility only); chargeback actually bills the team’s budget.
- Unit economics / unit cost — cost divided by a business driver (₹ per stream-hour, $ per order). The metric that distinguishes healthy growth from waste.
- Cost Explorer — the interactive console/API for exploring spend by service, account, tag, or Cost Category, with forecasting.
- CUR / CUR 2.0 / Data Exports — the Cost and Usage Report, the most granular line-item billing data; CUR 2.0 is delivered via AWS Data Exports to S3 and queried in Athena/QuickSight.
- FOCUS — the FinOps Open Cost and Usage Specification, a vendor-neutral billing schema (
BilledCost,ServiceName, …) so the same query works across AWS, Azure, and GCP. - Cost allocation tag — a resource tag (e.g.
CostCenter) activated in the billing console so it appears in cost data and lets you attribute spend to a team/app. - Tag policy — an AWS Organizations policy that standardizes/enforces tag keys and values;
enforced_forcan block creation of untagged resources. - Cost Categories — rules that roll accounts/tags up into business dimensions (business unit, product line) for finance reporting.
- AWS Budgets / Budgets Actions — cost/usage budgets with actual and forecasted thresholds; a Budgets Action can automatically apply a restrictive policy or stop instances on breach.
- Cost Anomaly Detection — ML-based detection of unexpected spend spikes, independent of any threshold you set.
- Right-sizing — matching a resource’s type/size to actual need (from telemetry); sometimes means scaling up, not just down.
- Compute Optimizer — the service that analyzes CloudWatch metrics and recommends better instance types/sizes across EC2, ASGs, EBS, Lambda, ECS-on-Fargate, and RDS.
- Cost Optimization Hub — a single ranked surface consolidating right-sizing, idle-resource, Savings Plan/RI, and Graviton recommendations with estimated savings.
- Trusted Advisor — checks (including cost checks) that flag idle/under-utilized resources and other savings.
- Savings Plans — a commitment to a fixed $/hour of compute spend for 1 or 3 years. Compute SP is flexible across EC2/Fargate/Lambda; EC2 Instance SP is deeper but locked to a family+Region; SageMaker SP covers ML.
- Reserved Instance (RI) — a commitment reserving a specific service configuration (and, for zonal RIs, capacity); still used for RDS/ElastiCache/Redshift/OpenSearch.
- On-Demand Capacity Reservation (ODCR) — reserves capacity in an AZ with no rate discount by itself; a Savings Plan’s rate can apply on top.
- Spot Instances — spare EC2 capacity at up to ~90% off, reclaimable with a 2-minute notice; for interruptible, fault-tolerant work.
- On-Demand — pay-as-you-go with no commitment; the most expensive way to run a steady baseline, right only for short-lived/spiky work.
- Coverage / Utilization — coverage = share of eligible usage discounted by a commitment; utilization = share of the commitment you actually used. Read them together.
- Unblended / Blended / Amortized / Net cost — the four cost lenses; use amortized (or net amortized) for allocation and unit economics, unblended only when reconciling to the literal invoice.
- Graviton — AWS’s Arm64 processors; usually a price and performance step-change, but benchmark price-per-throughput and confirm Arm64 software support.
- SCP (Service Control Policy) — an Organizations guardrail that caps the maximum permissions of member accounts; can only deny, never grant; explicit deny overrides IAM allow.
- AWS Organizations / OU — the multi-account management layer; an Organizational Unit groups accounts, and the account is the cleanest cost-allocation boundary.
- Auto Scaling (target-tracking / predictive / scheduled) — adjusts capacity to track a metric target, a forecast, or a clock, so you pay for roughly the capacity you use.
- AWS Instance Scheduler — an AWS solution that starts/stops tagged instances on a cron schedule (e.g. non-prod off nights/weekends).
- Buffering / Throttling / Caching — demand-shaping techniques (SQS/EventBridge, API Gateway usage plans, CloudFront/ElastiCache/DAX) that reduce the peak you must provision for.
- VPC endpoint / PrivateLink — private connectivity to AWS services that avoids NAT-gateway and internet-egress data charges (S3/DynamoDB gateway endpoints are free).
- Data transfer / egress / NAT gateway — the often-forgotten cost of moving bytes: cross-AZ, cross-Region, internet egress, and NAT-gateway per-GB processing.
- S3 Intelligent-Tiering / Lifecycle — storage that moves objects to cheaper classes automatically, by access pattern or by age rule.
- AWS Well-Architected Tool — the free console service that turns the framework into a repeatable review, producing risk reports (HRIs), milestones, and custom lenses.
What’s next
Part 6 of the AWS Well-Architected Framework series closes the pillars with Sustainability — measuring and reducing the carbon and resource footprint of your workloads through region selection, demand alignment, efficient hardware (Graviton), and right-sizing the software and data you run.