In a nutshell
Imagine you run a busy restaurant. Your kitchen dashboards are perfect: every burner is lit, the pass clears tickets in under four minutes, the health inspector loves you. Yet customers are leaving one-star reviews. Why? Because the dining room is where they actually sit — and the kitchen instruments cannot see a wobbly table, a waiter who never showed, or a front door that sticks. Backend monitoring is the kitchen. The browser is the dining room. This lesson is about finally putting sensors in the dining room.
You do that two ways, and you need both. CloudWatch RUM (Real User Monitoring) is a tiny sensor you clip onto every real diner — a JavaScript snippet in the browser that reports what actual people experienced: how fast the page painted, whether a button froze, which script threw an error. It is passive and honest, but it only sees a table once someone sits at it. CloudWatch Synthetics sends in a robot diner on a timer — a headless browser (a “canary”) that walks your key journeys every minute from several AWS regions, so an empty table with a broken chair is found at 3am by the robot instead of at 9am by a paying customer. RUM tells you what users got; canaries tell you what a user would get right now.
The payoff is that both feed the same CloudWatch metrics you already use for backend services, so you can write real frontend SLOs — an availability target (“99.5% of page views error-free”) and a latency target (“95% of navigations under 2 s”) — with error budgets and burn-rate alarms, and put the browser on call like any other tier.
Level: Advanced · Time: ~45 min
Prerequisites
- Comfort with CloudWatch metrics, alarms, and namespaces — the CloudWatch and CloudTrail observability deep dive is the on-ramp.
- A mental model of distributed tracing; this lesson correlates into X-Ray service maps.
- Basic front-end delivery (a site behind CloudFront) and enough Terraform to read an
aws_synthetics_canaryblock.
After this lesson you can
- Instrument a browser app with the
aws-rum-webclient behind a Cognito identity pool, and reason about sampling and cost per event. - Author heartbeat, API, and broken-link canaries as IaC on a pinned, current runtime, and page on
SuccessPercent. - Define frontend availability and latency SLIs from RUM metric-math and wrap them in multi-window burn-rate alarms.
- Correlate a RUM or canary failure into an X-Ray trace, and tell RUM (real) apart from Synthetics (synthetic) with intent.
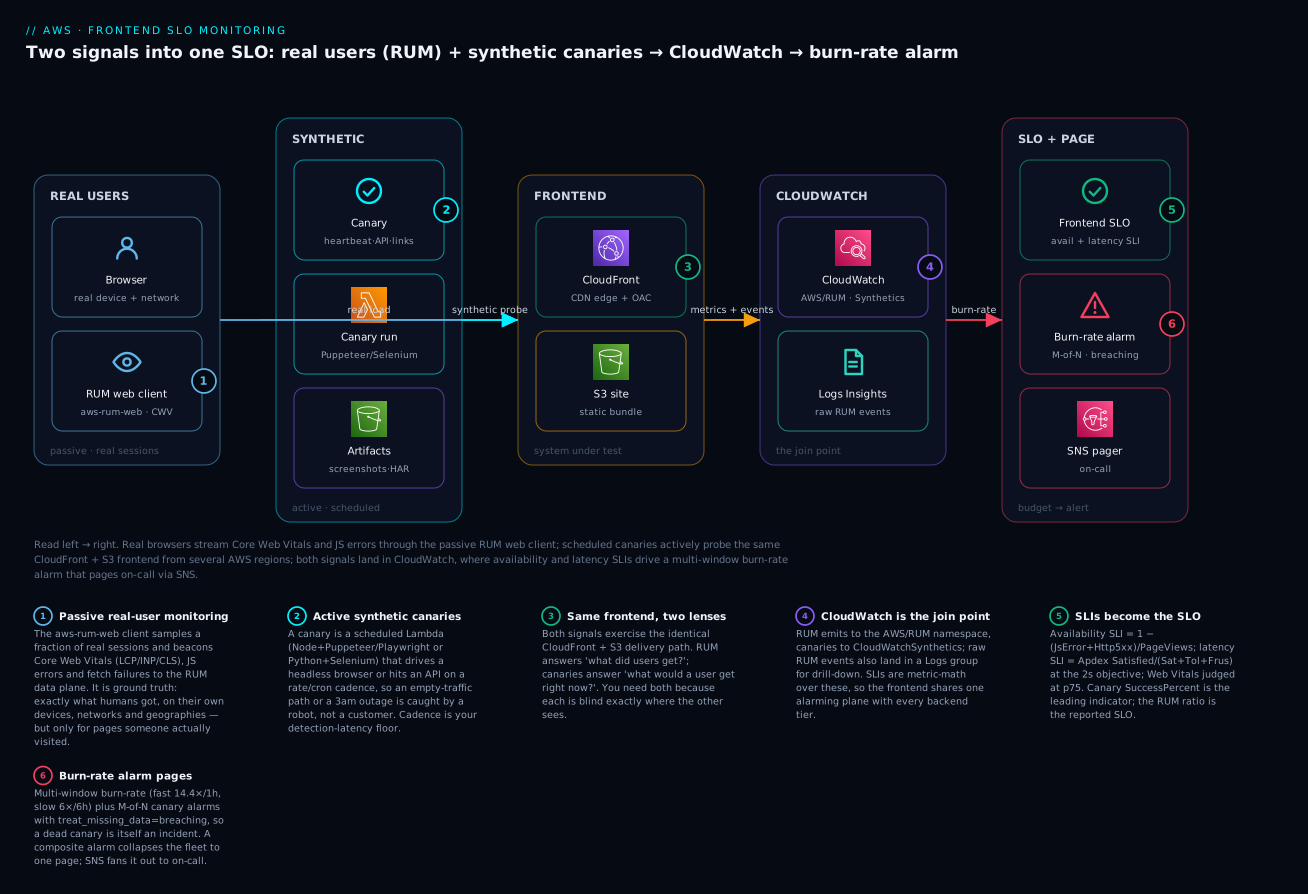
Read the diagram left → right: real browsers stream Core Web Vitals through the RUM web client while scheduled canaries actively probe the same CloudFront + S3 frontend; both land in CloudWatch, where availability and latency SLIs drive a multi-window burn-rate alarm that pages on-call via SNS.
RUM vs Synthetics at a glance
The single most important idea in this lesson is that these two tools are complementary opposites — passive vs active, real vs synthetic. Beginners reach for one and wonder why they still get surprised; the answer is almost always that they needed the other.
| Dimension | CloudWatch RUM (real-user) | CloudWatch Synthetics (canaries) |
|---|---|---|
| Signal type | Passive — observes real sessions | Active — generates traffic on a schedule |
| Data source | Actual browsers, real devices/networks | Headless browser / HTTP from AWS regions |
| Sees | What users did experience | What a user would experience now |
| Blind to | Paths no one visited; 3am with no traffic | Real device/network/geo diversity; rage-clicks |
| Coverage of empty paths | ✗ needs a real visitor | ✓ runs regardless of traffic |
| Cost driver | Per event ingested (× sampling) | Per canary run (× cadence × regions) |
| Namespace | AWS/RUM |
CloudWatchSynthetics |
| Best used as | The reported SLO (ground truth) | The leading indicator (pages first) |
Hold that last row: you page on the canary (it fires with zero live traffic) but you report the SLO on RUM (it is what humans actually got). Everything below is the detail behind those two sentences.
Backend dashboards lie to you about the frontend. Your ALB target group is healthy, p99 server latency is flat, X-Ray shows no faults - and a third of your users are staring at a blank page because a CDN-served bundle 404’d or a third-party tag blew up the main thread. The two signals that close that blind spot are passive and active. CloudWatch RUM (Real User Monitoring) is passive: a JavaScript web client reports what real browsers actually experienced - Core Web Vitals, JS errors, fetch failures, navigation timing. Synthetics canaries are active: scheduled headless-browser scripts that exercise your site from AWS regions on a fixed cadence, so you find out it’s down at 3am instead of from a customer at 9am. Run both, feed their metrics into the same SLO math you already use for backend services, and you get a frontend you can actually put on call.
1. Instrumenting the browser with the CloudWatch RUM web client
RUM has two halves: an app monitor (the AWS-side resource that ingests events, emits metrics, and stores raw events in CloudWatch Logs) and the web client (aws-rum-web, the npm package or CDN snippet that runs in the browser and posts events to the data plane). The web client authenticates to the RUM PutRumEvents API using temporary, unauthenticated credentials from a Cognito identity pool - that is the supported, low-friction path, and it is why you never ship long-lived keys to the browser.
When you create an app monitor with --cw-log-enabled and let RUM manage the identity pool, AWS provisions the Cognito identity pool, the unauthenticated IAM role, and the role policy for you. Create it first:
aws rum create-app-monitor \
  --name kloudvin-web \
  --domain app.kloudvin.com \
  --cw-log-enabled \
  --app-monitor-configuration '{
    "AllowCookies": true,
    "EnableXRay": true,
    "SessionSampleRate": 0.2,
    "Telemetries": ["errors", "performance", "http"],
    "FavoritePages": ["/", "/checkout"]
  }' \
  --region eu-west-1
SessionSampleRate: 0.2 instruments 20% of sessions - the single biggest cost and volume lever (section 7). Telemetries selects which plugins the client loads: errors (JS errors), performance (navigation, resource, and Web Vitals), and http (XHR/fetch instrumentation). EnableXRay: true makes the client attach trace headers to instrumented HTTP calls so RUM sessions stitch to backend traces (section 5).
Grab the generated identity pool ID and app monitor ID from the response - the snippet needs both:
aws rum get-app-monitor --name kloudvin-web --region eu-west-1 \
  --query 'AppMonitor.{Id:Id,Pool:AppMonitorConfiguration.IdentityPoolId}'
Now install the client. Prefer the npm module over the CDN loader in a real app - you get version pinning, tree-shaking, and the ability to gate it behind consent. The config object passed to AwsRum mirrors the app monitor:
import { AwsRum } from 'aws-rum-web';

const config = {
  sessionSampleRate: 0.2,
  identityPoolId: 'eu-west-1:11111111-2222-3333-4444-555555555555',
  endpoint: 'https://dataplane.rum.eu-west-1.amazonaws.com',
  telemetries: ['errors', 'http', ['performance', { recordAllTypes: ['css','script','img','fetch'] }]],
  allowCookies: true,
  enableXRay: true
};

const APPLICATION_ID = 'a1b2c3d4-...';
const APPLICATION_VERSION = '1.0.0';
const APPLICATION_REGION = 'eu-west-1';

// Hold the instance so you can record custom errors/events later.
export const awsRum = new AwsRum(APPLICATION_ID, APPLICATION_VERSION, APPLICATION_REGION, config);
Load the client as early as possible in the document head, before your app bundle. Web Vitals like Largest Contentful Paint and the navigation-timing entries are emitted by the browser early in page load; if the RUM client mounts after first paint it will miss them. Early load is the difference between a populated Web Vitals dashboard and an empty one.
A note on allowCookies: when true, the client stores a session ID and user ID in cookies so a session survives across page navigations and the per-session metrics (below) are accurate. With false, every page load looks like a new session, inflating SessionCount and breaking per-session ratios. Set it according to your consent posture, but understand what you lose.
Under the hood: how the browser is allowed to write to RUM
The one part of this section worth slowing down on is authentication, because it is where beginners either ship a security hole or give up. The browser is a hostile place to keep credentials — anything you put in JavaScript is readable by anyone who opens devtools. So RUM never uses long-lived keys. Instead the web client calls the Cognito identity pool’s GetId / GetCredentialsForIdentity to obtain temporary, unauthenticated (“guest”) AWS credentials, and uses those to sign the single API call it makes: rum:PutRumEvents against the RUM data plane.
When you pass --cw-log-enabled and let RUM manage identity, AWS creates the pool, the guest role, and a scoped role policy for you. That generated policy is deliberately tiny — it can do exactly one thing, to exactly one app monitor:
{
  "Version": "2012-10-17",
  "Statement": [{
    "Effect": "Allow",
    "Action": "rum:PutRumEvents",
    "Resource": "arn:aws:rum:eu-west-1:123456789012:appmonitor/kloudvin-web"
  }]
}
Two things follow. First, a leaked guest credential can only append RUM events to one monitor — it cannot read your data or touch anything else, which is why unauthenticated ingest is acceptable at all. Second, if you bring your own identity pool (common when you already authenticate users), you must attach exactly this permission to the role the pool hands out, and nothing more. Widening it “just to make it work” is the classic self-inflicted wound.
Beyond the built-in telemetry, the held awsRum instance lets you enrich the stream. recordEvent attaches a custom event type you can later query in Logs Insights, and session attributes (via sessionAttributes in config, or addSessionAttributes at runtime) become metadata dimensions on every event — a build SHA, an A/B cohort, a tenant tier:
awsRum.addSessionAttributes({ release: 'checkout@2.4.1', cohort: 'canary-10pct' });
awsRum.recordEvent('cart_abandoned', { step: 'shipping', itemCount: 3 });
That is how “LCP regressed” becomes “LCP regressed for the canary-10pct cohort on release 2.4.1” — the difference between a mystery and a one-click rollback.
2. Capturing Core Web Vitals, JS errors, and session/page performance
Once the performance, errors, and http telemetries are live, the app monitor emits a fixed set of CloudWatch metrics into the AWS/RUM namespace, every one carrying an application_name dimension equal to the monitor name. These are the metrics your SLOs and alarms key off. The ones that matter:
| Metric | Unit | What it measures |
|---|---|---|
WebVitalsLargestContentfulPaint |
ms | LCP - loading; the headline “is it fast” Web Vital |
WebVitalsCumulativeLayoutShift |
None | CLS - visual stability |
WebVitalsInteractionToNextPaint |
ms | INP - responsiveness (replaced FID as a Core Web Vital) |
WebVitalsFirstInputDelay |
ms | FID - legacy responsiveness signal |
PerformanceNavigationDuration |
ms | full navigation timing for a page load |
NavigationSatisfiedTransaction |
Count | navigations under the 2000ms Apdex objective |
NavigationToleratedTransaction |
Count | navigations between 2000ms and 8000ms |
NavigationFrustratedTransaction |
Count | navigations slower than the 8000ms frustrating threshold |
JsErrorCount |
Count | uncaught JS error events ingested |
Http5xxCount / Http4xxCount |
Count | fetch/XHR responses by status class |
PageViewCount |
Count | page-view events |
SessionCount |
Count | new sessions started |
A few things follow from this table. First, the Apdex split (Satisfied/Tolerated/Frustrated) is pre-bucketed against the standard 2000ms/8000ms thresholds, which is exactly the shape you want for a navigation-latency SLI - a count-based good/total ratio, not a quantile you have to estimate. Second, WebVitals* metrics are emitted with the value distribution, so you query them with the p75 statistic - the percentile Google’s Core Web Vitals thresholds are defined against (LCP good <= 2.5s, INP good <= 200ms, CLS good <= 0.1 at p75).
To catch errors your window.onerror handler swallows or that originate in a try/catch, record them explicitly through the held client:
try {
  await loadCheckout();
} catch (err) {
  awsRum.recordError(err);   // becomes a com.amazon.rum.js_error_event -> JsErrorCount
  showFallbackUI();
}
The raw events behind these aggregates land in a CloudWatch Logs log group named aws-rum/<app-monitor-id> (because you set --cw-log-enabled). That is where you go from “JsErrorCount spiked” to “which file, which line, which browser” - query it with Logs Insights:
fields @timestamp, event_details.message, event_details.fileName, event_details.lineNumber, metadata.browserName
| filter event_type = "com.amazon.rum.js_error_event"
| sort @timestamp desc
| limit 50
Aggregates vs raw events: two stores, two jobs
A subtle point that trips people up: RUM writes your data to two places with different shapes, retention, and cost, and you query them for different questions.
CloudWatch metrics (AWS/RUM) |
CloudWatch Logs (aws-rum/<id>) |
|
|---|---|---|
| Shape | Pre-aggregated numbers (counts, distributions) | One JSON document per raw event |
| Answers | “Is LCP p75 within budget? Are errors up?” | “Which file / line / browser / user threw it?” |
| Retention | 15 months (standard CloudWatch metric retention) | Whatever you set on the log group (default: never expire — fix this) |
| Cost model | Metric + query charges | Ingestion + storage per GB |
| Use for | Dashboards, SLOs, alarms | Root-cause drill-down, forensics |
Alarms and SLOs live on the metrics; investigations live in the logs. Wiring both is the whole point of --cw-log-enabled.
A few properties of the metric side reward attention. WebVitals* metrics are published as distributions, so you must read them with a percentile statistic — p75 specifically, because that is the aggregation Google’s Core Web Vitals thresholds are defined against (not the average, which quietly hides your worst quartile). In the console you pick the p75 statistic; from the CLI you pass --extended-statistics p75, as the Verify section shows. The FavoritePages you set on the monitor become a page-group dimension, letting you SLO /checkout separately from the marketing home page — essential, because a blended average lets a fast landing page mask a slow, revenue-critical funnel. RUM also derives a coarse geolocation (country/region) and device/browser dimension from each session, which is how you discover that “the site is slow” is really “the site is slow on Android Chrome in one country.”
3. Authoring Synthetics canaries: heartbeat, API, and broken-link blueprints
RUM tells you what users hit. Canaries tell you what would happen if a user hit you right now, including paths with no live traffic. A canary is a Lambda function built from your script plus a Synthetics runtime layer, invoked on a schedule, recording screenshots/HAR/logs to S3 and publishing pass/fail metrics. AWS ships blueprints for the three most common shapes; you can author them in the console, but encode them as IaC so they’re reviewable and reproducible.
Pin the runtime version explicitly. The current Node/Puppeteer line is syn-nodejs-puppeteer-12.0 and the Playwright line is syn-nodejs-playwright-4.0; AWS deprecates old runtimes on a published schedule, so a hard-coded version is a thing you must keep current, not set-and-forget.
Heartbeat - load a URL, assert it rendered, capture a screenshot. The smallest useful canary:
const { URL } = require('url');
const synthetics = require('Synthetics');
const log = require('SyntheticsLogger');

const pageLoadBlueprint = async function () {
  const url = 'https://app.kloudvin.com/';
  const page = await synthetics.getPage();

  // executeStep names the step -> SuccessPercent/Duration get a StepName dimension
  await synthetics.executeStep('loadHomepage', async function () {
    const response = await page.goto(url, { waitUntil: 'domcontentloaded', timeout: 30000 });
    if (!response || response.status() < 200 || response.status() > 299) {
      throw new Error(`Failed to load ${url}: status ${response && response.status()}`);
    }
  });

  await synthetics.executeStep('verifyContent', async function () {
    await page.waitForSelector('#app', { timeout: 15000 });
  });
};

exports.handler = async () => {
  return await pageLoadBlueprint();
};
API canary - exercise an endpoint and validate status, headers, and body without a browser. Use executeHttpStep, which is purpose-built for request/response assertions and emits per-step 2xx/4xx/5xx metrics:
const synthetics = require('Synthetics');

const apiCanary = async function () {
  const validate = async function (res) {
    return new Promise((resolve, reject) => {
      if (res.statusCode !== 200) {
        reject(new Error(`${res.statusCode} ${res.statusMessage}`));
        return;
      }
      let body = '';
      res.on('data', (d) => { body += d; });
      res.on('end', () => {
        const json = JSON.parse(body);
        if (json.status !== 'ok') reject(new Error(`bad payload: ${body}`));
        else resolve();
      });
    });
  };

  await synthetics.executeHttpStep('GET /healthz', {
    hostname: 'api.kloudvin.com',
    method: 'GET',
    path: '/healthz',
    port: 443,
    protocol: 'https:',
    headers: { 'User-Agent': synthetics.getCanaryUserAgentString() }
  }, validate);
};

exports.handler = async () => {
  return await apiCanary();
};
Broken-link checker - crawl a page, follow its links, and fail when any returns an error. The runtime provides LinkChecker/addLinks/checkLinks:
const synthetics = require('Synthetics');
const SyntheticsLink = require('SyntheticsLink');

const brokenLinkChecker = async function () {
  const baseUrl = 'https://app.kloudvin.com/';
  const syntheticsConfiguration = synthetics.getConfiguration();
  syntheticsConfiguration.setConfig({ continueOnStepFailure: true });

  let page = await synthetics.getPage();
  await synthetics.executeStep('openBase', async () => {
    await page.goto(baseUrl, { waitUntil: 'domcontentloaded', timeout: 30000 });
  });

  const hrefs = await page.$$eval('a[href]', (as) => as.map((a) => a.href).slice(0, 20));
  for (const href of hrefs) {
    const link = new SyntheticsLink(href);
    await synthetics.executeStep(`link:${href}`, async () => {
      const res = await page.goto(href, { waitUntil: 'domcontentloaded', timeout: 20000 });
      link.withStatusCode(res.status()).withText(href);
      await synthetics.addLinkToReport(link);
      if (res.status() < 200 || res.status() > 399) {
        throw new Error(`Broken link ${href}: ${res.status()}`);
      }
    });
  }
};

exports.handler = async () => {
  return await brokenLinkChecker();
};
Provision the canary itself with Terraform so the schedule, runtime, artifact bucket, and alarm live together:
resource "aws_synthetics_canary" "homepage_heartbeat" {
  name                 = "kv-homepage"            # <= 21 chars, lowercase
  artifact_s3_location = "s3://${aws_s3_bucket.canary_artifacts.id}/homepage/"
  execution_role_arn   = aws_iam_role.canary.arn
  runtime_version      = "syn-nodejs-puppeteer-12.0"
  handler              = "pageLoadBlueprint.handler"
  zip_file             = data.archive_file.heartbeat.output_path

  schedule {
    expression = "rate(1 minute)"   # cadence == your detection latency floor
  }

  run_config {
    timeout_in_seconds = 60
    memory_in_mb       = 1024
    active_tracing     = true       # write canary spans to X-Ray
  }

  success_retention_period = 7      # days of artifacts kept for passing runs
  failure_retention_period = 31     # keep failures longer for forensics

  start_canary = true
}
4. Scheduling canaries across regions and alerting on SuccessPercent
Every canary publishes to the CloudWatchSynthetics namespace. Two metrics are always emitted, both with and without a CanaryName dimension: SuccessPercent (percentage of runs in the period that passed) and Duration (run time in ms). Canaries using executeStep/executeHttpStep additionally emit SuccessPercent and Duration per step (CanaryName + StepName), and HTTP-step canaries emit 2xx/4xx/5xx/Failed. SuccessPercent is what you page on - it’s already a clean availability percentage.
Two scheduling decisions drive coverage:
- Cadence is your detection-latency floor. A
rate(1 minute)canary cannot detect an outage faster than ~1 minute. Tighter cadence buys faster detection at linear cost (section 7). Run business-critical journeys at 1 minute, secondary paths at 5. - Geography is real. A canary in
eu-west-1will not catch a CloudFront edge or Route 53 issue affectingus-west-2users. Deploy the same canary to several regions and alarm per region. Single-region synthetic monitoring gives false confidence the moment the problem is regional or DNS-level.
The alarm is the product. Alarm on SuccessPercent below a threshold so any run-level failure trips it, and use breaching as the missing-data treatment so a canary that stops running entirely (a broken deploy, an IAM regression) is itself an alert:
resource "aws_cloudwatch_metric_alarm" "homepage_down" {
  alarm_name          = "kv-homepage-down-eu-west-1"
  namespace           = "CloudWatchSynthetics"
  metric_name         = "SuccessPercent"
  dimensions          = { CanaryName = aws_synthetics_canary.homepage_heartbeat.name }
  statistic           = "Average"
  period              = 60
  evaluation_periods  = 3
  datapoints_to_alarm = 2          # 2 of last 3 runs failing -> page (debounces a flaky run)
  comparison_operator = "LessThanThreshold"
  threshold           = 90         # < 90% of runs in the window succeeded
  treat_missing_data  = "breaching"
  alarm_actions       = [aws_sns_topic.pager.arn]
  ok_actions          = [aws_sns_topic.pager.arn]
}
The datapoints_to_alarm = 2 of evaluation_periods = 3 (an “M of N” alarm) is what keeps a single transient failure - one slow third party, one TCP reset - from waking someone, while a genuine outage (two consecutive misses) still pages within ~2 minutes.
5. Correlating RUM and canary data with X-Ray traces for root cause
Detection without correlation just tells you that something broke. The win is jumping from a degraded frontend signal straight to the offending backend span. AWS wires three planes together if you opt in.
On the RUM side, enableXRay: true makes the web client generate an X-Ray trace header for each instrumented fetch/XHR and emit a trace segment for the browser-side request. When that request reaches an X-Ray-instrumented backend (ALB, API Gateway, Lambda, your ADOT-instrumented EKS service), the IDs line up and the X-Ray service map shows a node for your client application feeding into the backend graph - so a JS Http5xxCount spike is one click from the failing downstream segment.
On the canary side, active_tracing = true (the run_config flag above) makes the canary’s outbound calls participate in X-Ray. A failing API canary then carries a trace ID, and the trace shows exactly which hop errored - DNS, TLS, the ALB, or the service - turning “the API canary is red” into “the orders service returned a 503 on the database call.”
Correlation only works if the trace context propagates end to end. If an intermediary (a misconfigured CloudFront behavior, an ALB rule, a service that doesn’t forward
X-Amzn-Trace-Id) drops the header, the IDs break and you get orphaned segments instead of one connected map. Verify propagation deliberately - it is the single most common reason RUM-to-X-Ray correlation silently does nothing.
The practical triage loop becomes: alarm fires on canary SuccessPercent or RUM Http5xxCount -> open the failed run / RUM session -> follow its trace ID into the X-Ray service map -> read the faulting segment. Minutes, not a war-room.
6. Defining frontend availability and latency SLOs from RUM metrics
You already do SLOs for backend services as good/valid event ratios. RUM lets you extend the same discipline to the browser, with two user-facing SLIs.
Availability SLI - page loads not broken by errors. The cleanest proxy from the default metrics is server-error rate experienced in the browser: good = page views - sessions/views with errors, bad = Http5xxCount (+ JsErrorCount for hard failures). Compute a success ratio with a CloudWatch metric-math expression over the AWS/RUM namespace:
# Metric math on AWS/RUM (dimension application_name = kloudvin-web)
m1 = JsErrorCount        (Sum)
m2 = Http5xxCount        (Sum)
m3 = PageViewCount       (Sum)
e1 = 100 * (1 - (m1 + m2) / m3)     # frontend success %, the SLI you SLO against
Latency SLI - navigations that felt fast. The Apdex buckets are tailor-made: good = NavigationSatisfiedTransaction, valid = Satisfied + Tolerated + Frustrated. That is a count-based ratio against the 2000ms objective with no quantile estimation:
s = NavigationSatisfiedTransaction (Sum)
t = NavigationToleratedTransaction (Sum)
f = NavigationFrustratedTransaction (Sum)
fast_pct = 100 * s / (s + t + f)    # % of navigations under the 2000ms Apdex objective
Separately, track the Core Web Vitals at p75 against Google’s thresholds, because that is how Search and field-data tools judge you: LCP good <= 2500ms, INP good <= 200ms, CLS good <= 0.1. Alarm on the p75 statistic of WebVitalsLargestContentfulPaint and WebVitalsInteractionToNextPaint.
Then put a multi-window burn-rate discipline on the availability SLI exactly as you would for a backend SLO: a fast-burn alarm (e.g. 14.4x burn over 1h) for “we’re torching the budget now,” and a slow-burn alarm (e.g. 6x over 6h) for “a low-grade regression is quietly eating the month.” Synthetic SuccessPercent is the leading indicator (catches outages with zero live traffic); RUM ratios are the ground truth (what users actually got). Page on the canary, report the SLO on RUM.
Managed SLOs with CloudWatch Application Signals, and composite alarms
The metric-math SLIs above are portable and explicit, and for many teams they are enough. But CloudWatch also offers a managed SLO primitive — CloudWatch Application Signals SLOs — that removes the hand-rolled burn-rate math. You point an SLO at a metric (including a RUM or Synthetics metric, or a metric-math expression over them), declare the objective and rolling window, and Application Signals computes attainment and the remaining error budget for you, renders the burn-down, and can attach burn-rate alarms without you deriving the 14.4× threshold by hand.
Sketching the availability SLO from below as an Application Signals SLO:
{
  "Name": "frontend-availability",
  "Sli": {
    "SliMetric": {
      "MetricDataQueries": [
        { "Id": "m1", "ReturnData": false, "MetricStat": { "Period": 60, "Stat": "Sum",
          "Metric": { "Namespace": "AWS/RUM", "MetricName": "JsErrorCount",
            "Dimensions": [{ "Name": "application_name", "Value": "kloudvin-web" }] } } },
        { "Id": "m3", "ReturnData": false, "MetricStat": { "Period": 60, "Stat": "Sum",
          "Metric": { "Namespace": "AWS/RUM", "MetricName": "PageViewCount",
            "Dimensions": [{ "Name": "application_name", "Value": "kloudvin-web" }] } } },
        { "Id": "e1", "ReturnData": true, "Expression": "100 * (1 - m1/m3)" }
      ]
    },
    "MetricThreshold": 99.5,
    "ComparisonOperator": "GreaterThanOrEqualToThreshold"
  },
  "Goal": {
    "AttainmentGoal": 99.5,
    "WarningThreshold": 30.0,
    "Interval": { "RollingInterval": { "Duration": 30, "DurationUnit": "DAY" } }
  }
}
The other production pattern to reach for is the composite alarm. Frontend health is a fleet of signals — canary SuccessPercent, RUM Http5xxCount, LCP p75 — and paging on each one independently produces alert storms during a real incident (they all fire at once) and false pages during a blip (one flickers). A composite alarm expresses the human judgement in Boolean logic, so on-call gets one page that already encodes “this is really broken”:
resource "aws_cloudwatch_composite_alarm" "frontend_unhealthy" {
  alarm_name = "frontend-unhealthy"
  alarm_rule = join(" OR ", [
    "ALARM(${aws_cloudwatch_metric_alarm.homepage_down.alarm_name})",
    "(ALARM(rum-http5xx-high) AND ALARM(rum-lcp-p75-slow))"
  ])
  alarm_actions = [aws_sns_topic.pager.arn]
}
Read the rule: page if the heartbeat canary is down or if real users are simultaneously seeing elevated 5xx and slow LCP. A single slow-LCP blip with healthy errors stays quiet; a genuine regression pages once. That is how you keep an SLO program from training on-call to ignore it.
7. Sampling, data retention, and managing RUM/Synthetics cost
Both services bill on volume, and both have a single dominant lever.
RUM is priced per RUM event ingested (every page view, error, navigation, resource, and Web Vital is an event), so cost scales with traffic x events-per-session x SessionSampleRate. Controls, highest leverage first:
SessionSampleRateis the master dial. Dropping from 1.0 to 0.2 cuts ingested events ~5x while still giving statistically sound Web Vitals and error rates for a high-traffic app. Sample lower on a busy consumer site, higher (up to 1.0) on a low-traffic internal app where you need every session.- Trim
telemetriesand resource recording. Theperformanceplugin’srecordAllTypes/eventLimitcontrol how many resource-timing events each page emits; an unbounded list on an asset-heavy page is a quiet event-multiplier. Record the resource types you’ll actually query. - Raw-event logs cost separately.
--cw-log-enabledwrites every sampled event to CloudWatch Logs (storage + ingestion) on top of RUM ingestion. Keep it on for debuggability, but put a retention policy on theaws-rum/<id>log group instead of the default never-expire.
Synthetics is priced per canary run. Cost scales linearly with (number of canaries) x (runs per hour) x (regions) - which is precisely the cross-product you expand for coverage in section 4. So treat cadence as a budget: 1-minute on a handful of revenue-critical journeys, 5- to 15-minute on the long tail. The two artifact retention knobs (success_retention_period, failure_retention_period) govern S3 storage; the asymmetric default in our Terraform - 7 days for passes, 31 for failures - keeps forensics cheap without hoarding green screenshots.
Cost on both services is a deliberate trade against statistical power and detection latency, not an afterthought. Set
SessionSampleRateand canary cadence per application based on traffic and how much downtime that journey can tolerate - one global default is always wrong somewhere.
Going deeper
The canary execution role is the thing to get right
A canary is a Lambda, and like any Lambda it assumes an execution role. Console-created canaries generate a role that is often broader than you want; in IaC you write it explicitly and least-privilege. A canary genuinely needs four capabilities and no more: write artifacts to its S3 prefix, publish the CloudWatchSynthetics metrics, write its CloudWatch Logs, and — if active_tracing is on — put X-Ray segments.
{
  "Version": "2012-10-17",
  "Statement": [
    { "Sid": "Artifacts", "Effect": "Allow",
      "Action": ["s3:PutObject", "s3:GetBucketLocation"],
      "Resource": "arn:aws:s3:::kv-canary-artifacts/*" },
    { "Sid": "ArtifactBucketList", "Effect": "Allow",
      "Action": "s3:ListAllMyBuckets", "Resource": "*" },
    { "Sid": "Metrics", "Effect": "Allow",
      "Action": "cloudwatch:PutMetricData", "Resource": "*",
      "Condition": { "StringEquals": { "cloudwatch:namespace": "CloudWatchSynthetics" } } },
    { "Sid": "Logs", "Effect": "Allow",
      "Action": ["logs:CreateLogStream", "logs:PutLogEvents", "logs:CreateLogGroup"],
      "Resource": "arn:aws:logs:eu-west-1:123456789012:log-group:/aws/lambda/cwsyn-*" },
    { "Sid": "Xray", "Effect": "Allow",
      "Action": ["xray:PutTraceSegments", "xray:PutTelemetryRecords"], "Resource": "*" }
  ]
}
The cloudwatch:PutMetricData statement is scoped by a condition on the namespace — without it, a compromised canary script could scribble into any metric in your account, including the very metrics your alarms trust. That one condition is the difference between a monitoring role and a blank cheque.
Running a canary inside a VPC
By default a canary runs in AWS-managed network space and can reach the public internet. Point it at a private endpoint — an internal ALB, a service only reachable inside your VPC, a /healthz that is not exposed — and it must run in the VPC. You attach subnets and a security group; Synthetics creates an elastic network interface (ENI) in each subnet, exactly like a VPC Lambda:
resource "aws_synthetics_canary" "internal_api" {
  name             = "kv-internal-api"
  # ... runtime, handler, role, schedule as in section 3 ...
  vpc_config {
    subnet_ids         = [aws_subnet.private_a.id, aws_subnet.private_b.id]
    security_group_ids = [aws_security_group.canary.id]
  }
}
Two gotchas decide whether this works. First, a canary in private subnets has no public-internet path unless those subnets route through a NAT gateway — so a canary that hits both an internal service and a public cloudfront.net URL needs NAT, or it hangs on the public leg and fails with a timeout that looks like an outage. Second, the canary’s security group and the target’s security group must both allow the flow; a red canary that is really a missing SG rule is a self-inflicted 3am page. Prefer VPC endpoints (an S3 gateway endpoint for artifacts) to keep artifact writes off the NAT path and cheaper.
Runtimes age out — pin, then upgrade deliberately
| Runtime family | Engine | Language | Reach for it when |
|---|---|---|---|
syn-nodejs-puppeteer-N |
Chromium + Puppeteer | Node.js | GUI workflows, screenshots, the broken-link checker |
syn-nodejs-playwright-N |
Chromium + Playwright | Node.js | Newer GUI canaries; richer auto-waiting and selectors |
syn-python-selenium-N |
Chromium + Selenium | Python | Your team standardised on Python/Selenium |
AWS deprecates old runtime versions on a published schedule; a canary left on a deprecated runtime eventually stops getting patches and can be blocked from create/update. So runtime_version is not set-and-forget — treat a runtime bump like any dependency upgrade: pin it explicitly (never “latest”), watch the deprecation calendar, and roll it on one canary you can revert first. The syn-nodejs-puppeteer-12.0 / syn-nodejs-playwright-4.0 versions used in this lesson are current at the time of writing; confirm the latest before you copy them.
The SyntheticsConfiguration object exposes the knobs that decide cost and forensic value per run: screenshotOnStepStart / screenshotOnStepFailure (turn off success screenshots on high-frequency canaries to cut S3), harFile (capture the HAR waterfall — gold for “which request was slow”, but heavier), continueOnStepFailure (the broken-link checker sets this so one dead link does not abort the crawl), and includeRequestHeaders / restrictedHeaders (keep Authorization out of the HAR that lands in S3 — a real data-leak vector).
What RUM actually sends, and why sampling is per-session
The web client batches events and flushes them to the data plane periodically and on page-hide (using the browser’s sendBeacon, so the final batch survives a tab close). Sampling is decided once per session, not per event: when a session is admitted at SessionSampleRate = 0.2, all of its events are recorded; when it is dropped, none are. That is deliberate — it keeps each recorded session internally consistent (you never get a page-view whose errors were sampled away), and it means “20% sampling” is 20% of sessions, so per-session ratios (errors per session, Web Vitals distributions) stay statistically valid; you are simply working from a representative subsample.
That subsample is why cost and confidence trade off cleanly. Web Vitals are distributional, so a few thousand sampled sessions already pin p75 tightly; error rate needs more volume to catch rare errors, which is the argument for sampling lower on a firehose consumer site but at 1.0 on a low-traffic internal app where every session is precious. The formula to internalise: events ≈ sessions × sample_rate × events_per_session, and events_per_session climbs with page views and, especially, with unbounded resource-timing capture — which is the quiet multiplier recordAllTypes / eventLimit exist to cap.
Quotas, throttling, and blast radius
| Limit | Rough default | Why you hit it |
|---|---|---|
| Canaries per account / region | 100 (soft) | Fan-out of journeys × regions adds up fast |
| RUM app monitors per account | 10 (soft) | One per app/environment; request an increase for many apps |
PutRumEvents request rate |
Throttled per app monitor | A traffic spike at 1.0 sampling can hit it — another reason to sample |
| Canary name | ≤ 21 chars, lowercase | Terraform fails late if you forget |
The soft limits are raised via a Service Quotas request, but they still shape design: run the same journey in several regions rather than minting a unique canary per micro-path, and consolidate RUM app monitors per application rather than per page.
A cost worked example
Put numbers on it. A consumer site with 2 million sessions/day, ~30 events/session:
- At
SessionSampleRate = 1.0: 2,000,000 × 30 = 60M RUM events/day. - At
0.15: 300,000 × 30 = 9M events/day — an ~85% cut, still 300k sampled sessions/day, which is far more than enough for a stable p75 Web Vitals SLO.
Now canaries: one heartbeat at rate(1 minute) = 1,440 runs/day per region. Across 3 regions = 4,320 runs/day. Add a 5-minute API canary in the same 3 regions = 288 × 3 = 864 more. The lever is visible: dropping the heartbeat to rate(5 minutes) cuts its runs 5× but quintuples your worst-case detection latency. That is the trade — detection latency priced in canary runs — and it should be made per journey, not by one global default. Raw-event Logs and canary S3 artifacts are separate line items; a retention policy on both is the cheapest money you will ever save.
When these are the wrong tool
RUM and Synthetics are web-first. For a native mobile app, the RUM web client does not apply — reach for a mobile RUM SDK (a third-party APM, or roll your own telemetry to CloudWatch). For deep transaction tracing across many microservices, RUM and canaries detect and localise but X-Ray (or an OpenTelemetry pipeline) does the causal work — which is exactly why the correlation in section 5 matters. And a canary is a poor load test: it is a correctness probe on a schedule, not a concurrency generator — use a load-testing tool for that and keep the canary as your steady-state heartbeat.
Verify
Confirm the whole pipeline is actually emitting before you trust the dashboards.
Check the app monitor exists, is ingesting, and is logging raw events:
aws rum get-app-monitor --name kloudvin-web --region eu-west-1 \
  --query 'AppMonitor.{State:State,Log:DataStorage.CwLog.CwLogEnabled,Sample:AppMonitorConfiguration.SessionSampleRate}'
Confirm RUM metrics are flowing into AWS/RUM (load the site in a browser first, then give it a minute):
aws cloudwatch list-metrics --namespace AWS/RUM \
  --dimensions Name=application_name,Value=kloudvin-web \
  --region eu-west-1 --query 'Metrics[].MetricName'
Check p75 LCP over the last hour - this is your headline Web Vital:
aws cloudwatch get-metric-statistics --namespace AWS/RUM \
  --metric-name WebVitalsLargestContentfulPaint \
  --dimensions Name=application_name,Value=kloudvin-web \
  --start-time "$(date -u -v-1H +%Y-%m-%dT%H:%M:%SZ)" \
  --end-time "$(date -u +%Y-%m-%dT%H:%M:%SZ)" \
  --period 3600 --extended-statistics p75 --region eu-west-1
Confirm the canary ran and check its last result, then verify SuccessPercent exists:
aws synthetics get-canary-runs --name kv-homepage --max-results 3 --region eu-west-1 \
  --query 'CanaryRuns[].{Status:Status.State,Started:Timeline.Started}'

aws cloudwatch list-metrics --namespace CloudWatchSynthetics \
  --dimensions Name=CanaryName,Value=kv-homepage --region eu-west-1 \
  --query 'Metrics[].MetricName'
Prove the alarm actually pages: temporarily point the heartbeat at a path that returns 500 (or stop the canary) and confirm the alarm transitions to ALARM and SNS delivers. An alarm you have never seen fire is a hypothesis, not a control.
aws cloudwatch describe-alarms --alarm-names kv-homepage-down-eu-west-1 \
  --region eu-west-1 --query 'MetricAlarms[].{State:StateValue,Reason:StateReason}'
Enterprise scenario
A retail platform team ran a single-page checkout behind CloudFront, with a eu-west-1 heartbeat canary on rate(5 minutes) and RUM at 100% sampling. During a Black Friday dry run they hit two problems at once. First, RUM ingestion costs were projected to roughly 5x their normal monthly bill under peak traffic, because 100% sampling on a high-traffic site multiplies events per session by the navigation count. Second - and worse - a canary deploy in week one had silently failed to roll out the new runtime, the canary stopped running, and because their alarm treated missing data as notBreaching, the monitor going dark looked identical to “all healthy.” They found it only because a manual smoke test caught a real checkout 500 the dead canary had missed.
The constraint: cut RUM cost without going blind on Web Vitals, and make canary silence itself an incident, across the three regions their customers actually came from.
The fix had three parts. They dropped SessionSampleRate to 0.15 (still tens of thousands of sampled sessions/day - more than enough for stable p75 Web Vitals and error rates), put a 14-day retention policy on the raw-event log group, deployed the checkout heartbeat to eu-west-1, eu-central-1, and us-east-1 at rate(1 minute), and changed every alarm to treat_missing_data = "breaching" so a canary that stops emitting pages on its own. The alarm that turned “we’ll find out next dry run” into “we find out in two minutes”:
resource "aws_cloudwatch_metric_alarm" "checkout_down" {
  alarm_name          = "checkout-down-${var.region}"
  namespace           = "CloudWatchSynthetics"
  metric_name         = "SuccessPercent"
  dimensions          = { CanaryName = "checkout-${var.region}" }
  statistic           = "Average"
  period              = 60
  evaluation_periods  = 3
  datapoints_to_alarm = 2
  comparison_operator = "LessThanThreshold"
  threshold           = 90
  treat_missing_data  = "breaching"   # the line that made silence an incident
  alarm_actions       = [aws_sns_topic.checkout_pager.arn]
}
Net result: projected RUM spend dropped ~85% against the 100%-sampling baseline with no loss of confidence in the p75 Web Vitals SLO, and on the actual Black Friday a CloudFront edge issue affecting only us-east-1 users tripped the us-east-1 canary nine minutes before the first customer complaint - exactly the regional failure the single-region setup would have missed.
Practice challenges
Work these in order; each has a hidden solution and a one-line why in the collapsible block. Everything uses placeholder names — swap in your own. No live AWS account is assumed; the point is that each answer is real and schema-correct.
1. (Beginner) Stand up an app monitor. Create a RUM app monitor shop-web for domain shop.example.com with 25% session sampling, X-Ray on, and raw-event logging on, in eu-west-1.
<details><summary>Solution</summary>
aws rum create-app-monitor \
  --name shop-web \
  --domain shop.example.com \
  --cw-log-enabled \
  --app-monitor-configuration '{
    "AllowCookies": true, "EnableXRay": true,
    "SessionSampleRate": 0.25, "Telemetries": ["errors","performance","http"]
  }' \
  --region eu-west-1
Why: SessionSampleRate: 0.25 and --cw-log-enabled are the two decisions with cost consequences; everything else is default-safe.
</details>
2. (Beginner) Find the top JS errors. JsErrorCount just spiked. Write the Logs Insights query that lists the offending file, line, and browser for the last hour.
<details><summary>Solution</summary>
fields @timestamp, event_details.message, event_details.fileName,
       event_details.lineNumber, metadata.browserName
| filter event_type = "com.amazon.rum.js_error_event"
| sort @timestamp desc
| limit 50
Why: the metric tells you errors rose; only the raw events in the aws-rum/<id> log group tell you which error — which is the whole reason to enable logging.
</details>
3. (Intermediate) Express the availability SLI. Using AWS/RUM metrics, write the metric-math for “percentage of page views not hit by a JS error or a 5xx.”
<details><summary>Solution</summary>
m1 = JsErrorCount   (Sum)
m2 = Http5xxCount    (Sum)
m3 = PageViewCount   (Sum)
e1 = 100 * (1 - (m1 + m2) / m3)    # frontend success %  ->  SLO against 99.5
Why: an SLI must be a good/valid ratio, not a raw count — a spike in errors only matters relative to how many page views absorbed it. </details>
4. (Intermediate) Page when — and only when — it is real. Terraform a SuccessPercent alarm on canary kv-homepage that pages after 2 of 3 one-minute runs fail, and that also pages if the canary stops running entirely.
<details><summary>Solution</summary>
resource "aws_cloudwatch_metric_alarm" "homepage_down" {
  alarm_name          = "kv-homepage-down"
  namespace           = "CloudWatchSynthetics"
  metric_name         = "SuccessPercent"
  dimensions          = { CanaryName = "kv-homepage" }
  statistic           = "Average"
  period              = 60
  evaluation_periods  = 3
  datapoints_to_alarm = 2
  comparison_operator = "LessThanThreshold"
  threshold           = 90
  treat_missing_data  = "breaching"    # a dead canary is itself the alert
  alarm_actions       = [aws_sns_topic.pager.arn]
}
Why: datapoints_to_alarm = 2 of 3 debounces one flaky run, while treat_missing_data = "breaching" closes the “monitor went dark = looks healthy” trap.
</details>
5. (Advanced) Deploy one journey to three regions. Using Terraform for_each, deploy the same heartbeat canary and its alarm to eu-west-1, eu-central-1, and us-east-1, each alarming on its own region.
<details><summary>Solution</summary>
Define per-region provider aliases, then iterate a set of regions:
locals { regions = toset(["eu-west-1", "eu-central-1", "us-east-1"]) }

resource "aws_synthetics_canary" "hb" {
  for_each             = local.regions
  provider             = aws.by_region[each.key]           # one aliased provider per region
  name                 = "kv-hb-${replace(each.key, "-", "")}"  # <= 21 chars, lowercase
  runtime_version      = "syn-nodejs-puppeteer-12.0"
  handler              = "pageLoad.handler"
  artifact_s3_location = "s3://kv-canary-${each.key}/hb/"
  execution_role_arn   = aws_iam_role.canary[each.key].arn
  zip_file             = data.archive_file.hb.output_path
  schedule { expression = "rate(1 minute)" }
  start_canary = true
}

resource "aws_cloudwatch_metric_alarm" "hb_down" {
  for_each            = local.regions
  provider            = aws.by_region[each.key]
  alarm_name          = "kv-hb-down-${each.key}"
  namespace           = "CloudWatchSynthetics"
  metric_name         = "SuccessPercent"
  dimensions          = { CanaryName = aws_synthetics_canary.hb[each.key].name }
  statistic           = "Average"
  period              = 60
  evaluation_periods  = 3
  datapoints_to_alarm = 2
  comparison_operator = "LessThanThreshold"
  threshold           = 90
  treat_missing_data  = "breaching"
  alarm_actions       = [aws_sns_topic.pager[each.key].arn]
}
Why: a single-region canary gives false confidence the instant the failure is regional (a CloudFront edge, a Route 53 / DNS issue) — coverage means the same journey alarmed per region. </details>
6. (Advanced) One page, not an alert storm. Combine the heartbeat canary alarm with two RUM alarms (Http5xxCount high and WebVitalsLargestContentfulPaint p75 slow) so on-call is paged once for “canary down, OR real users seeing both errors and slow loads.”
<details><summary>Solution</summary>
resource "aws_cloudwatch_composite_alarm" "frontend_unhealthy" {
  alarm_name = "frontend-unhealthy"
  alarm_rule = join(" OR ", [
    "ALARM(kv-homepage-down)",
    "(ALARM(rum-http5xx-high) AND ALARM(rum-lcp-p75-slow))"
  ])
  alarm_actions = [aws_sns_topic.pager.arn]
}
Why: a composite alarm encodes the human judgement — page on a hard down, or on the conjunction of error and latency — so one real incident is one page, and a lone LCP blip stays quiet. </details>
Common beginner mistakes
- “RUM is enough — real users cover everything.” Real users only cover paths real users hit, while they are hitting them. The checkout no one touches at 3am, or a page behind a feature flag, is invisible to RUM until it has already failed a customer. Right model: RUM is ground truth for traffic you have; canaries cover traffic you do not. Ship both.
- “Synthetics is enough — the canary is green.” A green canary from one region exercising one scripted path says nothing about the diversity of real devices, networks, and geographies. Users on a slow Android in another country can be suffering while your
eu-west-1heartbeat is perfectly happy. Right model: the canary is a leading indicator, not the SLO; report the SLO on RUM. - “I’ll load the RUM snippet at the bottom of the page.” LCP and the navigation-timing entries are emitted by the browser early in page load; a client that mounts after first paint misses them and your Web Vitals dashboard sits empty. Right model: load
aws-rum-webas early as possible in<head>, before the app bundle. - “100% sampling is the safe default.” On a high-traffic site,
SessionSampleRate: 1.0can multiply your CloudWatch bill severalfold and even throttlePutRumEvents— for statistically identical p75 Web Vitals you would get at 15%. Right model: sampling is a per-app dial set against traffic and how rare the errors you chase are;1.0belongs on low-traffic internal apps, not a firehose. - “A dead canary means everything’s fine.” With
treat_missing_data = "notBreaching", a canary that stops emitting (a bad deploy, an IAM regression, a deprecated runtime) looks identical to “all healthy” — the most dangerous failure mode in the whole system. Right model:treat_missing_data = "breaching"so silence itself pages. - “Alarm on the average of the Web Vitals.” Averaging LCP hides your worst quartile and is not how anyone judges you — Google’s thresholds are defined at p75. An average that looks fine can sit on top of a p75 that is failing Search. Right model: alarm on the
p75(extended) statistic against the 2.5 s / 200 ms / 0.1 thresholds. - “I widened the Cognito guest role to make it work.” The guest role should grant exactly
rum:PutRumEventson the one app monitor. Any broader, and a credential anyone can pull out of your JavaScript becomes a foothold. Right model: the browser identity is the tightest role in your account, not a convenient one. - “One global cadence and sample rate for everything.” A single default is always wrong somewhere — too expensive on the busy path, too slow to detect on the critical one. Right model: set canary cadence and RUM sampling per journey, priced against revenue impact and tolerable downtime.
Glossary
- RUM (Real User Monitoring) — passive monitoring that records what real browsers actually experienced. On AWS, this is CloudWatch RUM.
- Synthetics / canary — active monitoring: a scripted, scheduled probe (a canary) that generates traffic to test a path whether or not real users are on it.
- App monitor — the AWS-side RUM resource that ingests browser events, emits
AWS/RUMmetrics, and (optionally) stores raw events in CloudWatch Logs. - Web client (
aws-rum-web) — the JavaScript library/snippet that runs in the browser and posts events to the RUM data plane. - Cognito identity pool — the service that hands the browser temporary, unauthenticated (“guest”) credentials so it can call
rum:PutRumEventswithout any long-lived key. PutRumEvents— the single RUM data-plane API the web client calls to send a batch of events.- Core Web Vitals — Google’s user-centric performance metrics: LCP (Largest Contentful Paint, loading), INP (Interaction to Next Paint, responsiveness; replaced FID), CLS (Cumulative Layout Shift, visual stability). Judged at p75.
- FID (First Input Delay) — the legacy responsiveness Web Vital, superseded by INP.
- Apdex buckets — RUM’s pre-bucketed navigation counts: Satisfied (≤ 2 s), Tolerated (2–8 s), Frustrated (> 8 s) — a ready-made latency SLI.
- Session / page view — a session is one user’s visit (tracked via a cookie when
allowCookiesis on); a page view is one navigation within it. SessionSampleRate— the fraction of sessions recorded (0–1). The master cost and volume dial; sampling is decided once per session, not per event.- Telemetry / plugin — a RUM client module:
errors(JS errors),performance(navigation/resource/Web Vitals),http(fetch/XHR). - Blueprint — a starter canary template: heartbeat, API, broken-link, GUI-workflow, and more.
- Runtime version — the Synthetics engine layer, e.g.
syn-nodejs-puppeteer-12.0(Node+Puppeteer),syn-nodejs-playwright-4.0, orsyn-python-selenium-*. Deprecated on a schedule — pin and upgrade deliberately. - HAR file — HTTP Archive: a canary’s per-request waterfall, written to S3 for “which request was slow” forensics.
SuccessPercent/Duration— the two always-emittedCloudWatchSyntheticsmetrics: percent of runs that passed, and run time in ms.executeStep/executeHttpStep— Synthetics helpers that name a step so it gets its ownSuccessPercent/Duration(and, for HTTP,2xx/4xx/5xx) metrics.- SLI (Service Level Indicator) — the measured good/valid ratio, e.g. error-free page views ÷ page views.
- SLO (Service Level Objective) — the target for an SLI over a window, e.g. 99.5% availability over 30 days.
- Error budget — the allowed shortfall (100% − SLO); burning it is how you decide to slow down and fix.
- Burn rate — how fast you are consuming the error budget; a multi-window burn-rate alarm pairs a fast window (e.g. 14.4× over 1 h) with a slow one (e.g. 6× over 6 h).
- Composite alarm — a CloudWatch alarm whose state is a Boolean rule over other alarms, so on-call gets one page instead of a storm.
- Application Signals SLO — CloudWatch’s managed SLO primitive: declare objective + window and it computes attainment and error budget for you.
- M-of-N alarm —
datapoints_to_alarmofevaluation_periods; debounces transient failures (2 of 3) without hiding real ones. treat_missing_data = "breaching"— the alarm setting that turns missing data (a canary that stopped running) into an alert instead of silence.- Metric math — CloudWatch expressions (
e1 = 100*(1-(m1+m2)/m3)) that derive an SLI from raw metrics without exporting them.