In a nutshell
Picture a busy shipping warehouse. In the bad version, every parcel that arrives is a handwritten sticky note tossed onto one giant heap. To answer “how many parcels from Acme went to the wrong city today?” someone has to read the entire pile by hand. That heap is what free-text logs (printf strings) feel like the moment you have real traffic.
A structured logging pipeline turns that heap into a barcoded warehouse. Every log line becomes a small, labelled parcel — a JSON object with named, typed fields (service, status_code, latency_ms). Now the machinery can do the reading for you: scanners at the door count parcels automatically (CloudWatch metric filters → alarms), a librarian answers ad-hoc questions in seconds (CloudWatch Logs Insights), a conveyor belt carries copies to a searchable stockroom (Kinesis Data Firehose → OpenSearch), and anything mislabelled drops into a returns bin instead of being lost (S3 backup). The old copies age down to a cheap basement archive (S3 + Glacier).
That is the whole lesson in one sentence: emit JSON once, then let CloudWatch, Firehose, and OpenSearch each read the same well-labelled events for a different job — alerting, ad-hoc search, dashboards, and archive — instead of grepping a wall of text during an incident.
Level: Intermediate · Time: ~35 min
Prerequisites
- An AWS account and comfort creating IAM roles and reading a policy document — see IAM fundamentals.
- CloudWatch Logs basics (log groups, log streams, alarms) from the CloudWatch and CloudTrail observability deep dive.
- At least one compute service (Lambda, ECS, or EC2) you can make emit logs. You do not need OpenSearch running yet — we build the whole path here.
After this lesson you can
- Define and enforce a JSON logging contract (correlation IDs, stable types, bounded cardinality) that survives multiple teams.
- Query logs with Logs Insights and turn a raw field into a CloudWatch alarm with a metric filter — no extra infrastructure.
- Stream logs in real time to OpenSearch through a subscription filter and a Kinesis Data Firehose transform, with S3 as the safety net.
- Choose retention tiers, wire KMS end to end, and keep the delivery IAM roles least-privilege — see the KMS encryption deep dive and S3 storage deep dive.
- Diagnose the classic failure — a silent OpenSearch mapping conflict — from the S3 backup prefix.
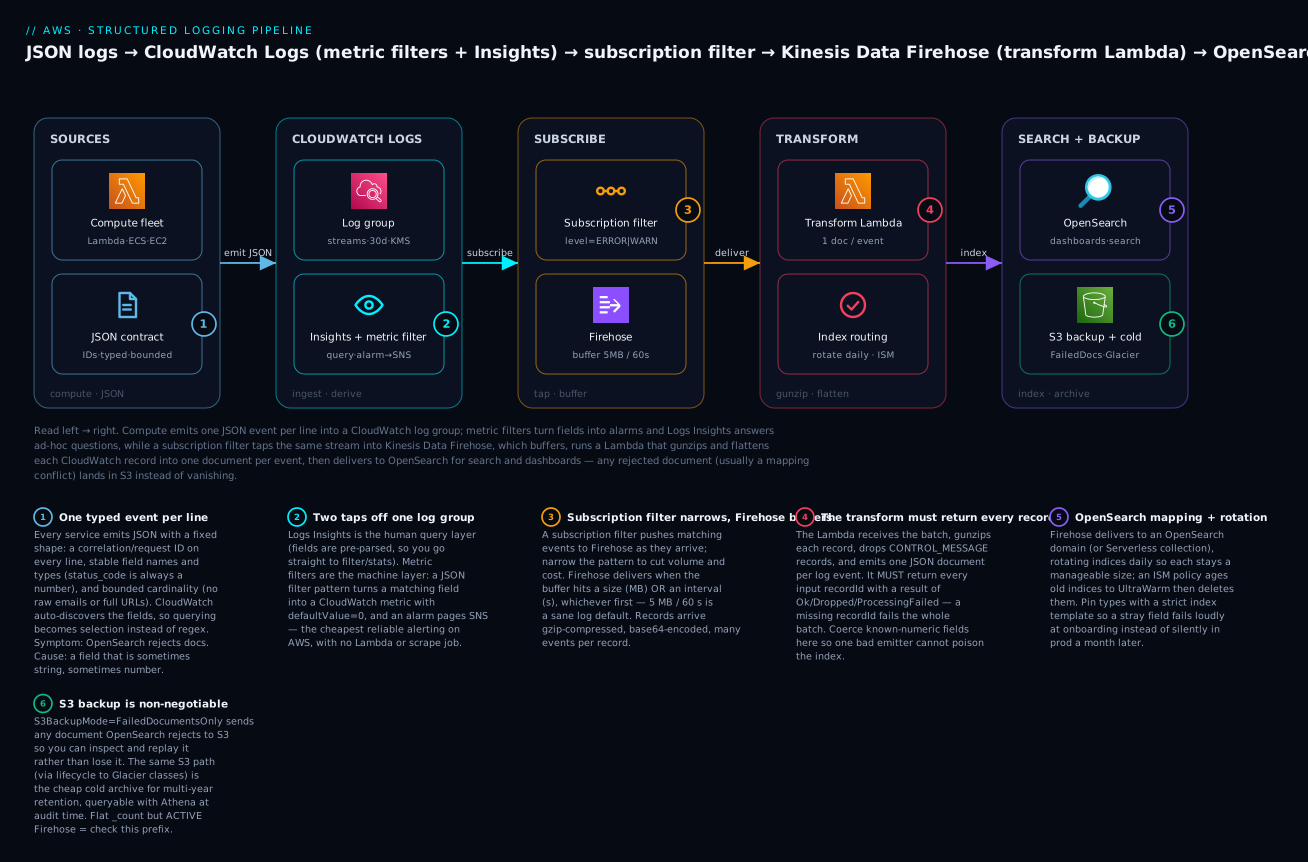
The diagram is the whole pipeline on one line: compute emits JSON into a CloudWatch log group, where metric filters raise alarms and Logs Insights answers questions; a subscription filter taps the same stream into Kinesis Data Firehose, which buffers and runs a Lambda transform that flattens each record into one document per event before delivering to OpenSearch — with any rejected document falling into S3 instead of vanishing.
Free-text logs are where observability goes to die. The moment you need to count errors by tenant, alarm on p99 latency, or correlate a request across three services, a wall of printf strings forces you into brittle regex and full-text scans. This article builds the alternative end to end on AWS: a logging contract that emits JSON, CloudWatch metric filters and Logs Insights for analysis, and a Kinesis Data Firehose path that streams those same logs into OpenSearch in real time — encrypted, least-privilege, and cost-aware.
1. Why structured JSON beats free-text
The core idea is that a log line is a structured event, not a sentence. Once every field is addressable, querying becomes selection instead of parsing, and CloudWatch can index discovered fields automatically.
Pick a logging contract and enforce it across every service. A minimal but production-grade shape:
{
  "timestamp": "2026-04-14T09:21:04.512Z",
  "level": "ERROR",
  "service": "checkout",
  "env": "prod",
  "trace_id": "1-66134a30-1f2c3d4e5f6a7b8c9d0e1f2a",
  "request_id": "8f3c1b2a-0d4e-4a6b-9c8d-7e6f5a4b3c2d",
  "tenant_id": "acme",
  "route": "POST /orders",
  "status_code": 502,
  "latency_ms": 1840,
  "message": "upstream payment gateway timed out"
}
Three rules make or break this contract:
- A correlation ID on every line. Use the X-Ray
trace_idif you run X-Ray, plus arequest_idyou generate at the edge and propagate. This is what turns a pile of lines into a request narrative. - Stable field names and types.
status_codeis always a number,levelis always one of a fixed set. OpenSearch infers types on first write; a field that is sometimes a string and sometimes a number will cause mapping conflicts and rejected documents downstream. - Bounded cardinality.
tenant_idis fine as a field; a raw user email or a full URL with query string is not — it explodes metric-filter dimensions and OpenSearch field data.
CloudWatch automatically discovers fields in JSON logs and exposes them to Logs Insights as
service,status_code, and so on. With free-text you wouldparsethem out by hand on every query. That single difference is why the contract pays for itself within a week.
The mental model: a log line is a row, not a sentence
If you have ever written SQL, the payoff is easy to see. A structured log line is a row in a table you never had to declare: each JSON key is a column, each event is a row, and the query engines (Logs Insights, OpenSearch) infer the columns for you. Free-text logging throws that table away and forces every reader to reconstruct the columns with a regular expression, on every query, forever.
| Question you ask during an incident | Free-text logs | Structured JSON |
|---|---|---|
| Count 5xx by route in the last hour | grep plus a manual tally, or a bespoke regex |
filter status_code>=500 | stats count() by route |
| p99 latency per route | impossible without first extracting the number | stats pct(latency_ms,99) by route |
| Every line for one request | grep <id> if you happened to log it |
filter request_id="…" — the ID is a first-class field |
| Alarm on error rate | scrape logs into a metric with a Lambda | a metric filter, zero extra infrastructure |
Why types are load-bearing. OpenSearch (and to a lesser extent metric filters) infer a field’s type from the first document that carries it. If status_code arrives as the number 502 first, the field is mapped long; a later document that sends the string "502" is a mapping conflict and gets rejected. This is the single most common way a logging pipeline breaks in production, and it is why “stable field names and types” is rule one, not a nicety. We meet this exact failure in the Enterprise scenario below.
Why cardinality is load-bearing. Every distinct value of a field you turn into a metric dimension is a separate CloudWatch custom metric with its own monthly cost, and every distinct field name in OpenSearch consumes mapping and field-data memory. tenant_id (hundreds of values) is fine; user_id (millions), a raw URL with a query string, or a full session token will blow up both your custom-metric bill and your OpenSearch cluster state. Keep high-cardinality identifiers as searchable fields in OpenSearch, never as metric dimensions.
There is a third way to get metrics out of logs that sidesteps the metric-filter cardinality limit entirely: the embedded metric format (EMF). You write a specially shaped JSON log and CloudWatch extracts the metrics asynchronously, so you can attach high-cardinality properties for later drill-down while only a few low-cardinality dimensions become billed metrics. We compare EMF with metric filters below.
2. Getting logs into CloudWatch
The destination is always a CloudWatch log group containing log streams. How you fill it depends on the compute.
Lambda. Anything you write to stdout/stderr lands in /aws/lambda/<function-name>. Just emit JSON — most runtimes’ structured loggers (Powertools for AWS Lambda, for example) already do. Set the format to JSON so platform fields are structured too:
aws lambda update-function-configuration \
  --function-name checkout \
  --logging-config LogFormat=JSON,ApplicationLogLevel=INFO,SystemLogLevel=WARN
EC2 / on-prem with the CloudWatch agent. The unified agent tails files and ships them. A minimal config:
{
  "logs": {
    "logs_collected": {
      "files": {
        "collect_list": [
          {
            "file_path": "/var/log/app/checkout.json",
            "log_group_name": "/app/checkout",
            "log_stream_name": "{instance_id}",
            "retention_in_days": 30
          }
        ]
      }
    }
  }
}
Start it with the config you just wrote:
sudo /opt/aws/amazon-cloudwatch-agent/bin/amazon-cloudwatch-agent-ctl \
  -a fetch-config -m ec2 \
  -c file:/opt/aws/amazon-cloudwatch-agent/etc/config.json -s
ECS on Fargate. The simple path is the awslogs driver, which sends each container’s stdout straight to a log group:
{
  "logConfiguration": {
    "logDriver": "awslogs",
    "options": {
      "awslogs-group": "/ecs/checkout",
      "awslogs-region": "us-east-1",
      "awslogs-stream-prefix": "checkout"
    }
  }
}
When you need routing or parsing at the source — sending some streams to CloudWatch and others to S3, or attaching metadata — switch the log driver to awsfirelens, which runs a Fluent Bit sidecar. FireLens is the right tool when one log driver’s worth of configuration is not enough; for a single JSON stream to CloudWatch, awslogs is less to operate.
Whichever path you choose, the output is identical: JSON events in a log group, ready for the rest of the pipeline.
Log groups, streams, and who writes what
Two nouns do all the work in CloudWatch Logs, and beginners conflate them:
- A log group is the logical bucket for one application or component —
/ecs/checkout. Retention, KMS encryption, metric filters, subscription filters, and field indexes are all set on the group. - A log stream is one source writing into that group — one Lambda execution environment, one EC2 instance, one container. You almost never configure streams directly; the producer names them (
{instance_id}, a container ID, a Lambda sandbox ID).
The rule of thumb: one log group per component, one stream per running instance of it. Sharding by stream is automatic; you reason about, and pay attention to, the group.
| Compute | How JSON gets in | What to set |
|---|---|---|
| Lambda | stdout/stderr → /aws/lambda/<fn>; enable JSON log format |
LogFormat=JSON, ApplicationLogLevel, optional custom LogGroup |
| ECS on Fargate | awslogs driver → one group per service |
group, region, stream-prefix |
| ECS with routing | awsfirelens (Fluent Bit sidecar) |
route/parse/enrich, then multiple destinations |
| EC2 / on-prem | unified CloudWatch agent tails files | collect_list, group, stream, retention |
| EKS | Fluent Bit / Fluentd DaemonSet (Container Insights) | node-level shipper, one group per namespace/app |
Lambda’s advanced logging controls are underused. Setting ApplicationLogLevel=INFO and SystemLogLevel=WARN lets the platform drop debug noise before it is ingested — you pay CloudWatch ingestion only for what clears the level filter, which is often the single biggest lever on a chatty function’s bill. LogFormat=JSON also structures the platform’s own START/END/REPORT lines so they stop polluting your field discovery.
FireLens vs
awslogs, decided in one line: if a single container’s stdout goes to exactly one CloudWatch group, useawslogs— it is one driver and nothing to operate. The moment you need to fan a stream out (some records to CloudWatch, some straight to S3 or a third party), parse or enrich at the source, or reduce volume before ingest, switch toawsfirelensand let Fluent Bit do it. Do not reach for FireLens just because it exists; it is a sidecar you now own.
3. Querying with CloudWatch Logs Insights
Logs Insights is the interactive query layer. Because the logs are JSON, fields are already parsed and you go straight to filter and stats. Error rate by route over the queried window:
fields @timestamp, route, status_code
| filter status_code >= 500
| stats count(*) as errors by route
| sort errors desc
Latency percentiles, which free-text logging cannot give you at all without first extracting the number:
fields latency_ms, route
| filter ispresent(latency_ms)
| stats
    pct(latency_ms, 50) as p50,
    pct(latency_ms, 90) as p90,
    pct(latency_ms, 99) as p99
  by route
Trace a single request across whatever streams it touched:
fields @timestamp, service, level, message
| filter request_id = "8f3c1b2a-0d4e-4a6b-9c8d-7e6f5a4b3c2d"
| sort @timestamp asc
Run a query from the CLI and poll for the result:
qid=$(aws logs start-query \
  --log-group-name /ecs/checkout \
  --start-time $(date -d '1 hour ago' +%s) \
  --end-time $(date +%s) \
  --query-string 'fields @timestamp, route, status_code | filter status_code >= 500 | stats count(*) by route' \
  --query 'queryId' --output text)

aws logs get-query-results --query-id "$qid"
Save the queries your team reruns (error rate, slow routes, a specific tenant’s traffic) so they are one click away during an incident instead of retyped from memory.
Cross-group searches matter at scale. You can pass multiple
--log-group-namevalues, or query a log group field index. For fleet-wide investigations, organize related groups so a single query spans the whole service.
Logs Insights vs OpenSearch Dashboards — when to use which
Both let you search the same events, and part of the confusion of this architecture is that you end up with two query surfaces. They are for different jobs:
| CloudWatch Logs Insights | OpenSearch Dashboards | |
|---|---|---|
| Best at | ad-hoc questions during an incident, on data already in CloudWatch | saved dashboards, long retention, full-text relevance, team-wide visualisations |
| Setup | zero — it is just there | a domain/collection, index templates, Firehose delivery |
| Query model | purpose-built pipe language (also PPL and SQL now) | Dashboards Query Language / Lucene / PPL |
| Cost model | per GB scanned per query | a cluster you run 24/7 (instances + storage) |
| Retention sweet spot | hours to ~30 days (hot) | 30–90 days warm, longer via UltraWarm/cold |
The practical split most teams land on: Insights for “what is happening right now,” Dashboards for “what does normal look like over the last month.” You are not doing redundant work — the subscription filter deliberately sends only a subset (say ERROR/WARN) to OpenSearch, while CloudWatch keeps everything short-term.
Two newer CloudWatch features change the Insights cost/latency story and are worth knowing:
- Live Tail streams matching log events to your console or CLI in near-real time (
aws logs start-live-tail), so you no longer pollstart-queryin a loop while chasing a deploy. - Field indexes let you index specific high-value fields (
request_id,trace_id) on a log group so point look-ups skip a full scan — cheaper queries and the basis for cross-log-group transaction search.
Whatever surface you use, the Insights cost rule is the same and it is worth repeating: bound the time range, filter before you stats, and never fields @message across a week of a chatty group. A query bills for every byte in the time window it has to open, not for the rows it returns.
4. Metric filters: alarms straight from log fields
Logs Insights is for humans asking questions. For machines watching continuously, use metric filters, which turn matching log events into CloudWatch metrics with no extra infrastructure — no Lambda, no scrape job.
Create a metric that counts 5xx responses, reading the value directly from the JSON field:
aws logs put-metric-filter \
  --log-group-name /ecs/checkout \
  --filter-name checkout-5xx \
  --filter-pattern '{ $.status_code >= 500 }' \
  --metric-transformations \
      metricName=Checkout5xx,metricNamespace=App/Checkout,metricValue=1,defaultValue=0
That { ... } syntax is the JSON metric-filter dialect: $.status_code addresses the field by JSON path. Setting defaultValue=0 is what makes the metric continuous — without it, the metric is sparse and alarms misbehave on the missing-data path.
You can also emit a field’s value as the metric, not just a count. Publish latency so you can alarm on it and graph it cheaply:
aws logs put-metric-filter \
  --log-group-name /ecs/checkout \
  --filter-name checkout-latency \
  --filter-pattern '{ $.latency_ms = * }' \
  --metric-transformations \
      metricName=CheckoutLatencyMs,metricNamespace=App/Checkout,metricValue='$.latency_ms'
Now wire an alarm. Alarm when 5xx count crosses a threshold over five minutes:
aws cloudwatch put-metric-alarm \
  --alarm-name checkout-5xx-high \
  --namespace App/Checkout --metric-name Checkout5xx \
  --statistic Sum --period 300 --evaluation-periods 1 \
  --threshold 10 --comparison-operator GreaterThanThreshold \
  --treat-missing-data notBreaching \
  --alarm-actions arn:aws:sns:us-east-1:111122223333:oncall
This is the cheapest reliable alerting you can build on AWS: the log you already emit becomes a metric, and the metric becomes a page. Reserve metric filters for the handful of signals you alarm on — every distinct dimension combination is a separate custom metric with its own cost — and leave exploratory slicing to Logs Insights.
Metric filters vs EMF — two ways to turn logs into metrics
A metric filter is the right first tool, but it has a hard edge: each dimension combination is a separate custom metric with its own cost, so it only scales for a handful of low-cardinality signals. When you need per-tenant or per-route metrics at high cardinality, reach for the embedded metric format (EMF) instead.
| Metric filter | Embedded Metric Format (EMF) | |
|---|---|---|
| How it works | CloudWatch scans the group, a pattern matches, a metric is emitted | your app writes a specially shaped JSON log; CloudWatch extracts metrics from it asynchronously |
| Where the logic lives | in the log-group config (ops owns it) | in the application logger (dev owns it) |
| Cardinality | low — every dimension set is a billed metric | high-cardinality properties for drill-down, only chosen dimensions billed |
| Best for | a few alarm signals from logs you already ship | rich application metrics emitted deliberately, e.g. via Powertools |
The filter-pattern dialect matters. The { … } form is the JSON dialect: $.status_code >= 500 addresses a field by JSON path, and you combine terms with && / ||. There is also a space-delimited dialect for unstructured lines ([ip, user, ..., status>=500]) — you will only need it for logs you do not control. Two knobs decide whether the resulting metric behaves:
defaultValue=0makes the metric continuous — it reports0on no match instead of a gap. Without it the metric is sparse and your alarm’streat-missing-databecomes load-bearing in a way that surprises people at 3 a.m.metricValue='$.latency_ms'emits the field’s value (so you can alarm on latency), whereasmetricValue=1just counts matches.
Cost intuition: a metric filter itself is free; the custom metrics it creates are billed per metric per month (plus alarm and API costs). Ten alarm signals is fine. A metric filter that fans Checkout5xx out by tenant_id across 500 tenants is 500 metrics — that is an EMF job, or a Logs Insights query, not a metric filter.
5. Subscription filters and Kinesis Data Firehose
Metric filters give you numbers. To get the events themselves out of CloudWatch in real time — into OpenSearch for search and dashboards, or S3 for archive — use a subscription filter, which pushes matching log events to a destination as they arrive. The destination here is a Kinesis Data Firehose delivery stream.
First, an IAM role CloudWatch Logs can assume to write to Firehose. Trust policy:
{
  "Version": "2012-10-17",
  "Statement": [{
    "Effect": "Allow",
    "Principal": { "Service": "logs.amazonaws.com" },
    "Action": "sts:AssumeRole"
  }]
}
Create the subscription filter pointing at the delivery stream. An empty filter pattern forwards every event; narrow it to cut volume and cost:
aws logs put-subscription-filter \
  --log-group-name /ecs/checkout \
  --filter-name to-opensearch \
  --filter-pattern '{ $.level = "ERROR" || $.level = "WARN" }' \
  --destination-arn arn:aws:firehose:us-east-1:111122223333:deliverystream/checkout-logs \
  --role-arn arn:aws:iam::111122223333:role/CWLtoFirehoseRole
Records arriving at Firehose from a subscription filter are gzip-compressed and base64-encoded, and a single record can contain multiple log events. That is exactly why you need a transform before indexing — covered next. Also note a log group allows a limited number of subscription filters, so plan one Firehose fan-out rather than many overlapping subscriptions.
Choosing the destination, and the limits that bite
A subscription filter can push to four kinds of destination: Kinesis Data Streams, Kinesis Data Firehose, Lambda, or a cross-account destination. This pipeline uses Firehose because we want managed delivery to OpenSearch and S3 with buffering and a transform, and nothing to shard or scale. The trade-off between the two Kinesis services is worth internalising:
| Kinesis Data Streams (KDS) | Kinesis Data Firehose | |
|---|---|---|
| You manage | shards (or on-demand), consumers, checkpoints | nothing — fully managed delivery |
| Replay | yes, 24 h – 365 d retention | no — it is a delivery pipe, not a buffer you re-read |
| Fan-out | many independent consumers | one configured destination (+ S3 backup) |
| Use it when | you need multiple real-time consumers or replay | you just want logs to land in OpenSearch/S3/Splunk |
For a logging pipeline you almost always want Firehose. Reach for KDS only if several systems must independently consume the same log stream in real time, or you need to replay.
The limit that surprises people: a log group supports only a small, fixed number of subscription filters (two by default; you can request an increase). That is deliberate — it forces the fan-out to happen downstream of one Firehose, not by stacking many overlapping subscriptions on the group. Design for one subscription filter per group → one Firehose → many destinations, not five subscriptions each to a different place.
DirectPut vs stream-sourced. The delivery stream here is --delivery-stream-type DirectPut because CloudWatch Logs puts records straight into it. If instead you fronted it with a Data Stream, the type would be KinesisStreamAsSource. And remember the wire format the subscription filter produces: records are gzip-compressed, base64-encoded, and may pack several log events into one record — which is exactly why a transform Lambda is mandatory before indexing, not optional.
6. Transform and deliver to OpenSearch
Firehose can deliver to an Amazon OpenSearch Service domain directly, but raw CloudWatch records are not index-ready. Attach a Lambda transform that decompresses and flattens each record into one JSON document per log event.
The transform must return each record with a recordId, a result of Ok/Dropped/ProcessingFailed, and base64 data. A Python sketch:
import base64, gzip, json

def handler(event, _ctx):
    out = []
    for rec in event["records"]:
        payload = json.loads(gzip.decompress(base64.b64decode(rec["data"])))
        if payload.get("messageType") == "CONTROL_MESSAGE":
            out.append({"recordId": rec["recordId"], "result": "Dropped"})
            continue
        lines = []
        for ev in payload.get("logEvents", []):
            try:
                doc = json.loads(ev["message"])
            except json.JSONDecodeError:
                doc = {"message": ev["message"]}
            doc["@timestamp"] = ev["timestamp"]   # epoch ms from CloudWatch
            doc["log_group"] = payload["logGroup"]
            lines.append(json.dumps(doc))
        data = ("\n".join(lines) + "\n").encode()
        out.append({
            "recordId": rec["recordId"],
            "result": "Ok",
            "data": base64.b64encode(data).decode(),
        })
    return {"records": out}
Two correctness details that bite people: drop CONTROL_MESSAGE records (Firehose sends them to validate connectivity), and keep the output of every input record — a missing recordId fails the whole batch.
Now create the delivery stream wired to OpenSearch with the transform and buffering. The key knobs are buffering (deliver when the buffer hits a size in MB or an interval in seconds, whichever first) and an index rotation period so indices stay a manageable size:
aws firehose create-delivery-stream \
  --delivery-stream-name checkout-logs \
  --delivery-stream-type DirectPut \
  --amazon-open-search-service-destination-configuration '{
    "RoleARN": "arn:aws:iam::111122223333:role/FirehoseToOpenSearch",
    "DomainARN": "arn:aws:es:us-east-1:111122223333:domain/logs",
    "IndexName": "checkout-logs",
    "IndexRotationPeriod": "OneDay",
    "BufferingHints": { "SizeInMBs": 5, "IntervalInSeconds": 60 },
    "S3BackupMode": "FailedDocumentsOnly",
    "ProcessingConfiguration": {
      "Enabled": true,
      "Processors": [{
        "Type": "Lambda",
        "Parameters": [{
          "ParameterName": "LambdaArn",
          "ParameterValue": "arn:aws:lambda:us-east-1:111122223333:function:cwl-transform"
        }]
      }]
    },
    "S3Configuration": {
      "RoleARN": "arn:aws:iam::111122223333:role/FirehoseToOpenSearch",
      "BucketARN": "arn:aws:s3:::checkout-logs-backup"
    }
  }'
S3BackupMode set to FailedDocumentsOnly is non-negotiable for a log pipeline: any document OpenSearch rejects (almost always a mapping conflict) lands in S3 instead of vanishing, so you can inspect and replay it. Smaller buffers mean fresher data and more, smaller PUTs; larger buffers mean cheaper delivery and more latency. For a logging pipeline, 60s / 5 MB is a sane default — tune toward larger if cost dominates, smaller if you live in the dashboards during incidents.
OpenSearch: domains vs Serverless, and keeping indices healthy
Firehose can deliver to two flavours of the destination, and the choice changes your cost and operating model:
| OpenSearch Service domain | OpenSearch Serverless collection | |
|---|---|---|
| Capacity | you size data/master nodes, EBS, UltraWarm | auto-scaling OCUs, no nodes to size |
| Cost shape | instance-hours 24/7 (predictable floor cost) | pay for compute units used (spiky-friendly, minimum OCUs) |
| Tiering | hot → UltraWarm → cold, built in | managed; no manual tiering |
| Firehose config | AmazonopensearchserviceDestination… |
AmazonOpenSearchServerlessDestination… |
| Reach for it when | steady high volume, need UltraWarm/fine control | bursty or unpredictable log volume, less ops |
Index rotation and ISM are how you stop one index from eating the cluster. IndexRotationPeriod: OneDay makes Firehose write to checkout-logs-2026-04-14, -04-15, and so on. On the OpenSearch side an Index State Management (ISM) policy then ages those indices automatically: hot for a few days, roll to UltraWarm (S3-backed, cheaper, slower) for weeks, cold for months, then delete. Without rotation + ISM you get one ever-growing index, slow queries, and an eventual red cluster.
Pin the mapping; do not trust dynamic mapping. As the Enterprise scenario shows, dynamic mapping means the first document defines every field’s type and a later type mismatch is silently rejected into S3. An index template with dynamic: strict and explicit properties turns that into a loud failure at onboarding — in a test deploy, not a month later in prod.
Operational facts worth pre-loading:
- A production domain should live in a VPC with fine-grained access control (FGAC) on, and the Firehose role mapped to an OpenSearch role that can only write. A public domain with open access is how log data leaks.
- Firehose writes its own diagnostics to prefixes in the backup bucket for rejected documents and processing errors. That prefix is your black-box recorder; know where it is before an incident.
- Dynamic partitioning (partitioning S3 output by a field such as
tenant_id) requires a 64 MB minimum buffer and is worth it only for the S3 branch, where partitioned objects make Athena cheap. It does not affect the OpenSearch path.
7. Retention and cost
Logs are cheap to write and expensive to forget about. Three levers control the bill.
Log class. CloudWatch offers a Standard class and an Infrequent Access class. Infrequent Access costs less to ingest but supports a reduced feature set (notably it does not support metric filters or subscription filters). Keep alarm-driving and OpenSearch-bound groups on Standard; consider Infrequent Access for high-volume, rarely-queried debug logs you keep only for occasional Insights queries.
Retention. The default is never expire, which is a quiet, unbounded cost. Set it explicitly on every group:
aws logs put-retention-policy \
  --log-group-name /ecs/checkout \
  --retention-in-days 30
Archive tier. CloudWatch is not a cheap long-term store. Keep 14-30 days hot in CloudWatch and OpenSearch for incident response, and let the Firehose-to-S3 path (or a dedicated S3 destination) hold the cold copy. Apply S3 lifecycle rules to transition to Glacier-class storage for multi-year retention at a fraction of the cost, and query it with Athena when audit time comes.
A note on Insights cost: Logs Insights bills by data scanned per query. Always bound the time range, filter early before you stats, and prefer saved narrow queries over fields @message across a week of a chatty service.
| Tier | Lives in | Typical window | Use |
|---|---|---|---|
| Hot | CloudWatch + OpenSearch | 14-30 days | Alarms, dashboards, incident response |
| Warm | OpenSearch UltraWarm (optional) | 30-90 days | Slower interactive search |
| Cold | S3 (+ Glacier classes) | months to years | Compliance, audit, replay |
A worked cost example (representative us-east-1 list prices)
Numbers make the levers concrete. Take a service emitting 100 GB of logs per day. Prices below are representative on-demand list prices and vary by region and over time — always check the current pricing page — but the ratios are what teach the lesson.
- CloudWatch ingestion (Standard): ~$0.50/GB → 100 GB/day ≈ $1,500/month just to ingest. This is usually the largest single line.
- Same volume on Infrequent Access: ~$0.25/GB → ≈ $750/month — but you lose metric filters and subscription filters, so it only fits logs you only query occasionally.
- CloudWatch storage: ~$0.03/GB-month (compressed). Thirty-day retention of the compressed volume is tens of dollars — an order of magnitude below ingestion. Retention is a small lever; ingestion is the big one.
- Logs Insights: ~$0.005/GB scanned → one careless
fields @messageover a week of this group scans ~700 GB ≈ $3.50 per run. Ten engineers doing that during an incident is a real number. - Firehose: billed per GB ingested (with small extras for format conversion / VPC delivery). Narrowing the subscription filter to
ERROR/WARNbefore Firehose is what keeps this — and the OpenSearch bill — down. - OpenSearch: you pay for the cluster 24/7 (instances + EBS + optional UltraWarm), independent of query volume. Right-sizing nodes and using UltraWarm for anything older than a week is the main lever.
| Lever | Cuts | How |
|---|---|---|
| Drop log level before ingest | ingestion (the big one) | Lambda ApplicationLogLevel, app-side filtering |
| Narrow the subscription filter | Firehose + OpenSearch | forward only ERROR/WARN, not everything |
| Infrequent Access class | ingestion | high-volume, rarely-queried debug groups |
| Retention + ISM | storage | expire hot data; UltraWarm/cold the rest |
| S3 + Glacier for cold | long-term storage | lifecycle transition; query with Athena on demand |
| Bounded Insights queries | per-query scan | time-box, filter early, saved narrow queries |
The headline: you control cost mostly at ingestion and at the subscription filter, not at storage. A team that obsesses over retention days while forwarding every DEBUG line to OpenSearch is optimising the wrong end.
8. Locking it down
Logs contain your most sensitive runtime data. Three controls are mandatory.
KMS encryption at rest. Encrypt the log group with a customer-managed key. The key policy must allow the CloudWatch Logs service principal to use it:
aws logs associate-kms-key \
  --log-group-name /ecs/checkout \
  --kms-key-id arn:aws:kms:us-east-1:111122223333:key/abcd-1234
Encrypt the OpenSearch domain, the S3 backup bucket, and the Firehose stream with KMS as well so the data is covered along the entire path.
Least-privilege IAM. The Firehose delivery role should grant only what delivery needs — es:ESHttpPost/es:ESHttpPut scoped to the one domain, s3:PutObject scoped to the backup bucket, lambda:InvokeFunction scoped to the transform, and the kms actions for the specific keys. No wildcards on resources. The CloudWatch-to-Firehose role should allow only firehose:PutRecord/firehose:PutRecordBatch on the single delivery stream.
Redact before it leaves the app. The cheapest place to handle PII is the logger. Never log raw tokens, full PANs, or passwords. For defense in depth, CloudWatch Logs data protection policies can detect and mask sensitive data identifiers (emails, credentials, and similar) at ingest, and the Firehose transform Lambda is a second chokepoint where you can drop or hash a field before it reaches OpenSearch. Layer all three rather than trusting any one.
Cross-account aggregation and the security details that matter
At org scale you do not want every account running its own OpenSearch. The pattern is a central logging account that owns the Firehose, OpenSearch, and S3, with member accounts shipping to it.
- Cross-account subscriptions. You create a destination resource (backed by a Firehose or Data Stream) in the logging account, attach a destination access policy naming the sending accounts (or the whole Organization via
aws:PrincipalOrgID), and member accounts point their subscription filters at that destination ARN. Logs converge into one searchable place, and member teams never touch the OpenSearch cluster. - Cross-account, cross-region observability is the query-side complement: it lets an operator in the monitoring account query CloudWatch Logs and metrics across linked source accounts from one pane, without copying data.
The KMS key policy is where people get stuck. Associating a customer-managed key is one CLI call, but the key policy must let the CloudWatch Logs service principal use the key, scoped to your log-group ARNs:
{
  "Effect": "Allow",
  "Principal": { "Service": "logs.us-east-1.amazonaws.com" },
  "Action": [
    "kms:Encrypt*", "kms:Decrypt*", "kms:ReEncrypt*",
    "kms:GenerateDataKey*", "kms:Describe*"
  ],
  "Resource": "*",
  "Condition": {
    "ArnLike": {
      "kms:EncryptionContext:aws:logs:arn":
        "arn:aws:logs:us-east-1:111122223333:log-group:/ecs/checkout"
    }
  }
}
Encrypt every hop with its own scoped key policy: the log group, the Firehose stream, the OpenSearch domain, and the S3 backup bucket. A gap anywhere means plaintext at rest on that hop.
Fine-grained access control (FGAC) on OpenSearch is the other must-have: run the domain in a VPC, enable FGAC, and map the Firehose delivery role to an OpenSearch role whose permissions are write to the index pattern and nothing else. Human analysts get a separate read role. Combined with the data protection policy at ingest (managed identifiers for emails, credentials, and the like, masked before anyone reads them) and redaction in the logger itself, you have the three layers the section above demands — app, log group, and transform — each catching what the others miss.
Enterprise scenario
A fintech platform team ran this exact pipeline across ~140 ECS services. Three weeks after launch, OpenSearch ingestion fell off a cliff for one domain while Firehose still reported ACTIVE. The FailedDocumentsOnly prefix in S3 was filling up: a newly onboarded service emitted status_code as the string "502" instead of a number, and OpenSearch had already inferred long for that field from the first write. Every document from that service after the rotation was a mapping conflict and got dropped. The contract said “numbers stay numbers” — but nothing enforced it, so a single team’s logger shipped strings.
The fix had two parts. Short term, they made the Firehose transform Lambda coerce the known-numeric fields instead of trusting upstream, so one bad emitter could not poison the index:
for k in ("status_code", "latency_ms"):
    v = doc.get(k)
    if isinstance(v, str) and v.lstrip("-").isdigit():
        doc[k] = int(v)
Long term, they stopped relying on dynamic mapping. They created an index template that pins types and rejects surprises, applied before any data lands:
curl -XPUT "https://<domain>/_index_template/checkout-logs" -H 'Content-Type: application/json' -d '{
  "index_patterns": ["checkout-logs-*"],
  "template": { "mappings": {
    "dynamic": "strict",
    "properties": {
      "status_code": { "type": "integer" },
      "latency_ms":  { "type": "integer" },
      "@timestamp":  { "type": "date" }
    }
  }}
}'
With dynamic: strict, a stray new field now fails loudly into S3 backup at onboarding time — in a test deploy, not silently in prod a month later.
Verify
Confirm each stage end to end:
# Logs are arriving and are valid JSON
aws logs tail /ecs/checkout --since 5m --format short

# Metric filter is producing data points
aws cloudwatch get-metric-statistics \
  --namespace App/Checkout --metric-name Checkout5xx \
  --start-time $(date -d '15 min ago' -u +%FT%TZ) \
  --end-time $(date -u +%FT%TZ) \
  --period 60 --statistics Sum

# Firehose is delivering, not erroring
aws firehose describe-delivery-stream \
  --delivery-stream-name checkout-logs \
  --query 'DeliveryStreamDescription.DeliveryStreamStatus'

# Documents are landing in OpenSearch
curl -s "https://<domain-endpoint>/checkout-logs-*/_count" | jq .
If _count is flat but Firehose is ACTIVE, check the S3 FailedDocumentsOnly prefix — mapping conflicts are the usual culprit, and the rejected document there tells you exactly which field changed type.
Checklist
Pitfalls
- Mapping conflicts silently drop documents. A field that is a number in one service and a string in another will be rejected by OpenSearch. Enforce types in the contract, and always enable
FailedDocumentsOnlyso rejects are recoverable instead of lost. - Sparse metrics break alarms. Without
defaultValue=0, a metric filter only emits on matches, andtreat-missing-databecomes load-bearing. Set both deliberately. - Forgetting control messages. A transform that does not drop
CONTROL_MESSAGErecords, or omits arecordId, fails entire Firehose batches — and the failure is not obvious from the OpenSearch side. - Never-expire retention. The default is unbounded storage cost. Set retention on every group at creation, ideally in your IaC so it cannot be missed.
- Wildcard IAM on the delivery role. It is tempting under deadline; scope every action to the specific domain, bucket, key, and function instead.
Going deeper
The core pipeline works; production is where the edges live. This section is the material an experienced engineer wants before running this at scale.
What actually happens between subscription filter and OpenSearch
Trace one error line end to end, because every failure mode hides in a seam:
- Your app writes one JSON line to stdout. The compute platform (Lambda/ECS/agent) delivers it to a log stream in the group. Ingestion latency is typically sub-second but is not ordered across streams.
- The subscription filter evaluates its pattern against each event and, on a match, hands the event to CloudWatch Logs’ delivery machinery, which assumes the
CWLtoFirehoseRoleand callsfirehose:PutRecord. Events are batched and gzip-compressed; one Firehose record can carry many events, wrapped in a CloudWatch envelope (logGroup,logStream,messageType,logEvents[]). - Firehose buffers by size or interval, whichever trips first, then invokes the transform Lambda with a batch. The Lambda has a hard 6 MB invocation-payload ceiling; keep it fast and idempotent, because Firehose retries a failing transform for a bounded window before parking the records in the
processing-failed/S3 prefix. - Transformed records are buffered again and bulk-indexed into OpenSearch. A document whose type conflicts with the mapping is rejected by OpenSearch, and Firehose routes it to the failed-documents S3 prefix — Firehose still reports
ACTIVE, which is why “green Firehose, flat_count” is the signature of a mapping problem.
The lesson of the seams: nothing is lost, but rejects go sideways into S3, not backwards into an error you would notice. Your monitoring must watch the failed prefixes, not just the Firehose status.
Ordering, duplicates, and idempotency
- No global ordering. Events are ordered within a stream, not across streams or after Firehose batching. Never rely on OpenSearch document order; sort by
@timestampat query time, and make@timestampthe event time from CloudWatch (epoch ms), not the index time. - At-least-once delivery. Firehose and subscription delivery are at-least-once; a retried batch can double-index. If duplicates matter, set the OpenSearch document ID deterministically in the transform (for example a hash of
log_group+logStream+ the event timestamp + a sequence) so a re-delivered event overwrites rather than duplicates.
Scale and quota edges
- Subscription filters per group: two by default (increase on request) — design one Firehose fan-out, not many subscriptions.
- Firehose throughput: DirectPut streams have per-stream record and byte quotas; a very high-volume group may need a quota increase or a Data Stream in front.
- Transform Lambda concurrency: Firehose invokes it in parallel as the buffer flushes; the function competes for account concurrency. Give it reserved concurrency so a log spike cannot starve your real functions.
- OpenSearch shard hygiene: aim for shards in the tens-of-GB range and keep total shard count per node bounded. Daily rotation on a low-volume index creates thousands of tiny shards — use a longer rotation, or ISM rollover by size rather than by day.
Failure modes to pre-wire alarms for
| Symptom | Likely cause | Where to look / fix |
|---|---|---|
Firehose ACTIVE, OpenSearch _count flat |
mapping conflict | failed-documents S3 prefix; pin types with a strict template |
DeliveryToOpenSearch errors climbing |
domain throttling / red cluster / auth | Firehose CloudWatch metrics; OpenSearch cluster health, FGAC role mapping |
| Whole batches missing | transform dropped records or omitted recordId |
processing-failed/ prefix; return all records |
| Ingestion cost spike | a new DEBUG-chatty deploy | log level at source; narrow the subscription filter |
| Alarm flaps on no data | sparse metric filter | defaultValue=0 plus a deliberate treat-missing-data |
Version and API caveats
- Kinesis Data Firehose was renamed Amazon Data Firehose (2024). The service, ARNs (
firehose:), and theaws firehose …CLI are unchanged; only the console name differs. This lesson keeps “Kinesis Data Firehose” because that is still the term most infra and IAM docs use. - OpenSearch Serverless is GA but its Firehose integration and access model differ from a managed domain (collections, OCUs,
AmazonOpenSearchServerlessDestinationConfiguration). Do not assume domain snippets apply unchanged. - Logs Insights now also accepts OpenSearch PPL and SQL dialects alongside its native pipe syntax — handy if your team already knows PPL from Dashboards.
- Amazon ES → Amazon OpenSearch Service. Older ARNs and the CLI still use
es(arn:aws:es:…,es:ESHttpPost); that is expected, not a typo.
Practice challenges
Do these in a throwaway account or region. Placeholders (111122223333, ARNs, <domain>) are illustrative — substitute your own. They escalate beginner → advanced.
1. Emit and verify a JSON contract (beginner). Make a Lambda emit the lesson’s JSON shape and confirm CloudWatch discovered the fields.
<details><summary>Solution</summary>
Set the function to JSON logs, then tail:
aws lambda update-function-configuration \
  --function-name checkout \
  --logging-config LogFormat=JSON,ApplicationLogLevel=INFO,SystemLogLevel=WARN

aws logs tail /aws/lambda/checkout --since 5m --format short
In Logs Insights, fields service, status_code | filter ispresent(status_code) returns rows with the fields already parsed — no parse needed. Why: if ispresent(status_code) is empty, your logger is emitting a string blob, not JSON, and nothing downstream can type the field.
</details>
2. Alarm on 5xx with a metric filter (beginner). Turn status_code >= 500 into a paging alarm.
<details><summary>Solution</summary>
aws logs put-metric-filter \
  --log-group-name /ecs/checkout --filter-name checkout-5xx \
  --filter-pattern '{ $.status_code >= 500 }' \
  --metric-transformations metricName=Checkout5xx,metricNamespace=App/Checkout,metricValue=1,defaultValue=0

aws cloudwatch put-metric-alarm \
  --alarm-name checkout-5xx-high --namespace App/Checkout --metric-name Checkout5xx \
  --statistic Sum --period 300 --evaluation-periods 1 --threshold 10 \
  --comparison-operator GreaterThanThreshold --treat-missing-data notBreaching \
  --alarm-actions arn:aws:sns:us-east-1:111122223333:oncall
Why: defaultValue=0 makes the metric continuous so the alarm evaluates every period instead of sitting in INSUFFICIENT_DATA between errors.
</details>
3. p99 latency by route in Logs Insights (intermediate). Write the query and make it cheap.
<details><summary>Solution</summary>
fields latency_ms, route
| filter ispresent(latency_ms)
| stats pct(latency_ms,50) as p50, pct(latency_ms,90) as p90, pct(latency_ms,99) as p99 by route
| sort p99 desc
Run it over a 15-minute window, not a week. Why: Insights bills per GB scanned in the time range; filter before stats and a tight window are the difference between cents and dollars per run.
</details>
4. Narrow the subscription filter and reason about volume (intermediate). Forward only ERROR/WARN to Firehose and explain the cost effect.
<details><summary>Solution</summary>
aws logs put-subscription-filter \
  --log-group-name /ecs/checkout --filter-name to-opensearch \
  --filter-pattern '{ $.level = "ERROR" || $.level = "WARN" }' \
  --destination-arn arn:aws:firehose:us-east-1:111122223333:deliverystream/checkout-logs \
  --role-arn arn:aws:iam::111122223333:role/CWLtoFirehoseRole
Why: the pattern runs before Firehose, so INFO/DEBUG never leave CloudWatch — cutting Firehose ingest, OpenSearch storage, and the OpenSearch bill in one line, while everything stays queryable short-term in CloudWatch. </details>
5. Make the transform poison-proof (advanced). Harden the transform Lambda so one emitter sending status_code as a string cannot break the index.
<details><summary>Solution</summary>
Coerce known-numeric fields and always return every record:
NUMERIC = ("status_code", "latency_ms")

def coerce(doc):
    for k in NUMERIC:
        v = doc.get(k)
        if isinstance(v, str) and v.lstrip("-").isdigit():
            doc[k] = int(v)
    return doc
Apply coerce(doc) before json.dumps, keep the CONTROL_MESSAGE drop, and return the same recordId for every input. Why: OpenSearch types a field from the first write; coercing at the transform means one team’s bad logger fails its line, not the whole index — and no recordId is dropped, so batches never fail wholesale.
</details>
6. Prevent silent drops with a strict template plus monitoring (advanced). Stop relying on dynamic mapping and detect rejects.
<details><summary>Solution</summary>
Pin types and reject surprises before data lands:
curl -XPUT "https://<domain>/_index_template/checkout-logs" -H 'Content-Type: application/json' -d '{
  "index_patterns": ["checkout-logs-*"],
  "template": { "mappings": { "dynamic": "strict",
    "properties": {
      "status_code": { "type": "integer" },
      "latency_ms":  { "type": "integer" },
      "@timestamp":  { "type": "date" } } } }
}'
Then alarm on the Firehose DeliveryToOpenSearch.Success metric dropping below 1, and watch the failed-documents S3 prefix for objects. Why: dynamic: strict turns a new or mistyped field into a loud failure at onboarding, and the Firehose metric plus the S3 prefix are how you notice rejects while Firehose still shows ACTIVE.
</details>
Common beginner mistakes
These are misconceptions, not just symptoms — the wrong mental model that leads to the trap, and the right one.
- “OpenSearch will figure out the types.” It will — once, from the first document — and then punish every document that disagrees. Dynamic mapping is not schema-on-read; it is schema-on-first-write. Right model: pin types with an index template and treat a new field as a code change, not a runtime surprise.
- “A metric filter is basically a search.” No — Logs Insights is search (ad-hoc, per query, over everything). A metric filter is a standing counter that materialises a metric continuously. Use metric filters for the few things you alarm on, Insights for the many things you ask.
- “Send everything to OpenSearch so it’s all searchable.” That doubles your bill (CloudWatch and OpenSearch ingest) and buries signal in DEBUG noise. Right model: CloudWatch holds everything short-term; the subscription filter forwards only the subset worth long-term search and dashboards.
- “The transform can just return the records it cares about.” Firehose expects every input
recordIdback with a result; return a subset and the whole batch fails, invisibly from OpenSearch’s side. Right model: the transform is one-in-one-out (Ok/Dropped/ProcessingFailed), never fewer. - “Firehose says
ACTIVE, so delivery is fine.”ACTIVEmeans the stream is healthy, not that documents are landing. Rejects go to S3. Right model: monitor theDeliveryToOpenSearchsuccess metric and the failed-documents prefix, not the stream status. - “I’ll set retention later.” The default is never expire, a quiet unbounded bill. Right model: set retention at group creation, in IaC, so it cannot be forgotten.
- “Redaction is the transform’s job.” By the time PII reaches the transform it has already been ingested into CloudWatch. Right model: redact in the logger first; the data protection policy and transform are backstops, layered, not the primary control.
- “Higher-cardinality fields make richer metrics.” Every dimension value is a separate billed custom metric;
user_idas a dimension is a five-figure surprise. Right model: high cardinality stays a searchable field (OpenSearch) or an EMF property, never a metric dimension.
Glossary
- Structured logging — emitting each log line as a machine-readable object (JSON here) with named, typed fields instead of a free-text sentence.
- Logging contract — the agreed shape every service’s logs must follow: which fields exist, their types, and cardinality rules. Enforced, not merely documented.
- Log group — the CloudWatch container for one component’s logs; retention, encryption, metric filters, and subscription filters are configured here.
- Log stream — one source (an instance, container, or Lambda sandbox) writing into a log group.
- Retention policy — how long CloudWatch keeps a group’s events before deleting them; the default is never expire.
- CloudWatch Logs Insights — the interactive query engine over CloudWatch Logs, billed per GB scanned per query.
- Metric filter — a rule on a log group that turns matching events into a CloudWatch metric, enabling alarms with no extra infrastructure.
- Embedded Metric Format (EMF) — a JSON log shape CloudWatch parses to extract metrics asynchronously, supporting high-cardinality properties without per-dimension metric-filter cost.
- Alarm — a CloudWatch rule that changes state (and can notify SNS) when a metric crosses a threshold over a window.
- Subscription filter — a real-time tap on a log group that pushes matching events to Kinesis Data Streams, Firehose, Lambda, or a cross-account destination.
- Kinesis Data Firehose (Amazon Data Firehose) — fully managed delivery that buffers records, optionally runs a transform Lambda, and delivers to OpenSearch, S3, and other destinations.
- Transform Lambda — the function Firehose invokes to reshape each record; here it gunzips the CloudWatch envelope and emits one JSON document per log event, returning every
recordId. - Buffering hints — Firehose’s “deliver when the buffer reaches N MB or N seconds, whichever first” knobs that trade freshness against cost.
- DirectPut — a Firehose delivery-stream type whose records are put directly by a producer (here, CloudWatch Logs), as opposed to being sourced from a Data Stream.
- OpenSearch Service domain — a managed OpenSearch cluster you size (data/master nodes, EBS, UltraWarm/cold); the classic destination for this pipeline.
- OpenSearch Serverless — the auto-scaling, node-less flavour billed in OpenSearch Compute Units (OCUs), suited to bursty log volume.
- Index rotation — writing to a new time-based index (for example daily) so no single index grows unbounded.
- Index State Management (ISM) — OpenSearch policies that automatically age indices through hot → UltraWarm → cold → delete.
- Mapping conflict — a document whose field type disagrees with the index mapping; OpenSearch rejects it, and Firehose routes it to the S3 failed-documents prefix.
FailedDocumentsOnly— the Firehose S3 backup mode that saves only documents OpenSearch rejected, so they can be inspected and replayed.- Fine-grained access control (FGAC) — OpenSearch’s per-index/role authorisation, layered with VPC access, so the Firehose role can only write.
- Data protection policy — a CloudWatch Logs feature that detects and masks sensitive data (emails, credentials, and similar) at ingest.
- Correlation ID — an identifier (
request_id, X-Raytrace_id) carried on every log line so a request can be reassembled across services. - Cardinality — the number of distinct values a field can take; high cardinality is fine for searchable fields, expensive for metric dimensions.
- UltraWarm — an OpenSearch storage tier that keeps older indices searchable on cheaper, S3-backed nodes at higher latency.