In a nutshell
Think of Azure the way you think of household electricity and water. You do not buy a power station; you pay a monthly bill for exactly what you consume, the utility promises a certain reliability, and if the supply is out for too long you can claim a rebate. Azure cloud economics is the study of that bill and that promise — what turns the meter, how to make it cheaper without breaking anything, and what Microsoft actually guarantees in exchange for your money.
This lesson has two halves that mirror each other. The spend half asks how much, and why: the three pricing models (pay-as-you-go, reserved, spot), the five things that drive a bill, the two calculators, and the Cost Management tools that watch the meter. The assurance half asks what do I get for the money: the SLA (the uptime promise), how chaining services multiplies risk, how zones and regions buy extra “nines,” which features are production-ready (GA versus preview), and which support plan actually answers the phone at 2 a.m.
If you remember one sentence, make it this: in the cloud, the ability to hand capacity back is worth as much as the ability to add it — because every resource you switch off stops costing money the very same minute. Everything else in this lesson is detail on how to exploit that fact, and how to read the guarantees that come attached to it.
Level: Beginner → Intermediate · Time: ~30 min · Prerequisites: basic IT literacy (you know roughly what a VM, a database, and storage are); ideally the “What is Azure?” and global-infrastructure lessons first. After this you can: predict and defend a monthly bill, pick the right pricing model for a workload’s shape, compute a composite SLA by hand, tell preview from GA, and choose the correct support plan.
The cloud’s most famous promise is “pay only for what you use” — but that single sentence hides almost everything that matters about running on Azure. What exactly are you paying for? When does the meter start? Why did egress cost more than the virtual machine? What does Microsoft actually guarantee in exchange for the money, and what happens when a service falls short? And when something breaks at 2 a.m., who picks up the phone? This lesson answers all of it.
Cloud economics is the pillar that turns a hobbyist into an architect. Anyone can click “Create”; the person who can predict the bill, defend the design on cost, read an SLA correctly, and know which support plan a workload needs is the person organisations actually trust with production. It is also a heavily weighted theme on the AZ-900: Azure Fundamentals exam — the “describe cost management” and “describe SLAs and service lifecycle” domains together account for a meaningful slice of the questions. We go from zero, define every term, and stay grounded in real decisions and real numbers (illustrative INR figures included, because that is the currency you will be budgeting in).
Learning objectives
By the end of this lesson you can:
- Explain the shift from CapEx to OpEx and why the cloud’s cost model changes how organisations budget.
- Compare Azure’s three core pricing models — pay-as-you-go (consumption), reserved, and spot — and say when each one wins.
- Name the five biggest cost drivers (compute, storage, data transfer/egress, region, and tier) and reason about a bill.
- Use the Pricing Calculator and the Total Cost of Ownership (TCO) Calculator for the jobs each is designed for.
- Govern spend with Microsoft Cost Management: cost analysis, budgets, Azure Advisor cost recommendations, and tags.
- Read a service-level agreement (SLA) correctly, calculate a composite SLA for chained services, and explain how availability zones and region pairs raise it.
- Distinguish the stages of the service lifecycle — private preview, public preview, and general availability (GA) — and state precisely what “preview means no SLA” implies.
- Choose between the four Azure support plans (Basic, Developer, Standard, Professional Direct) and use Azure Service Health.
Prerequisites & where this fits
You need only basic IT literacy and a rough idea of what a virtual machine, a database, and storage are — no prior cloud billing experience is assumed, and every financial term is defined the first time it appears. A free Azure account is enough to follow the hands-on lab (the lab itself costs nothing). This is a Foundations lesson in the Azure Zero-to-Hero course and the economics counterpart to the “What is Azure?” lesson: where that one taught you how Azure is organised, this one teaches you how Azure charges you and what it guarantees. It builds the financial vocabulary that every later design lesson quietly assumes.
CapEx vs OpEx: the mental shift
Before a single price, understand the kind of spending the cloud represents, because it reshapes how a whole organisation budgets.
- Capital expenditure (CapEx) is money spent up front to buy assets you own and use for years — servers, storage arrays, the data-centre building, networking hardware. You pay a large lump sum, the asset depreciates on the books over its useful life, and you carry the cost of capacity whether or not you use it. Buying twelve servers because you might need them at Diwali means eleven of them sit idle for most of the year — money already spent, sunk.
- Operational expenditure (OpEx) is money spent on ongoing consumption — you rent capacity and pay as you go, like an electricity bill. There is no asset to own or depreciate; the expense hits the period in which you used the service.
Azure converts most IT spending from CapEx into OpEx. The practical consequences are the heart of the cloud business case:
| Dimension | Traditional data centre (CapEx) | Azure (OpEx) |
|---|---|---|
| Up-front cost | Large; buy hardware before first use | Near zero; provision on demand |
| Capacity planning | Guess peak years ahead; over-provision to be safe | Scale up and down as demand moves |
| Time to provision | Weeks to months (purchase, ship, rack, cable) | Minutes |
| Idle capacity | You paid for it; it is sunk | Deallocate it and stop paying |
| Risk of getting it wrong | High — wrong hardware is a multi-year mistake | Low — change the SKU tomorrow |
| Who carries the depreciation | You | Microsoft |
The instinct to build early: in the cloud, elasticity has financial value. The ability to give capacity back is worth as much as the ability to add it, because every idle resource is now a line item you could simply switch off.
The three pricing models
Almost every Azure charge resolves to one of three pricing models. Knowing which one fits a workload is one of the most valuable cost skills there is.
| Model | How you pay | Commitment | Typical saving vs PAYG | Best for | The catch |
|---|---|---|---|---|---|
| Pay-as-you-go (consumption) | Per second/hour/operation/GB actually used | None | Baseline (0%) | Spiky, unpredictable, short-lived, or new workloads | Most expensive per unit; no discount |
| Reserved (Reservations / Savings Plans) | Commit to 1 or 3 years of usage, paid up front or monthly | 1 or 3 years | Up to ~72% (varies by service/term) | Steady, predictable baseline running 24×7 | You pay even if you stop using it |
| Spot | Bid for Azure’s spare capacity at a deep discount | None, but can be evicted | Up to ~90% | Interruptible, stateless, batch, dev/test, fault-tolerant work | Azure can reclaim the capacity with ~30 s notice |
How to think about each:
- Pay-as-you-go (PAYG), also called consumption-based pricing, is the default: the meter runs only while the resource is in use, billed at fine granularity (per second for VMs, per million executions for Functions, per GB-month for storage). Maximum flexibility, highest unit price. Perfect when you cannot predict demand or the workload is temporary.
- Reserved capacity rewards predictability. Reservations commit you to a specific resource type (for example, a VM size in a region) for one or three years; Azure Savings Plans for compute commit you to a fixed hourly spend across many compute services instead of a specific SKU, trading a little of the discount for far more flexibility. Either way, you are pre-paying for a baseline you know you will run, so Microsoft gives a steep discount. The risk is symmetrical to its reward: an unused reservation is a negative discount — you paid up front and got nothing.
- Spot sells Azure’s unused capacity at a deep discount on the condition that Microsoft can evict your workload (reclaim the machine) when paying customers need the capacity, giving only about 30 seconds’ notice. Brilliant for batch jobs, CI/CD agents, rendering, and big-data processing that can checkpoint and resume; unsuitable for anything that must stay up, such as a production database.
A separate, stackable discount worth naming here is the Azure Hybrid Benefit: if you already own eligible Windows Server or SQL Server licences with Software Assurance, you can apply them to Azure VMs and pay only for the compute, saving a large fraction of the licensing cost. It layers on top of reservations.
What actually drives the bill
When a bill surprises someone, the cause is almost always one of five drivers. Internalise these and you can estimate costs in your head and read an invoice with confidence.
| Driver | What it means | Why it bites |
|---|---|---|
| Compute | vCPU + RAM hours for VMs, App Service plans, AKS nodes, Functions executions | Usually the largest line item; the wrong SKU or a VM left running overnight dominates the bill |
| Storage | GB stored per month × the tier, plus transaction/operation counts | Cheap per GB but accumulates forever; hot vs cool vs archive tiers differ by an order of magnitude |
| Data transfer (egress) | Data leaving Azure to the internet or across regions | Inbound is free; outbound is metered. Cross-region replication and chatty internet APIs quietly add up |
| Region | The same service costs different amounts in different regions | A premium region can cost noticeably more than a cheaper one for identical specs |
| Tier / SKU | The service level you choose (Basic vs Standard vs Premium) | Higher tiers add features and price; over-provisioning the tier is a classic waste |
Two of these trip up beginners hardest:
- Egress is the silent driver. Sending data into Azure is free; sending data out — to users on the internet, or between Azure regions — is charged per GB. A multi-region design that copies data between regions, or an API that streams large responses to the internet, can run up egress that dwarfs the compute. (There is normally a small free monthly egress allowance, after which the meter starts.)
- Tier and region multiply everything. The same workload in a premium region on a Premium tier can cost several times what it costs in a cheaper region on a Standard tier. Always ask: do I need this tier, in this region?
A useful estimation instinct: Cost ≈ (what) × (how much) × (how long) × (where) × (which tier) — the resource, its quantity, its run-time, its region, and its service level. Get those five right and your estimate is usually within a sensible margin.
The two calculators: Pricing vs TCO
Microsoft gives you two free, login-free web calculators, and a common exam (and real-life) mistake is reaching for the wrong one. They answer different questions.
| Calculator | Question it answers | What you put in | What you get out | Use it when |
|---|---|---|---|---|
| Pricing Calculator | “What will this Azure design cost per month?” | Specific Azure services, SKUs, regions, hours, tiers | An itemised monthly/annual Azure estimate you can save and share | Designing or sizing a workload you intend to build on Azure |
| Total Cost of Ownership (TCO) Calculator | “How much cheaper is Azure than my current on-premises setup?” | Your existing servers, storage, network, electricity, IT labour | A side-by-side on-prem vs Azure cost comparison over years | Building the migration business case for moving to the cloud |
The distinction in one line: the Pricing Calculator prices a future Azure design; the TCO Calculator compares your existing on-premises costs against the equivalent on Azure to justify a move. If a question asks “estimate the monthly cost of a planned set of Azure VMs,” that is the Pricing Calculator. If it asks “show leadership the savings of migrating our data centre,” that is the TCO Calculator.
Governing spend: Microsoft Cost Management
Estimating cost before you build is half the job; controlling it after you build is the other half. Microsoft Cost Management is Azure’s free, built-in toolset for monitoring, allocating, and optimising spend. Its four pillars:
| Tool | What it does | The key idea |
|---|---|---|
| Cost analysis | Interactive view of actual + forecast spend, sliced by subscription, resource group, service, region, or tag | See where the money goes and where it is heading |
| Budgets | A spending threshold (per subscription/RG/etc.) that fires alerts at chosen percentages (e.g. 80%, 100%) | Get warned before you blow the budget |
| Azure Advisor (Cost) | Automated recommendations: right-size or shut down idle VMs, buy reservations, delete unattached disks | Azure tells you how to save |
| Tags | Key/value labels (e.g. env=prod, costcentre=marketing) attached to resources |
Allocate and charge back cost to teams/projects |
Each tool, a little deeper:
- Cost analysis is your dashboard. It shows month-to-date spend, a forecast to month-end, and lets you group and filter — by service to find the biggest consumers, by resource group to see per-application cost, or by tag to see per-team cost. This is where investigations start.
- Budgets are the safety net. A budget does not automatically stop spending — it is an alerting mechanism. You set a monetary (or usage) limit and choose alert thresholds; when actual or forecast spend crosses them, Azure emails the owners (and can trigger an action group to run automation, such as a notification or a Logic App). Crucial exam point: a budget warns; it does not by itself cap or shut anything down.
- Azure Advisor is a free service that continuously analyses your resources across five pillars — Cost, Security, Reliability, Operational Excellence, and Performance — and produces concrete recommendations. Its Cost recommendations are gold: shut down or right-size underused VMs, buy reservations for steady workloads, and remove orphaned resources like unattached managed disks and idle public IPs.
- Tags are the connective tissue of cost governance. Because every cost record can carry a resource’s tags, a consistent tagging scheme (owner, environment, cost centre, project) lets you split one big invoice into per-team, per-project, or per-environment views — the basis of showback (showing each team its cost) and chargeback (actually billing it back). Tags are inherited by convention, not automatically, so enforce them with Azure Policy.
Service-level agreements (SLAs)
An SLA is Microsoft’s formal, contractual promise about a service’s availability — the percentage of time it will be up in a given period — and the service credit (a partial refund) you can claim if it misses. SLAs are expressed as a percentage of uptime, and the difference between two percentages that look close is dramatic once you translate it into allowed downtime.
| SLA | Allowed downtime / month (~30 days) | Allowed downtime / year | Plain-English feel |
|---|---|---|---|
| 99% (“two nines”) | ~7 h 18 m | ~3.65 days | Generous; fine for non-critical/dev |
| 99.9% (“three nines”) | ~43.8 m | ~8.76 h | Common single-instance PaaS baseline |
| 99.95% | ~21.9 m | ~4.38 h | Typical for VMs in an availability set / multi-instance |
| 99.99% (“four nines”) | ~4.38 m | ~52.6 m | Achieved with availability zones |
| 99.999% (“five nines”) | ~26 s | ~5.26 m | Elite; multi-region, carefully engineered |
Read this table once and the stakes are obvious: moving from 99.9% to 99.99% shrinks tolerated downtime from nearly 9 hours a year to under an hour. That extra “nine” is exactly what availability zones buy you.
Composite SLA: chaining services multiplies risk
Here is the single most important — and most commonly tested — SLA concept. When your application depends on several services in series (a request must pass through all of them to succeed), the overall SLA is not the lowest one. You multiply the individual SLAs, because any component failing breaks the request. This product is the composite (or compound) SLA.
Composite SLA = SLA₁ × SLA₂ × SLA₃ × …
A worked example. Suppose a web request flows through App Service (99.95%) → Azure SQL Database (99.99%) → Azure Storage (99.9%), each as a hard dependency:
0.9995 × 0.9999 × 0.999 = 0.99840 → about 99.84%
The composite SLA (~99.84%) is lower than the weakest single component (99.9%), because the small risks compound. The more services you chain in series, the lower the combined promise — a sobering reason to keep critical paths short.
The opposite move is redundancy in parallel: deploy two independent copies of a component so the request succeeds if either works. Parallel redundancy raises availability (the chance both fail at once is the product of their tiny failure probabilities), which is precisely why we add zones and regions. The maths is the inverse: combined failure = failure₁ × failure₂, so two 99.9% instances in parallel approach 99.9999%.
How availability zones and region pairs raise the SLA
- Availability zones (AZs) are physically separate datacentres within one region, each with independent power, cooling, and networking. Spreading a workload across zones means a single datacentre failure no longer takes you down — which is why zone-redundant deployments earn the 99.99% tier where a single instance would only get 99.9%. Zones lift you one “nine” without leaving the region (so latency stays low and there is no cross-region egress).
- Region pairs are two regions in the same geography that Microsoft pairs for disaster recovery — they are updated at different times and Microsoft prioritises restoring at least one of the pair after a broad outage. Replicating across a region pair protects you from a whole-region failure (a natural disaster, say) — protection that zones alone cannot give — and underpins multi-region “five nines” designs. The trade-off is added complexity, latency, and cross-region egress cost.
The ladder to remember: single instance → 99.9%; availability set / multiple instances → 99.95%; availability zones → 99.99%; multi-region → toward 99.999%. Each rung adds resilience, and cost.
The service lifecycle: preview vs GA
Not every Azure feature is production-ready, and the service lifecycle tells you how finished a thing is. There are three stages.
| Stage | Who can use it | Maturity | SLA & support | Production use? |
|---|---|---|---|---|
| Private preview | Invited customers only | Early, experimental, may change drastically | No SLA, limited/no support | No |
| Public preview | Anyone (often opt-in) | Feature-complete-ish but still changing; “use at your own risk” | No SLA, best-effort support | No — test and evaluate only |
| General availability (GA) | Everyone | Stable, fully supported | Backed by an SLA, full support | Yes |
The phrase “preview means no SLA” is exam-critical and has a precise meaning: while a service is in preview (private or public), Microsoft makes no availability guarantee and you cannot claim service credits if it goes down or misbehaves. Preview features may also change their API, change their pricing, or be withdrawn entirely before GA. The rule of thumb: explore in preview, depend in GA. Use previews to learn and to plan, but build production systems on GA services so you are covered by an SLA and full support. (Microsoft also publishes retirement notices when a service is being deprecated — the other end of the lifecycle — typically with a year or more of notice.)
Azure support plans
When something goes wrong, the support plan on your subscription decides how fast Microsoft will help and how much hand-holding you get. There are four (excluding the bespoke enterprise agreements). They are cumulative: each tier adds to the one below.
| Plan | Indicative monthly cost | Who it is for | Technical support | Fastest response target |
|---|---|---|---|---|
| Basic | Free (every subscription) | Everyone | No paid technical support — docs, community, Service Health, Advisor only | n/a |
| Developer | Low (~US$29) | Trial / non-production / dev-test | Business-hours email support for non-critical issues | ~8 business hours |
| Standard | Mid (~US$100) | Production workloads | 24×7 support for production-down issues, phone + email | ~1 hour for critical (Sev A) |
| Professional Direct (ProDirect) | High (~US$1000) | Business-critical workloads | 24×7 with faster response, plus ProDirect delivery — architecture guidance, proactive advice, escalation management | ~1 hour for critical, with priority handling |
What actually changes as you climb the tiers:
- Basic is free on every subscription and is purely self-service: documentation, community forums, the Azure status page, Azure Service Health, and Azure Advisor. You can raise billing and subscription-management requests, but not paid technical support cases. Most learners and hobbyists live here.
- Developer adds the ability to open technical support cases, answered during business hours, for non-production environments — the right plan while you build and experiment but before you go live.
- Standard is the usual choice once you run production: 24×7 technical support with around a one-hour response target for critical, production-down issues, by phone and email.
- Professional Direct is for business-critical estates: everything in Standard plus faster, prioritised response and proactive guidance from Microsoft (architecture reviews, best-practice advice, an escalation point). For the very largest customers there are tailored Unified Support agreements above this.
A clean way to remember the decision: learning → Basic; dev/test → Developer; production → Standard; business-critical → Professional Direct.
Azure Service Health
Independent of your support plan, Azure Service Health is a free, personalised dashboard of the health of the Azure services you use. It surfaces three things: Service issues (active Azure outages affecting your resources right now), Planned maintenance (upcoming work that may affect you), and Health advisories (changes and deprecations that need your attention). You can set alerts on it so you are notified the moment an issue touches a region or service you depend on. Do not confuse it with the Azure status page (the global status of all Azure, for everyone) or with Resource Health (the health of one specific resource instance). Service Health is the personalised middle layer — and your first stop when “is it me or is it Azure?”.
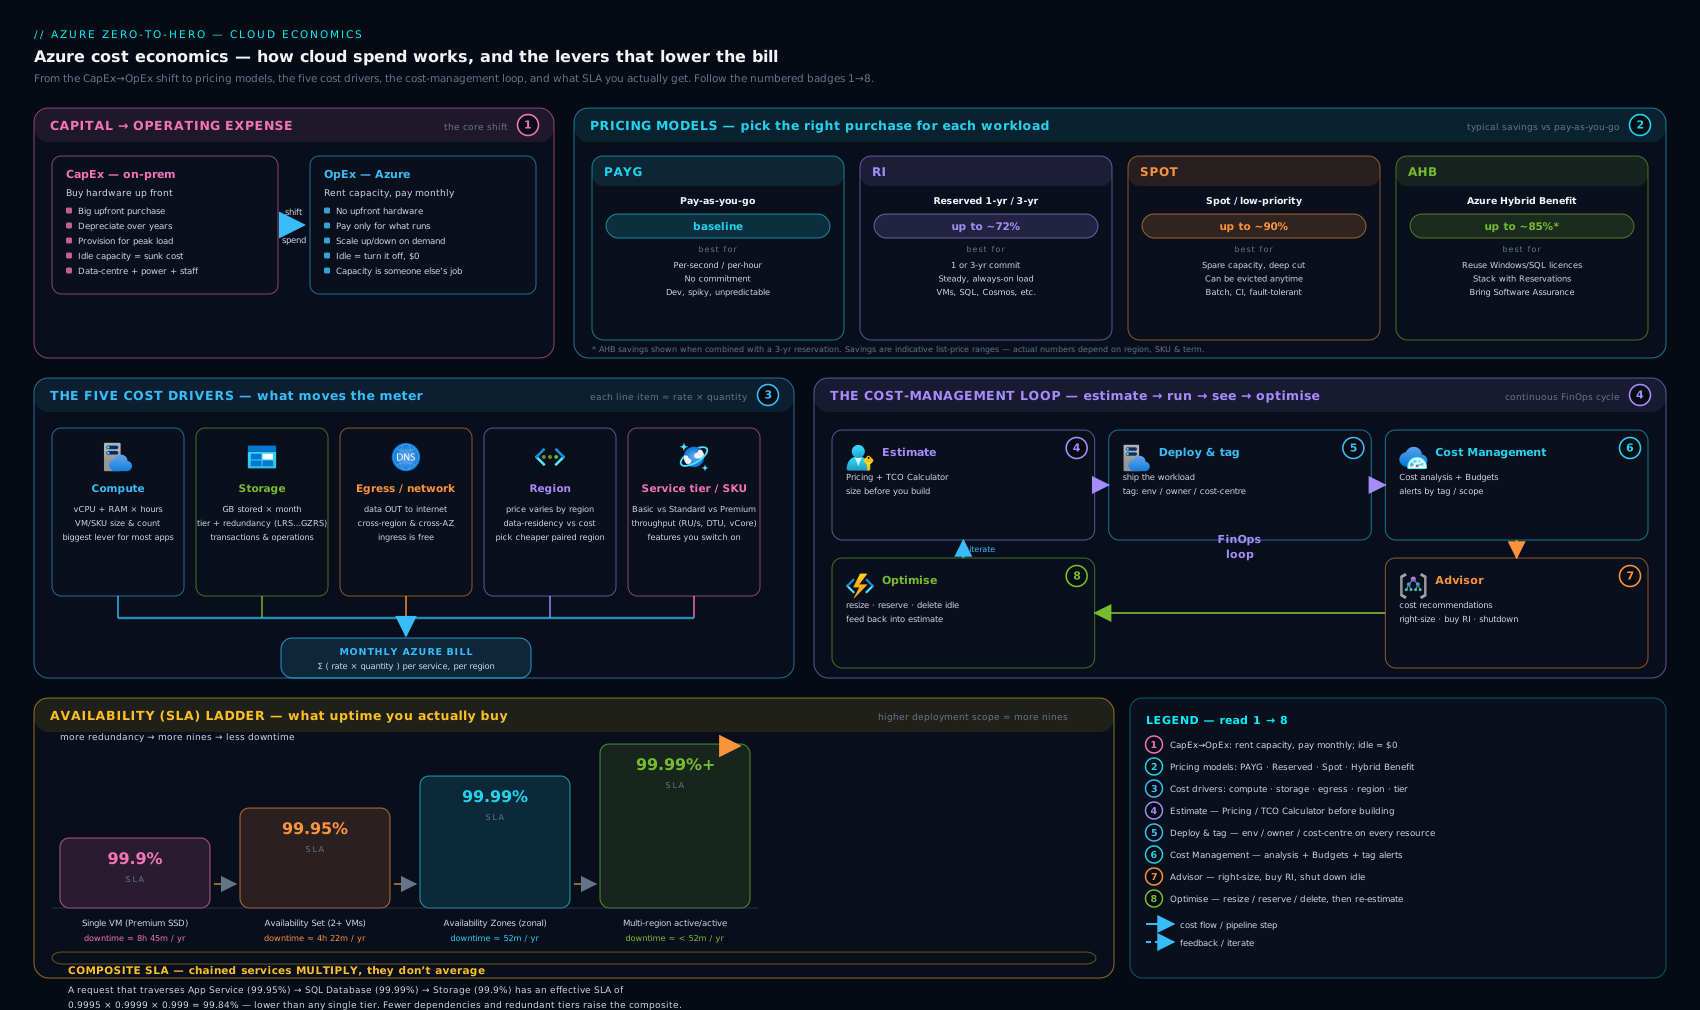
The diagram ties the pillars together: the pricing models and cost drivers feed the calculators and Cost Management on the spend side, while the SLA ladder, service lifecycle, and support plans form the value-and-assurance side of the same coin.
Going deeper
The sections above are enough to pass AZ-900 and to reason about a bill. This one is for the reader who will actually operate the spend-and-assurance machinery in production, where the interesting behaviour lives in the fine print.
Reservations and savings plans: scope, flexibility, and the exit
A commitment discount is only as good as its scope and its utilisation. A reservation (or savings plan) applies at one of four scopes — a single resource group, a single subscription, shared across every subscription in the billing account, or a management-group scope — and Azure applies the benefit automatically to matching usage in that scope, hour by hour. Set the scope too narrow and the discount goes unused in the hours your target resource is off; set it shared and any matching workload soaks up the benefit.
Two mechanics decide whether a commitment actually lands on your usage:
- Instance size flexibility. A VM reservation is not welded to one size. Within an instance size flexibility group (say, the Dsv5 family), the discount floats across sizes by a ratio — one reservation of a large size can cover two of half the size. This is why you reserve a family and region, not a single machine.
- Amortised vs actual cost. In Cost Management, the Actual cost view shows a reservation as a lump on the day it is billed; the Amortised cost view spreads that purchase evenly across the term and attributes it to the resources consuming it. For chargeback you almost always want the amortised view — it tells each team what its real share of the commitment cost.
The exit is where people get burned. An unused reservation is a negative discount, and Microsoft has tightened refund/exchange terms over the years (there is an annual cap on refunds, and compute-reservation exchanges have been curtailed) — treat current terms as something to re-check, not assume. The pragmatic order is: right-size first, reserve second, and prefer a savings plan when the workload’s SKU may drift. A savings plan commits to an hourly spend across eligible compute and self-applies to whatever you run, trading a few points of discount for not having to predict the SKU. The dedicated Reservations, savings plans & Hybrid Benefit strategy lesson works the full decision.
Spot, past the headline discount
Spot’s ~90% saving comes with two knobs most people never set. The eviction type is either capacity-only (you are reclaimed when Azure needs the hardware) or price-or-capacity (you also set a max price, and are evicted if the spot price rises above it). The eviction policy is Deallocate (the VM stops but its disk survives, so it can restart later) or Delete (everything goes). For a batch fleet you want Deallocate plus a checkpointing job, so an eviction costs minutes rather than the whole run. Spot works well inside a Virtual Machine Scale Set mixed with a small on-demand base, and the Spot Placement Score helps you pick a region and size with capacity to spare — but nothing about spot suits a stateful, must-stay-up tier.
Azure Hybrid Benefit’s fine print
Azure Hybrid Benefit (AHB) is a licensing discount, not a compute one, and it stacks on top of reservations — combine both and Microsoft quotes 80%-plus savings on eligible Windows VMs. The details that trip people up: Windows Server AHB grants a 180-day dual-use window so you can run on-premises and in Azure simultaneously during a migration; SQL Server AHB converts core licences to vCores at a fixed ratio (Enterprise cores stretch further than Standard); and AHB also applies to Linux — bringing your own RHEL or SUSE subscription converts a pay-as-you-go VM to bring-your-own. Forget to enable the benefit on the resource and you simply pay the license-included rate — the discount is opt-in, per VM.
An SLA is a financial instrument, not a forecast
Read an SLA the way a lawyer would. The number is a Monthly Uptime Percentage = (maximum available minutes − downtime) ÷ maximum available minutes, and the contract excludes downtime from scheduled maintenance, from preview features, from your own misconfiguration, and from force majeure. When a service misses, the service credit is tiered (representatively: below 99.9% → about 10% back, below 99% → about 25%, below 95% → up to 100%) — and crucially you must claim it, usually within two months; Azure does not refund automatically. Since 2023 there is no single “SLA summary” page — each product’s SLA lives in the Microsoft Product Terms site, so always read the specific service’s current SLA.
This reframes the composite-SLA maths. Multiplying SLAs assumes the components fail independently; in reality a shared region, a shared dependency, or one bad deployment causes correlated failure, so measured availability can be worse than the composite promise. And the composite number is a guarantee about credits, not a prediction of the uptime you will observe — good architecture (short critical paths, parallel redundancy, graceful degradation) is what actually moves real-world availability.
Egress, inter-zone traffic, and the current pricing reality
The egress story has moved. Every account now gets the first 100 GB per month of internet egress free, and — in response to the EU Data Act — Microsoft offers free data-transfer-out to customers who are leaving Azure for another provider. Inside a region, traffic between availability zones can still attract data-transfer charges, so a chatty zone-redundant design is not automatically free (verify the current rate for your services, as Microsoft has been adjusting this). Private connectivity has its own economics: Private Link, VNet peering, and ExpressRoute each meter data differently, and ExpressRoute even offers metered versus unlimited plans — the right choice depends on your steady egress volume.
FinOps: turning cost data into an operating model
At scale, cost stops being a monthly surprise and becomes a practice. Cost Management exports push daily cost data (now including the vendor-neutral FOCUS — FinOps Open Cost and Usage Specification — schema) to a storage account for your own analytics; cost anomaly detection flags unexpected spikes automatically; and tag inheritance can copy subscription and resource-group tags onto child cost records, so allocation is not defeated by one untagged resource. Which billing account you hold — EA (Enterprise Agreement), MCA (Microsoft Customer Agreement), or CSP — changes the APIs and who can see what, and access is gated by dedicated RBAC roles (Cost Management Reader, Billing Reader) so you can hand finance visibility without granting control of resources. The FinOps cost-engineering guide turns this into a repeatable pipeline.
Support, severities, and why quotas are not cost caps
A paid support plan buys a response-time target by severity — Sev A (critical, production down), Sev B, Sev C — not a resolution guarantee, and the plan sits per subscription, so a stray subscription can be on Basic while your production one is on Standard. The largest estates sit above Professional Direct on Unified Support (which replaced Premier). One more operational trap: quotas (a.k.a. limits) — such as “cores per region per subscription” — are capacity guardrails, not billing limits. Raising a quota is free and merely unlocks the ability to spend more; it is a request handled through the same support channel, but it neither costs money nor caps it. Governing actual spend still comes back to budgets, policy, and automation — the Service Health, Advisor & Resource Graph lesson shows the tooling side.
Hands-on lab
You will explore the real cost and health tooling in your own subscription — entirely within the free tier, creating no billable resources. All you need is a free Azure account and Azure Cloud Shell (the browser-based terminal in the portal). Everything below is read-only or trivially reversible.
Step 1 — Open Cloud Shell. In the Azure portal, click the terminal icon (>_) in the top bar and choose Bash. Cloud Shell is free; you are only billed for the small backing storage if you opt into it (a few rupees a month — you can decline and use an ephemeral session).
Step 2 — Inspect your subscription and current spend context.
# Confirm which subscription you are in
az account show --output table

# List the resource providers — these are the catalogues of services you *could* be billed for
az provider list --query "[?registrationState=='Registered'].namespace" --output table | head
Expected output: a table with your subscription name/ID and a list of registered providers (e.g. Microsoft.Compute, Microsoft.Storage). This is the surface area of what can generate cost.
Step 3 — Create a budget with an alert (this is free; a budget is metadata, not a billable resource). Replace <SUBSCRIPTION_ID> with the ID from Step 2.
# Set a ₹500 monthly budget that alerts the account owner at 80% and 100%
az consumption budget create \
  --budget-name "learn-monthly-cap" \
  --amount 500 \
  --category Cost \
  --time-grain Monthly \
  --start-date 2026-06-01 \
  --end-date 2027-06-01 \
  --resource-group "$(az group list --query '[0].name' -o tsv)" 2>/dev/null \
  && echo "Budget created" || echo "If this errors, create the budget in Portal → Cost Management → Budgets (the CLI surface varies by environment)"
Expected output: Budget created (or the fallback hint). Either way, now open Portal → Cost Management → Budgets to see it: this is the safety net that warns you before spend runs away. Note that it only alerts — it does not stop anything.
Step 4 — Read Azure Advisor’s cost recommendations (free, read-only).
# List any cost-saving recommendations Advisor has for your subscription
az advisor recommendation list --category Cost --output table 2>/dev/null \
  || echo "No cost recommendations yet (expected on a brand-new/empty subscription)"
Expected output: a (possibly empty) table. On an empty learner subscription there may be nothing yet; on a real subscription you would see “right-size VM”, “delete unattached disk”, etc.
Step 5 — Check Service Health from the portal. Go to Portal → Service Health → Service issues. You will see any active Azure incidents affecting your services and regions. Click Health alerts to see how you would wire up notifications. This is read-only.
Validation. You have (a) confirmed your billing scope, (b) created a budget you can see under Cost Management, © queried Advisor for savings, and (d) viewed Service Health — the four spend-and-assurance tools from this lesson, in your own account.
Cleanup. Delete the budget so nothing lingers:
az consumption budget delete --budget-name "learn-monthly-cap" \
  --resource-group "$(az group list --query '[0].name' -o tsv)" 2>/dev/null \
  || echo "If created in the portal, delete it under Cost Management → Budgets"
Cost note. This entire lab is free. Budgets, Advisor, Cost analysis, and Service Health are all no-cost features. If you opted into Cloud Shell’s persistent storage, that is roughly ₹5–₹15/month for the small file share — delete the backing storage account if you do not want even that.
Common beginner mistakes
These are mental-model errors — the wrong belief and the right one to replace it — as distinct from the symptom → cause → fix table earlier in the lesson.
- “The cloud is always cheaper.” Wrong: a lift-and-shift of an idle-heavy, over-provisioned, or egress-heavy workload can cost more than the data centre it left. Right model: the cloud is cheaper when you exploit what the data centre could not — right-sizing, switching resources off, and matching the pricing model to the workload’s shape. Savings are earned, not automatic.
- “A budget will stop my spending.” Wrong: a budget is a smoke alarm, not a circuit breaker; at 100% it emails you and (optionally) triggers an action group — the resources keep running. Right model: to actually cap spend, use quotas, Azure Policy, or automation wired to the alert.
- “A 99.99% SLA means my app will be up 99.99% of the time.” Wrong: the SLA is a financial promise about credits, full of exclusions, and it covers one service — not your whole architecture. Right model: your observed availability comes from your composite design and how you handle correlated failure; the SLA only says what refund you may claim.
- “Ingress and egress both cost money.” Wrong: inbound is free; only outbound (to the internet or across regions), after the free allowance, is metered. Right model: design to keep large data flows inbound or in-region — the direction is what costs.
- “Reserved instances lock my cash into one exact VM.” Wrong: reservations float across an instance-size-flexibility group and can be re-scoped, and savings plans don’t pin a SKU at all. Right model: the real risk is under-utilisation, so right-size before you commit and prefer a savings plan when the SKU may change.
- “Preview features are basically GA, just newer.” Wrong: preview means no SLA, no service credits, possible breaking changes, and maybe an incomplete compliance review. Right model: explore and plan on preview; depend only on GA.
- “A bigger tier or region is the safe default.” Wrong: over-provisioning the tier, or picking a premium region “to be safe,” is the single most common silent waste on a bill. Right model: size to the requirement and revisit with Advisor — you can change the SKU tomorrow.
Common mistakes & troubleshooting
| Symptom | Likely cause | Fix |
|---|---|---|
| “My budget didn’t stop the spending!” | A budget only alerts; it does not cap or shut down resources | Wire the budget alert to an action group that runs automation (e.g. deallocate VMs), or use Azure Policy/quotas to prevent the spend |
| Surprise charges after a “free” migration | Egress (outbound/cross-region data transfer) not estimated | Model egress in the Pricing Calculator; minimise cross-region chatter and large internet responses |
| Reservation bought but bill unchanged | Reservation scope wrong, or usage doesn’t match the reserved SKU/region | Check the reservation’s scope and utilisation in Cost Management; use a Savings Plan if the workload SKU drifts |
| Picked the TCO Calculator to size a new app | Confusing TCO (on-prem comparison) with Pricing (Azure estimate) | Use the Pricing Calculator to estimate an Azure design; TCO is for the migration business case |
| Built production on a preview feature, no credit after an outage | Preview = no SLA; service credits don’t apply | Use GA services in production; keep previews to evaluation only |
| Expected the composite SLA to equal the lowest component | Chained dependencies multiply, they don’t take the minimum | Compute the product of all in-series SLAs; shorten the critical path or add parallel redundancy |
| Can’t open a technical support ticket | On the Basic (free) plan, which has no paid technical support | Upgrade to Developer (dev/test) or Standard (production) |
Best practices
- Right-size before you reserve. Tune the resource to the real workload first; only then buy a reservation or savings plan for the steady baseline, so you commit to the correct size.
- Tag everything from day one with a consistent scheme (owner, environment, cost centre, project) and enforce it with Azure Policy so cost is allocatable from the start.
- Set budgets on every subscription with alerts at 50/80/100% — the cheapest insurance against a runaway bill.
- Review Azure Advisor cost recommendations on a cadence (monthly): kill idle VMs, delete orphaned disks and IPs, and act on reservation suggestions.
- Match the pricing model to the workload shape: spiky → PAYG, steady → reserved/savings plan, interruptible → spot.
- Design the critical path short. Fewer in-series dependencies means a higher composite SLA; add redundancy (zones, then regions) only where the SLA demands it, because each rung adds cost.
- Estimate egress explicitly in any multi-region or internet-facing design — it is the cost everyone forgets.
Security notes
- Cost data is sensitive. Spend patterns reveal architecture, scale, and business activity. Restrict who can view billing and Cost Management with RBAC (e.g. the Billing Reader / Cost Management Reader roles) rather than handing out broad access.
- Budget alerts as a security signal. A sudden, unexplained spend spike can be the first sign of a compromise — crypto-mining on hijacked VMs, or data being exfiltrated (which shows up as an egress spike). Treat unexpected budget alerts as a potential incident, not just a finance issue.
- Don’t trade the SLA for a quiet life. Resist disabling redundancy (zones, backups, geo-replication) purely to cut cost on a workload whose availability and recovery requirements actually demand it — the saving is illusory if an outage costs more than the redundancy.
- Mind preview governance. Preview features may not have completed the same security and compliance review as GA services; keep them out of regulated production paths.
Interview & exam questions
- What is the difference between CapEx and OpEx, and how does the cloud change the balance? CapEx is up-front spend on owned assets that depreciate; OpEx is ongoing pay-as-you-go consumption. The cloud converts most IT spend from CapEx to OpEx, removing up-front cost and over-provisioning risk and making elasticity financially valuable.
- Name Azure’s three pricing models and when you’d use each. Pay-as-you-go (consumption) for spiky/unpredictable/short-lived workloads; reservations or savings plans for steady 24×7 baselines (commit 1–3 years for up to ~72% off); spot for interruptible, fault-tolerant batch work (up to ~90% off, but can be evicted).
- What’s the difference between a Reservation and a Savings Plan? A reservation commits to a specific resource (e.g. a VM size in a region); a savings plan commits to a fixed hourly compute spend across services — more flexible, slightly smaller discount. Use a savings plan when the workload’s exact SKU may change.
- A web app calls App Service (99.95%) → SQL DB (99.99%) → Storage (99.9%) in series. What’s the composite SLA? Multiply them: 0.9995 × 0.9999 × 0.999 ≈ 99.84% — lower than the weakest component, because in-series risks compound.
- How do availability zones and region pairs each raise availability, and how do they differ? Zones are separate datacentres within a region (lift a single instance from 99.9% to 99.99%, protecting against a datacentre failure with no cross-region latency). Region pairs are two regions for disaster recovery (protect against a whole-region outage; add latency and egress cost).
- Which calculator do you use to justify a data-centre migration, and which to size a new Azure app? TCO Calculator compares your existing on-prem costs to Azure (the migration business case); Pricing Calculator estimates the cost of a planned Azure design.
- Does an Azure budget stop you from overspending? No. A budget alerts at thresholds (and can trigger an action group); it does not cap or shut down resources by itself. To actually prevent spend, use automation, quotas, or policy.
- What does “preview means no SLA” mean in practice? While a service is in private or public preview, Microsoft gives no availability guarantee and no service credits; the feature may change or be withdrawn. Use previews for evaluation only; run production on GA services.
- Which support plan would you put on a production workload, and which is free? Basic is free on every subscription (self-service only, no paid technical support). Production typically needs Standard (24×7, ~1-hour critical response). Business-critical estates use Professional Direct.
- What’s the difference between Azure Service Health, the Azure status page, and Resource Health? The status page is the global status of all Azure; Service Health is personalised to the services and regions you use; Resource Health is the health of one specific resource instance.
- Why is data egress a notorious cost driver? Inbound data is free, but outbound data (to the internet or across regions) is metered per GB after a small allowance — multi-region replication and chatty internet APIs can run egress that exceeds the compute cost.
- How do tags help with cost? Tags (key/value labels) attach to resources and flow into cost records, letting you slice spend by team, project, or environment for showback/chargeback. Enforce a consistent scheme with Azure Policy.
Quick check
- Spreading a workload across availability zones typically raises its SLA from 99.9% to which tier?
- True or false: an Azure budget automatically shuts down resources when you hit 100%.
- You have a steady production database running 24×7 for the next three years. Which pricing model is cheapest?
- Which calculator builds the business case for migrating an on-premises data centre to Azure?
- Three services chained in series have SLAs of 99.9%, 99.95% and 99.99%. Is the composite SLA higher or lower than 99.9%?
Answers
- 99.99% (“four nines”) — zone redundancy is what earns that extra nine.
- False. A budget only alerts (and can trigger automation via an action group); it does not stop spending on its own.
- A reservation (1- or 3-year) — or a savings plan — because the baseline is predictable and steady; commitment buys a large discount.
- The Total Cost of Ownership (TCO) Calculator, which compares current on-prem costs against the Azure equivalent.
- Lower — in-series SLAs multiply (0.999 × 0.9995 × 0.9999 ≈ 99.84%), so the composite drops below the weakest component.
Exercise
Using only free tools, produce a one-page “cloud economics brief” for a hypothetical app — a small internet-facing web app (one App Service) plus one Azure SQL Database, expected to run 24×7 in your nearest region, with modest internet traffic:
- Estimate the monthly Azure cost in the Pricing Calculator (pick Basic/Standard tiers; include a rough egress figure). Note the total in INR.
- Compute the composite SLA for the App Service → SQL chain (multiply the two services’ SLAs) and write down the tolerated downtime per month it implies.
- Propose one resilience upgrade (e.g. zone redundancy) and state how it changes the SLA and roughly the cost.
- Pick the right support plan for this app once it’s in production, and justify it in one sentence.
- List two cost-control measures you’d put in place on day one (e.g. a budget with alerts; a tagging scheme).
This mirrors exactly what an architect is asked to produce before a project is approved.
Practice challenges
Six graded exercises, beginner → advanced. Try each before opening the solution.
- (Beginner) Turn an SLA into downtime. A service publishes a 99.95% monthly SLA. How much downtime per 30-day month does that allow?
<details><summary>Solution</summary>
30 days ≈ 43,200 minutes; 0.05% of that is 43,200 × 0.0005 ≈ 21.9 minutes. Why: allowed downtime = (1 − SLA) × total minutes — the same arithmetic behind the SLA ladder table.
</details>
- (Beginner) Match the model to the shape. Assign the cheapest sensible pricing model to each: (a) a nightly batch job that can restart if interrupted; (b) a production API running 24×7 for the next three years; © a demo environment spun up for one week.
<details><summary>Solution</summary>
(a) Spot, (b) Reservation or savings plan, © Pay-as-you-go. Why: match commitment to predictability — interruptible → spot, steady baseline → commitment, short/uncertain → consumption. </details>
- (Intermediate) Composite SLA of a three-hop path. A request flows Front Door (99.99%) → App Service (99.95%) → Cosmos DB, single region (99.99%), all as hard dependencies. What is the composite SLA, and is it above or below the weakest link?
<details><summary>Solution</summary>
0.9999 × 0.9995 × 0.9999 ≈ 0.99930 → ~99.93%, which is below the weakest single component (99.95%). Why: in-series SLAs multiply, so every added hop can only lower the combined promise.
</details>
- (Intermediate) Query this month’s spend by service. Write an illustrative
azcommand that lists month-to-date actual cost grouped by service for a subscription.
<details><summary>Solution</summary>
az costmanagement query \
  --type ActualCost \
  --scope "/subscriptions/<SUBSCRIPTION_ID>" \
  --timeframe MonthToDate \
  --dataset-aggregation '{"totalCost":{"name":"Cost","function":"Sum"}}' \
  --dataset-grouping name=ServiceName type=Dimension
(Requires the costmanagement CLI extension; swap ActualCost for AmortizedCost to spread reservation costs across their term. Output is representative — IDs are placeholders.) Why: grouping by ServiceName is exactly how Cost analysis finds your biggest consumers — the CLI just scripts it.
</details>
- (Advanced) Reservation vs savings plan, with a twist. A team runs a steady compute baseline 24×7 but expects to re-platform from Dv5 VMs to a mix of App Service and Container Apps within a year. Which commitment do you buy, and why not the other?
<details><summary>Solution</summary>
Buy a 1-year savings plan for compute, not a VM reservation. Why: a reservation is pinned to a VM family and region and would strand its discount once the workload moves off VMs, whereas a savings plan commits to an hourly spend that self-applies across VMs, App Service, and Container Apps — the flexibility is worth the few points of lower discount, and the 1-year term hedges the re-platform. </details>
- (Advanced) Four nines at minimum egress. You must hit a 99.99% availability target for a regional web app while keeping data-transfer cost low. Sketch the design, and say when you would still add a second region.
<details><summary>Solution</summary>
Deploy zone-redundant within a single region (zone-redundant App Service or AKS plus a zone-redundant data tier) to reach 99.99% without cross-region egress. Add a second region (region pair) only when the requirement changes from “survive a datacentre failure” to “survive a whole-region outage” — a real DR mandate with defined RPO/RTO — accepting the added latency and egress. Why: zones buy the fourth nine in-region at near-zero data-transfer cost; regions buy disaster survival at real egress cost, so you add them for DR, not merely for an extra nine. See the Well-Architected Framework deep dive for the reliability-versus-cost trade-off. </details>
Certification mapping
This lesson maps directly to AZ-900: Microsoft Azure Fundamentals, primarily the domains:
- Describe cost management in Azure — factors affecting cost (compute, storage, egress, region, tier), the Pricing Calculator vs the TCO Calculator, and Microsoft Cost Management (cost analysis, budgets, tags), plus Azure Advisor cost recommendations.
- Describe features and tools for managing and deploying Azure resources — Azure Advisor and Service Health.
- Describe Azure cost, SLAs, and service lifecycles — purpose of SLAs, how to read uptime percentages, composite SLA calculation, factors that affect an SLA (zones, region pairs), and the preview vs GA service lifecycle.
CapEx/OpEx and the cloud economic benefits also appear in the “describe cloud concepts” domain. Mastering this material covers a substantial, high-frequency portion of the AZ-900 question pool.
Glossary
- CapEx (capital expenditure) — up-front spend on owned assets that depreciate over years.
- OpEx (operational expenditure) — ongoing pay-as-you-go spend on consumed services.
- Pay-as-you-go (PAYG) / consumption pricing — billed per unit actually used, no commitment, highest unit price.
- Reservation — 1- or 3-year commitment to a specific resource for a steep discount.
- Savings Plan — 1- or 3-year commitment to a fixed hourly compute spend across services; more flexible than a reservation.
- Spot pricing — deeply discounted spare capacity that Azure can evict on short notice.
- Azure Hybrid Benefit — applying owned Windows/SQL Server licences to cut Azure compute cost.
- Egress — outbound data transfer (to the internet or across regions), which is metered; ingress is free.
- Pricing Calculator — estimates the cost of a planned Azure design.
- TCO Calculator — compares existing on-premises costs to the Azure equivalent.
- Microsoft Cost Management — built-in tooling for cost analysis, budgets, and allocation.
- Budget — a spend threshold that alerts (it does not cap) when crossed.
- Tag — a key/value label on a resource used for cost allocation and governance.
- Azure Advisor — free service giving cost, security, reliability, operational, and performance recommendations.
- SLA (service-level agreement) — Microsoft’s contractual uptime promise, with service credits if missed.
- Composite (compound) SLA — the product of the SLAs of services chained in series.
- Availability zone — a physically separate datacentre within a region.
- Region pair — two regions in a geography paired for disaster recovery.
- Service credit — a partial refund granted when an SLA is missed.
- Preview (private/public) — a pre-GA service stage with no SLA and limited support.
- General availability (GA) — the stable, fully supported, SLA-backed stage.
- Support plan — the tier (Basic/Developer/Standard/Professional Direct) setting your support speed and scope.
- Azure Service Health — personalised dashboard of Azure issues, maintenance, and advisories affecting your resources.
- Instance size flexibility — the mechanism by which a VM reservation’s discount floats across sizes in the same family by a ratio, so you reserve a family + region, not one machine.
- Reservation scope — where a commitment applies: a resource group, a single subscription, shared across the whole billing account, or a management group.
- Amortised cost / actual cost — two Cost Management views: actual shows a purchase as a lump when billed; amortised spreads it across the term and attributes it to the resources consuming it.
- Eviction (spot) — Azure reclaiming a spot VM when it needs the capacity (or the price exceeds your max), with about 30 seconds’ notice; the policy is either Deallocate (keep the disk) or Delete.
- Monthly Uptime Percentage — the SLA’s formula: (available minutes − downtime) ÷ available minutes, subject to contractual exclusions.
- Showback / chargeback — showing each team its share of cost (showback) versus actually billing it back to them (chargeback); both are built on tags.
- FinOps — the discipline of managing cloud cost as a cross-functional operating practice (engineering + finance), not a monthly afterthought.
- FOCUS — FinOps Open Cost and Usage Specification, a vendor-neutral schema for cost data that Azure can export.
- Cost anomaly detection — Cost Management’s automatic flagging of unexpected spend spikes.
- Action group — an Azure Monitor construct that runs notifications or automation (email, webhook, Logic App, Function) when triggered, e.g. by a budget alert.
- Quota (limit) — a capacity guardrail (e.g. cores per region per subscription); free to raise, and not a spending cap.
- Unified Support — Microsoft’s enterprise-wide support agreement (successor to Premier), sitting above the per-subscription plans.
- Dual-use rights — the 180-day window under Azure Hybrid Benefit during which a licence may cover both on-premises and Azure use for a migration.
Next steps
Now that you can reason about cost and SLAs, ground them in the physical platform they describe. Continue to Azure Global Infrastructure: Geographies, Regions, Availability Zones, Fault & Update Domains, which makes the availability concepts in this lesson concrete — exactly how zones, region pairs, fault domains, and update domains deliver the SLA ladder you just learned to calculate. From there, the commitment-strategy and FinOps lessons go deeper on squeezing the bill once you are running real workloads.