In a nutshell
Think of cost optimization as running a lean kitchen, not a stingy one. A good kitchen doesn’t serve worse food to save money — it stops wasting money so more of it reaches the plate. It buys in bulk what it always uses (that’s a reservation or savings plan — commit to the flour and oil you burn through every day and pay a fraction of corner-shop prices). It turns off the burners between orders (that’s autoscale, scale-to-zero, and shutting dev environments down overnight — you don’t leave six hobs roaring while the dining room is empty). It right-sizes the pans (that’s matching the SKU to the workload — you don’t heat a stockpot to poach one egg). And a great kitchen watches cost per plate, not just the grocery bill — because a bill that doubled when covers tripled is a good night, and only per-plate cost tells you that.
That last point is the heart of it: the Azure Well-Architected Cost Optimization pillar is not “make everything cheap.” It is “make every rupee earn its keep.” Sometimes that means spending more on the workload that drives revenue and ruthlessly cutting the forgotten test environment nobody’s touched since March. The pillar gives you a disciplined way to tell those two apart instead of trimming on instinct and causing an outage.
Under the hood there are only two levers, and beginners constantly conflate them. You can pay a lower rate for a unit of capacity (reservations, savings plans, spot, Hybrid Benefit — the “buy in bulk” moves), or you can consume fewer units (right-sizing, autoscale, shutdown, deleting orphans — the “turn off the burners” moves). They stack, and the order matters: fix usage first, then buy rate, because a three-year discount on an oversized VM just locks in your waste at a discount. This lesson walks the whole pillar — the five design principles, a cost model, guardrails, rate and usage optimization, and the FinOps culture that keeps it all running — the way a principal architect actually sequences it.
Level: Advanced · Time: ~46 min read
Prerequisites. You should be comfortable with core Azure building blocks (VMs, App Service, a managed database, storage) and know what a subscription and resource group are. It helps to have met the Well-Architected Framework’s five pillars first — see the Azure Well-Architected Framework deep dive. No finance background is assumed; every money term is defined in the Glossary at the end.
After this lesson you can:
- Explain the five Cost Optimization design principles and why the correct sequence is usage-first, then rate.
- Build a cost model that maps architecture to billing meters and expresses spend in business units (cost per order/tenant/transaction), not just raw rupees.
- Set budgets with both actual and forecast alerts, wire a non-prod breach to automated shutdown, and turn on anomaly detection.
- Choose correctly between reservations, savings plans, spot, and Azure Hybrid Benefit for a given workload’s commitment-risk profile.
- Find and kill zombie/orphaned resources, and read a commitment-heavy bill using amortized cost.
- Stand up a lightweight FinOps review cadence so optimization recurs instead of being a one-off cleanup.
Where this fits
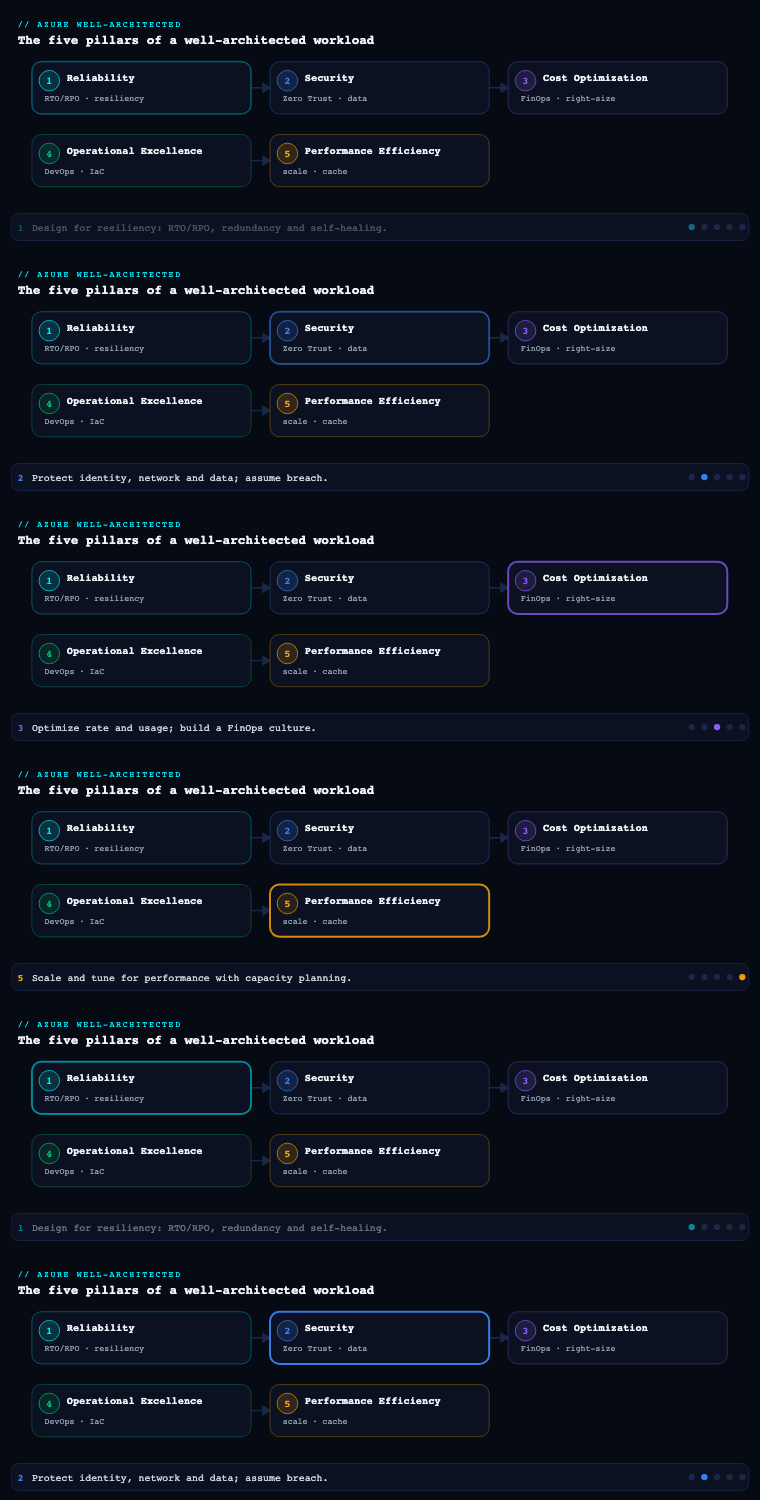
The Azure Well-Architected Framework (WAF) is built on five pillars — Reliability, Security, Cost Optimization, Operational Excellence, and Performance Efficiency — and Cost Optimization is the third, the one that keeps the other four honest. Where Reliability and Performance Efficiency tend to push spend up (redundancy, headroom, premium tiers) and Security gates features behind premium SKUs, Cost Optimization is the pillar that forces every one of those decisions to carry a price tag and a justification. It is not “the cheap pillar” — its goal is to maximize the business value delivered per rupee spent, which sometimes means spending more on a revenue-driving workload and ruthlessly cutting a forgotten dev environment. The pillar is expressed in the WAF as five design principles and fourteen recommendations (CO:01–CO:14); this article goes deep on the sub-components that matter most in practice: the design principles, the cost model, guardrails (budgets and alerts), rate optimization, usage optimization, and the FinOps culture that makes all of it stick.
Cost design principles
What it is. The Cost Optimization pillar is anchored by five design principles that frame how you think before you touch a single SKU. In the WAF’s own words they are: develop cost-management discipline, design with a cost-efficiency mindset, design for usage optimization, design for rate optimization, and monitor and optimize over time. Everything else in the pillar is an instance of one of these five.
Why it matters. Principles are what stop cost work from degenerating into a one-off “cost sprint” that trims redundancy on instinct, causes an incident, and provokes a swing back to over-provisioning. The principles separate the two genuinely different levers you have — paying a lower rate for a unit of capacity, versus consuming fewer units — so you stop conflating them. They also put time into the model: cost optimization is a continuous flywheel, not a project with an end date, because Azure ships new SKUs, your traffic shape changes, and reservations expire.
How to do it well. Map every cost decision to the principle it serves, and recognize that the two optimization principles are orthogonal and multiplicative:
| Design principle | The question it answers | Primary mechanisms |
|---|---|---|
| Develop cost-management discipline | Who is accountable, and against what budget? | Cost owners, budgets, governance policy, chargeback/showback |
| Design with a cost-efficiency mindset | Are we buying the right shape of service at all? | PaaS over IaaS, serverless, consumption tiers, managed services |
| Design for rate optimization | Are we paying the lowest unit price for capacity we will use? | Reservations, savings plans, spot, Azure Hybrid Benefit, dev/test pricing |
| Design for usage optimization | Are we consuming the fewest units needed to meet the SLO? | Right-sizing, autoscale, shutdown schedules, deleting orphans |
| Monitor and optimize over time | Is the bill still justified as the world changes? | Cost reviews, anomaly detection, reservation/SP utilization, trend KPIs |
The decisive insight is that rate and usage optimization stack. A reserved instance you have right-sized and auto-scaled is cheaper than either lever alone — but rate optimization on an oversized resource simply locks in waste at a discount. The correct order is therefore usage first, then rate: right-size and consolidate the estate, settle on a stable baseline, and only then buy reservations and savings plans against that baseline.
Artifacts & Azure tooling. The principles themselves are not an artifact; they are the lens for the rest of this article. The tooling that makes them concrete is Microsoft Cost Management (cost analysis, budgets, exports), the Azure pricing calculator and Total Cost of Ownership (TCO) calculator for design-time estimates, and Azure Advisor’s Cost category for continuous recommendations. The WAF’s own Cost Optimization design review checklist and the tradeoff/Power of 10 review questions are the principal’s running document for every architecture review.
Building a cost model
What it is. A cost model (WAF recommendation CO:02) is a structured estimate of what a workload will cost to run, before you build it and continuously after. It maps the architecture’s components and flows to billing meters, factors in expected usage, environments, and growth, and produces a number you can put in a budget. It is the WAF equivalent of a unit-economics model: cost per request, per tenant, per transaction, or per active user — whatever the business actually sells.
Why it matters. Without a model, “is this expensive?” has no answer, budgets are guesses, and you cannot tell an anomaly from growth. A cost model is also the only honest way to evaluate architecture tradeoffs: you cannot compare “Premium SSD v2 vs Ultra Disk” or “AKS vs Container Apps” until both are priced against the same usage assumptions. Crucially, a model expressed in business units (₹ per 1,000 orders) lets you defend or kill spend on value, not on raw rupees — a bill that doubled because order volume tripled is a win, and only a unit-cost model shows that.
How to do it well. Build the model in layers, and keep it living:
- Inventory components and flows. List every billable resource (compute, storage, data transfer, PaaS meters, licenses) and the request/data flows between them. Cross-region and cross-zone egress is the line item teams forget — price it explicitly.
- Attach meters and quantities. For each component, identify the Azure meter and the consumption driver (vCPU-hours, GB-months, operations, RU/s, egress GB). Pull live prices from the Azure Retail Prices API (no auth required) so the model uses real numbers, not memory.
- Layer in environments and growth. Model prod, plus a discount factor for non-prod (dev/test pricing, smaller SKUs, scheduled shutdown). Add a growth curve and a peak-to-average ratio so the model spans baseline and burst.
- Separate fixed vs variable, and committed vs on-demand. Split the bill into a fixed floor (always-on baseline you can reserve) and a variable layer (scales with load, stays pay-as-you-go or spot). This split is exactly what later drives the reservation-coverage decision.
- Express unit cost. Divide modeled cost by the business driver to get cost-per-unit, then track it as the headline KPI.
A worked fragment of the meter-mapping table:
| Component | Azure meter / driver | Quantity (monthly) | Pricing source |
|---|---|---|---|
| App tier | App Service P1v3 vCPU-hours | 3 × 730 hrs | Retail Prices API |
| Database | Azure SQL Business Critical vCores | 8 vCore, ZR | Calculator + RI quote |
| Cache | Azure Cache for Redis C2 | 730 hrs | Retail Prices API |
| Data egress | Inter-region transfer GB | 1,200 GB | Bandwidth meter |
| Observability | Log Analytics ingestion GB | 90 GB @ commitment tier | Retail Prices API |
Pulling a live price to seed the model:
# Live unit price for an App Service P1v3 instance in Central India — no auth needed
curl -s "https://prices.azure.com/api/retail/prices?\$filter=serviceName eq 'Azure App Service' and armRegionName eq 'centralindia' and skuName eq 'P1 v3'" \
  | jq -r '.Items[] | "\(.meterName): \(.retailPrice) \(.currencyCode)/\(.unitOfMeasure)"'
Artifacts & Azure tooling. The deliverable is a cost model spreadsheet or workbook plus a unit-economics definition (the chosen business driver). Use the Azure pricing calculator for a shareable estimate, the TCO calculator when comparing against on-premises, the Retail Prices API to keep numbers current, and the ACE (Azure Cost Estimator) / Microsoft Cost Management connector to Power BI to reconcile the model against actuals once the workload is live.
Budgets and alerts (spending guardrails)
What it is. Guardrails (CO:04 — set spending guardrails) are the automated controls that keep spend inside the envelope the cost model defined. The two core constructs are budgets (a target amount at a scope, with thresholds) and alerts (notifications and automated actions triggered when actual or forecasted spend crosses a threshold). Guardrails also include Azure Policy rules that prevent expensive choices and anomaly detection that flags unexpected spend even when no threshold is crossed.
Why it matters. A budget without alerts is a wish; an alert without an action is noise. The reason this sub-component exists is that cloud spend is post-paid and self-service — any engineer can stand up a GPU VM at 2 a.m., and you find out 30 days later on the invoice. Guardrails close that gap from a month to minutes, and forecast-based alerts close it further by warning you before you blow the budget, not after. They are also the enforcement layer for the discipline principle: a budget owned by a team, breaching at 80%, is what turns “be cost-conscious” into a Tuesday-morning conversation.
How to do it well. Layer guardrails so they are both preventive and detective, and make at least one of them act:
- Set budgets at every meaningful scope. Create budgets in Microsoft Cost Management at the management group, subscription, and resource-group levels (and per tag, e.g.
costCenterorenv). Scope mirrors accountability — a team that owns a resource group owns its budget. - Use both actual and forecasted thresholds. Configure multiple alert thresholds (e.g. 50%, 80%, 100% of actual, plus a 100%-of-forecast alert). Forecast alerts use Cost Management’s predicted month-end spend and are the early-warning signal that matters.
- Wire alerts to action, not just email. Route budget alert action groups to an Azure Monitor action group that can trigger a Logic App, Azure Function, or runbook — for non-prod, an over-budget signal can automatically deallocate VMs or scale down. Treat auto-shutdown of dev/test as the default response to a non-prod breach.
- Turn on anomaly detection. Enable Cost Management anomaly detection so a sudden spike (a runaway loop, a misconfigured autoscale, a leaked key mining crypto) is caught independently of any threshold.
- Prevent the expensive mistake with policy. Use Azure Policy to deny disallowed SKUs/regions, require tags for cost allocation, and restrict the most expensive resource types to approved subscriptions. Prevention is cheaper than a refund request.
| Guardrail | Azure construct | Trigger | Typical response |
|---|---|---|---|
| Budget threshold (actual) | Cost Management budget | 80% / 100% of monthly target | Email + Teams to cost owner |
| Budget threshold (forecast) | Cost Management budget (forecast) | Forecast ≥ 100% | Escalate, review before month-end |
| Spend anomaly | Cost Management anomaly detection | Statistical spike vs baseline | Investigate within 24h |
| Non-prod runaway | Budget alert → action group → Logic App | Non-prod budget breach | Auto-deallocate / scale to zero |
| Expensive SKU/region | Azure Policy (deny) | Resource create | Blocked at deployment |
Artifacts & Azure tooling. Deliverables: a budget hierarchy (mgmt group → subscription → RG/tag), an alert/action-group runbook mapping each threshold to an owner and an action, a set of Azure Policy cost guardrails, and an anomaly-detection subscription. Core tools: Microsoft Cost Management budgets and anomaly detection, Azure Monitor action groups, Logic Apps/Functions/Automation runbooks for automated response, and Azure Policy for prevention.
Rate optimization (reservations, savings plans, spot)
What it is. Rate optimization (CO:05 — get the best rates) is the lever that lowers the unit price of capacity you have already decided you need. The three principal mechanisms on Azure are Reservations (commit to a specific resource type/region for 1 or 3 years), Azure savings plans for compute (commit to a fixed hourly spend on compute for 1 or 3 years, with flexibility across SKUs/regions/services), and Spot (bid on Azure’s spare capacity at deep discounts in exchange for evictability). On top of those sit Azure Hybrid Benefit (reuse on-prem Windows Server / SQL Server licenses with Software Assurance) and dev/test pricing for non-prod.
Why it matters. Pay-as-you-go is the most expensive way to run a stable baseline — you are paying a premium for the right to walk away at any second, a right you do not exercise on a database that runs 24/7. Rate optimization recovers that premium: commitment discounts routinely reach up to ~72% vs pay-as-you-go for 3-year reservations, savings plans up to roughly 65%, and spot up to ~90% for interruptible work. On a seven-figure compute bill these are not rounding errors — rate optimization is frequently the single largest cost lever available, and it requires no code change.
How to do it well. Choose the instrument that matches the workload’s commitment risk profile, and never reserve waste:
- Right-size first. Buy commitments only against a baseline you have already right-sized and consolidated — otherwise you lock in oversized waste for three years.
- Reservations for stable, specific capacity. Use Reserved Instances where the resource type is stable and unlikely to change SKU: production SQL/MySQL/PostgreSQL, Cosmos DB (reserved RU/s), Azure VMware Solution, and steady VM families. Reservations give the deepest discount but the least flexibility.
- Savings plans for fluid compute. Use Azure savings plans for compute when you have a steady spend on compute but expect to move across VM series, regions, App Service, Container Instances, or Functions Premium. You commit ₹/hour, not a specific SKU, so the discount follows your workloads as they evolve.
- Spot for interruptible, stateless, or batch work. Use Spot VMs and AKS spot node pools for CI/CD, batch, rendering, big-data, and any horizontally-scalable stateless tier that tolerates 30-second eviction notice. Pair with on-demand for a guaranteed floor and spot for the burst.
- Stack license benefits. Apply Azure Hybrid Benefit to Windows/SQL where you hold Software Assurance, and Extended Security Updates for migrated legacy servers at no extra charge. Use dev/test subscriptions for non-prod to strip the Windows/SQL license cost from those environments.
- Manage the portfolio. Reservations and savings plans are financial instruments — track utilization (are you using what you bought?) and coverage (what % of eligible spend is discounted?), and let Azure Advisor recommend purchases sized from your actual 7/30/60-day usage.
| Instrument | Discount (vs PAYG, illustrative) | Commitment | Flexibility | Best for |
|---|---|---|---|---|
| Reservation (1/3-yr) | up to ~72% | Specific resource type, term | Low (exchange/refund, instance-size flex) | Stable prod DBs, steady VM families, Cosmos RU/s |
| Savings plan for compute | up to ~65% | Hourly compute spend, term | Medium (any SKU/region/eligible service) | Fluid compute that changes shape |
| Spot | up to ~90% | None | High, but evictable (30s notice) | Batch, CI, stateless burst, AKS spot pools |
| Azure Hybrid Benefit | reuse owned licenses | Software Assurance | n/a — stacks with above | Windows/SQL workloads you already license |
The instruments stack: a reserved or savings-plan-covered baseline, Azure Hybrid Benefit on the licenses, and spot for the burst layer is the canonical low-rate composition.
Artifacts & Azure tooling. Deliverables: a commitment plan (baseline to reserve, target coverage %, 1-yr vs 3-yr mix), a reservation/savings-plan purchase record with renewal dates, and a utilization/coverage dashboard. Tools: Azure Advisor (purchase recommendations and utilization alerts), Microsoft Cost Management (reservation utilization, coverage, and amortized-cost views), the Reservations and Savings plans blades, and Azure Spot capacity/eviction settings.
Usage optimization (right-sizing, autoscale, shutdown)
What it is. Usage optimization (CO:06–CO:12 — align to billing increments, optimize component/environment/flow/data/code/scaling costs) is the other lever: consume fewer units in the first place. Its three highest-leverage moves are right-sizing (matching SKU to actual demand), autoscale (adding and removing capacity to track load instead of provisioning for peak), and shutdown/deallocation (turning off what is not in use, especially non-prod and orphaned resources).
Why it matters. Most cloud waste is usage waste, not rate waste: VMs at 5% CPU running 24/7, dev environments idling every night and weekend, orphaned disks and unattached public IPs billing forever, and over-provisioned databases sized for a launch-day peak that never recurs. A rupee of usage you eliminate is a rupee saved at the full rate — and it compounds with rate optimization, because right-sizing shrinks the baseline you then reserve. Right-sizing and autoscale are also where Cost Optimization and Performance Efficiency meet: the same telemetry that proves a SKU is oversized proves it can scale in safely.
How to do it well.
- Right-size from telemetry, not vibes. Use Azure Advisor’s right-sizing/shutdown recommendations (sourced from real CPU/memory/network metrics) to drop or resize underutilized VMs, and apply the same to App Service plans, AKS node pools, SQL DTUs/vCores, and Cosmos RU/s. Re-run on a cadence — right-sizing is not one-and-done.
- Pick the right service shape. Often the biggest usage win is changing the model: move always-on IaaS to consumption-based services — Azure Functions (Consumption/Flex), Container Apps (scale-to-zero), Azure SQL serverless (auto-pause), and Cosmos DB serverless/autoscale RU/s. You stop paying for idle entirely.
- Autoscale to demand. Configure VM Scale Set autoscale, AKS Cluster Autoscaler + KEDA (event-driven, scale-to-zero), and App Service autoscale against metric and schedule rules so capacity tracks load. Add schedule-based scaling for predictable diurnal patterns (scale up at 8 a.m., down at 8 p.m.).
- Shut down what idles. Apply auto-shutdown to dev/test VMs (DevTest Labs auto-shutdown, or Automation/Logic App schedules), scale non-prod AKS/App Service to zero or minimum overnight, and auto-pause serverless databases. A dev environment that runs 45 of 168 weekly hours costs ~27% of an always-on one.
- Delete the orphans. Hunt unattached managed disks, unassociated public IPs, idle load balancers, empty App Service plans, stale snapshots, and ungoverned dev resources. Use Azure Resource Graph queries on a schedule to find them, and tag-or-delete policies to stop them recurring.
- Align to billing increments. Match resource lifetime and size to how Azure bills (per-second vs per-hour, reserved RU/s vs request-units, Log Analytics commitment tiers vs pay-per-GB). Right-sizing the increment — e.g. moving Log Analytics to a commitment tier, or batching small writes — is real, often-missed savings.
A scheduled orphan hunt, expressed as a Resource Graph query:
// Unattached managed disks across the tenant — prime deletion candidates
Resources
| where type == "microsoft.compute/disks"
| where properties.diskState == "Unattached"
| project name, resourceGroup, subscriptionId,
          sizeGB = properties.diskSizeGB,
          sku = sku.name, location
| order by sizeGB desc
| Usage lever | Mechanism | Azure service/tool | Typical saving driver |
|---|---|---|---|
| Right-sizing | Resize/drop underutilized | Azure Advisor, VM Insights | Idle CPU/memory headroom |
| Service shape | Move to consumption/serverless | Functions, Container Apps, SQL serverless | Pay only for active use |
| Autoscale | Track load, not peak | VMSS autoscale, AKS + KEDA, App Service | Peak-to-average gap |
| Shutdown | Off when idle | DevTest Labs, Automation, Logic Apps | Non-prod idle hours |
| Orphan cleanup | Delete unused | Resource Graph, Azure Policy | Forgotten resources |
Artifacts & Azure tooling. Deliverables: a right-sizing backlog (from Advisor), autoscale rule definitions (metric + schedule), shutdown schedules for non-prod, and a recurring orphaned-resource report. Tools: Azure Advisor, Azure Monitor / VM Insights (the telemetry that justifies each change), VMSS/AKS/App Service autoscale, KEDA, DevTest Labs, Azure Automation, and Azure Resource Graph for fleet-wide queries.
A FinOps culture
What it is. A FinOps culture (CO:01 — create a culture of financial responsibility, plus CO:03 collect and review cost data and CO:13 optimize personnel time) is the operating model that makes everything above recur instead of being a one-off cleanup. It is the practice — codified by the FinOps Foundation as the phases Inform, Optimize, Operate — that gives engineers cost visibility, makes them accountable for the spend they create, and runs the optimization flywheel as a normal part of operations rather than a fire drill.
Why it matters. Tooling cannot save you from an organization where nobody owns the bill. The single biggest predictor of cloud cost outcomes is not which reservations you bought; it is whether the engineers who provision resources can see and are accountable for what those resources cost. FinOps moves cost from a quarterly finance surprise to a real-time engineering signal, and it deliberately frames the goal as value, not minimization — the conversation is “is this spend earning its keep?”, which is the only framing that lets you increase spend where it pays off and cut where it does not. CO:13 adds the often-forgotten dimension: personnel time is a cost too, so automating toil (auto-shutdown, IaC, self-service) is a legitimate cost-optimization, not a distraction from it.
How to do it well.
- Make spend visible to the people who cause it (Inform). Enforce a tagging/resource-naming taxonomy (
costCenter,owner,env,application) via Azure Policy so every rupee is allocable, then publish showback/chargeback dashboards per team in Power BI on the Cost Management connector or FOCUS-format exports. You cannot hold a team accountable for a number it cannot see. - Assign cost owners and budgets (Operate). Every workload and subscription gets a named cost owner who owns its budget and its monthly review. Tie budgets (from the guardrails section) to those owners so breaches land on a desk, not in a void.
- Run a regular cost review cadence (Optimize). Hold a recurring (monthly is typical) cost review — Advisor recommendations, reservation utilization and coverage, anomaly investigations, unit-cost trend, and the top movers. Treat it like an operational review with actions and owners, not a finance read-out.
- Set KPIs in business units. Track unit cost (₹ per transaction/tenant/order), reservation/savings-plan coverage and utilization, % of spend tagged/allocable, waste eliminated, and forecast accuracy. Headline the unit-cost trend so growth is never mistaken for waste.
- Automate the toil (CO:13). Push optimization into pipelines: IaC with cost estimation in PRs, auto-shutdown by default in non-prod, scheduled orphan cleanup, and self-service guardrailed provisioning so engineers move fast without finance-by-ticket.
- Build a central FinOps function with federated execution. A small central team owns tooling, reservation purchasing, and standards (a FinOps Center of Excellence); the workload teams own their own usage and budgets. Central buys rate; the edge controls usage.
| FinOps phase | Goal | KPI | Primary Azure tooling |
|---|---|---|---|
| Inform | Visibility & allocation | % spend tagged; showback coverage | Cost Management, tags, Azure Policy, Power BI |
| Optimize | Reduce rate & usage | Coverage %, utilization %, waste removed | Advisor, Reservations, Savings plans |
| Operate | Continuous accountability | Unit cost trend, forecast accuracy | Budgets, anomaly detection, cost reviews |
Artifacts & Azure tooling. Deliverables: a tagging standard enforced by policy, showback/chargeback dashboards, a cost-review charter and cadence, a RACI for FinOps roles, and a KPI scorecard. Tools: Microsoft Cost Management (exports, FOCUS, the Power BI connector), Azure Policy (tag enforcement), Azure Advisor, and the FinOps Foundation framework as the methodology backbone.
Real-world enterprise scenario
MeridianRetail, a fictional ₹-denominated omnichannel retailer (1,400 employees, e-commerce + 320 stores), runs everything on Azure across a CAF enterprise-scale landing zone: a Corp and Online management group, ~40 subscriptions, AKS for the storefront, Azure SQL Business Critical for orders, Cosmos DB for the product catalog, Azure Functions for event processing, and a large analytics estate on Synapse and Log Analytics. Their cloud bill has grown to ₹4.2 crore/month and finance has flagged that it is rising faster than revenue. The CTO charters a FinOps initiative led by a principal architect, working the Cost Optimization pillar end to end.
Cost design principles. The architect frames the program around the five principles and, critically, sequences it usage-first, then rate — Advisor already shows ~22% of compute is underutilized, so buying reservations now would lock in waste. Two parallel tracks are stood up: a usage track (right-sizing, autoscale, shutdown, orphan cleanup) and a rate track (reservations, savings plans, spot, Hybrid Benefit), with a monitor track (FinOps cadence) wrapping both.
Building a cost model. The team builds a workbook mapping every component to its meter, seeded with live numbers from the Retail Prices API, and splits the bill into a stable baseline (~₹2.9 crore — always-on SQL, baseline AKS, Cosmos) and a variable layer (~₹1.3 crore — batch, burst, analytics). They define the headline unit metric as ₹ per 1,000 orders and discover it has crept from ₹540 to ₹690 over a year — proof the spend growth is partly waste, not just volume.
Budgets and alerts. Budgets are created in Microsoft Cost Management at every management group and subscription, plus per-costCenter tag, each with 80%/100% actual and 100%-forecast thresholds routed to the owning team via action groups. Non-prod subscriptions get an automated response: a budget breach triggers a Logic App that deallocates dev/test VMs. Anomaly detection is enabled tenant-wide — it pays for itself in week two by catching a misconfigured Synapse autoscale that had spiked ₹8 lakh in three days. Azure Policy denies GPU SKUs outside the approved data-science subscription and requires the four mandatory cost tags.
Rate optimization. After the usage track stabilizes the baseline, the architect buys 3-year Reservations for the steady Azure SQL Business Critical vCores and Cosmos reserved RU/s, and a 1-year Azure savings plan for compute sized from 30-day usage to cover the fluid AKS/App Service/Functions layer (deliberately 1-year because a storefront re-platform is planned). The storefront’s stateless web tier and all CI/CD move to AKS spot node pools with an on-demand floor; analytics batch moves to Spot VMs. Azure Hybrid Benefit is applied to the remaining Windows/SQL IaaS, and all non-prod moves to dev/test subscriptions. Target reservation+SP coverage of the eligible baseline is set at 80%.
Usage optimization. Azure Advisor’s right-sizing recommendations resize 180 oversized VMs and trim three AKS node pools; the product-catalog read API moves to Cosmos autoscale RU/s; a reporting database moves to Azure SQL serverless with auto-pause. DevTest Labs auto-shutdown plus AKS scale-to-min overnight cuts non-prod runtime to ~30% of always-on. A scheduled Azure Resource Graph job finds and deletes 1.1 TB of unattached disks and 60 orphaned public IPs. Log Analytics moves from pay-per-GB to a commitment tier matched to 90 GB/day ingestion.
A FinOps culture. A four-person FinOps Center of Excellence owns tooling and reservation purchasing; each of the eight product teams gets a named cost owner and a per-costCenter budget. Showback dashboards built on the Cost Management → Power BI connector are published weekly; a monthly cost review walks Advisor actions, coverage/utilization, anomalies, and the ₹-per-1,000-orders trend. CO:13 is honored by making auto-shutdown and IaC cost-estimation-in-PR the default, removing a standing toil of manual environment teardown.
Measurable outcome. Over two quarters the monthly bill falls from ₹4.2 crore to ₹3.0 crore (~29%) while order volume grows 18% — so the real win shows in the unit metric: ₹ per 1,000 orders drops from ₹690 to ₹430 (~38%). Reservation+SP coverage reaches 81% at 96% utilization, 100% of spend is tag-allocable, and forecast accuracy lands within ±4%. The CFO now reads a unit-cost trend, not a raw rupee scare.
Going deeper
The sections above are the pillar as you’d apply it. This section is the pillar as you’d defend it in an architecture review — the recommendation map behind the five principles, the cost-accounting nuances that trip up even senior engineers, and the fleet-scale mechanics. If you want the deep mechanics of any one lever, follow the pointers: commitment sizing lives in Azure commitment strategy, the operating-model plumbing in FinOps on Azure, and the pillar-vs-pillar conflicts in Cost optimization without wrecking reliability.
The CO:01–CO:14 recommendations, mapped
The five principles are the lens; the pillar’s actual running checklist is fourteen numbered recommendations. Reviewers cite them by number, so knowing the map turns “we should save money” into “we have a gap on CO:06 and CO:10.” Each recommendation belongs to one principle:
| # | Recommendation | Principle it serves |
|---|---|---|
| CO:01 | Create a culture of financial responsibility | Cost-management discipline |
| CO:02 | Create and maintain a cost model | Cost-efficiency mindset |
| CO:03 | Collect and review cost data | Cost-management discipline |
| CO:04 | Set spending guardrails | Cost-management discipline |
| CO:05 | Get the best rates from providers | Rate optimization |
| CO:06 | Align usage to billing increments | Usage optimization |
| CO:07 | Optimize component costs | Usage optimization |
| CO:08 | Optimize environment costs | Usage optimization |
| CO:09 | Optimize flow costs | Usage optimization |
| CO:10 | Optimize data costs | Usage optimization |
| CO:11 | Optimize code costs | Usage optimization |
| CO:12 | Optimize scaling costs | Usage optimization |
| CO:13 | Optimize personnel time | Cost-management discipline |
| CO:14 | Consolidate | Cost-efficiency mindset |
Notice the shape: one recommendation (CO:05) covers rate, and seven (CO:06–CO:12) cover usage. That is not an accident — it is the framework telling you where the durable, repeatable savings live. Rate is a handful of big, occasional purchasing decisions; usage is a permanent engineering discipline across every component, environment, request flow, data set, code path, and scaling rule you own.
Reading the bill three ways: actual, amortized, and billed
The single most common way a smart engineer misreads an Azure bill is by confusing billed, actual, and amortized cost. They are three different lenses on the same spend, and Microsoft Cost Management exposes them as distinct views:
- Billed cost is what lands on the invoice in a given period. Buy a ₹12-lakh all-upfront 3-year reservation on the 3rd, and ₹12 lakh hits that month’s invoice — a spike that has nothing to do with that month’s consumption.
- Actual cost is Cost Management’s day-by-day accrual view; a monthly-payment reservation shows its instalment, an upfront one shows the lump on purchase day. Good for reconciling to the invoice, terrible for understanding a workload.
- Amortized cost spreads every commitment across its term and re-attributes the benefit to the resources that actually consumed it. That ₹12-lakh reservation becomes a smooth daily charge landing on the VMs it covered.
The rule: do all showback, unit-economics, and trend analysis on amortized cost. If you build cost-per-order on actual cost, your unit metric will lurch every time someone buys a reservation, and you’ll “discover” waste that is really just accounting timing. Reserve billed for cash-flow and invoice reconciliation.
Cost Management internals: scopes, exports, and FOCUS
Cost Management is scoped hierarchically, and where you point a budget, export, or query determines what it can see. On an EA/MCA account the chain runs billing account → billing profile → invoice section → subscription → resource group, with management groups giving you a governance-shaped roll-up across many subscriptions. A budget at a management group sees every child subscription; a budget at a resource group sees only its own resources. Scope mirrors accountability.
There are three ways to get the numbers out, and they scale differently:
- Cost Analysis (portal) — interactive slice-and-dice, great for humans, not for pipelines.
- Scheduled Exports — push a daily/monthly CSV or Parquet drop of the full cost dataset to a storage account. This is the correct path for large tenants and for feeding Power BI or a lakehouse; it does not hit API rate limits the way pulling row-by-row does.
- Cost Details / Query APIs — programmatic pulls for smaller, targeted questions. (The older Consumption Usage Details API still exists but Microsoft steers large or automated extraction to Exports and the Cost Details API.)
The strategic piece is FOCUS — the FinOps Open Cost and Usage Specification — a vendor-neutral schema the FinOps Foundation defined so an Azure bill, an AWS bill, and a GCP bill line up column-for-column. Cost Management can export directly in FOCUS format. If you are (or might become) multi-cloud, exporting FOCUS instead of the Azure-native schema means your showback and unit-economics logic doesn’t have to be rewritten per provider. Full export/Query-API mechanics live in the FinOps on Azure lesson.
The savings levers, ranked — the order of operations
The body gave you the rate table and the usage table. Here is the ladder — the order a principal architect actually reaches for the levers, cheapest-and-safest first, because each rung shrinks the baseline the next rung acts on:
- Kill waste (orphans/zombies). 100% saving on that spend, zero risk, no commitment. Do it today.
- Right-size from telemetry (Advisor). Cut the baseline before you commit a rupee to it.
- Shut down / auto-pause non-prod. Schedules, DevTest Labs auto-shutdown, SQL serverless auto-pause. Non-prod that runs 45 of 168 weekly hours costs ~27% of always-on.
- Autoscale prod. Track load, not peak — close the peak-to-average gap.
- Tier and lifecycle your data. Move blobs across Hot → Cool → Cold → Archive with lifecycle-management rules, delete stale snapshots by policy, and consider reserved capacity for steady storage/Log Analytics. This is the usage lever teams forget because storage feels cheap until it’s petabytes.
- Then buy rate, in this order of “free-money-first”: Azure Hybrid Benefit (if you already own the licence, it’s pure recovery), dev/test pricing for non-prod, reservations for the stable baseline, savings plans for fluid compute, spot for the interruptible burst.
The levers stack multiplicatively. A single production VM can carry a right-sized SKU and Azure Hybrid Benefit and a reservation at once; a horizontally-scaled tier can run a reserved/savings-plan-covered floor plus a spot burst on top. But rate on top of waste (step 6 before steps 1–5) just discounts the waste — which is exactly the “reserving before right-sizing” pitfall.
Commitment vs flexibility, and turning the bill into unit cost
Every rate instrument sits on a discount-versus-flexibility spectrum: reservation (deepest discount, locked to a resource type/region — though instance-size flexibility lets it float across a size group, and you can exchange or refund) → savings plan (commit ₹/hour of compute spend, flexible across SKU/region/eligible compute service) → PAYG (full flexibility, full price) → spot (cheapest of all, but evictable on 30 seconds’ notice). The term axis (1-year vs 3-year) trades discount for how far ahead you’re willing to bet: pick 1-year when a re-platform or migration is on the roadmap. The full sizing math — utilization, coverage, exchanges, break-even — is the commitment strategy lesson’s job.
Unit economics is where all of this becomes a business conversation. The recipe:
- Numerator = amortized cost, allocated to the workload by tag.
- Add a fair share of shared cost — the platform spend nobody tags directly (hub networking, shared AKS system pools, central logging). Spread it proportionally (by that workload’s direct cost, request count, or seats) rather than leaving 20–30% of the bill unallocable.
- Denominator = the thing the business sells: orders, tenants, active users, GB processed, API calls.
- Track the trend, not the snapshot. Unit cost falling while total spend rises is healthy growth; unit cost rising is the real alarm — and it’s invisible if you only watch the total rupee figure.
Zombies and orphans: what still bills after you “turned it off”
The body showed one Resource Graph query for unattached disks. The broader trap is that “off” is not “free.” Deallocating a VM stops compute billing — but its managed disks keep billing, its reserved public IP keeps billing, and a VM merely Stopped from inside the OS (not “Stopped-deallocated” by Azure) is still charged full compute because the capacity is still held for you. Whole categories of resource bill quietly forever with nothing attached to them:
| Zombie / orphan | Still billing because… | Detection |
|---|---|---|
| Unattached managed disk | Storage is provisioned, VM long gone | diskState == "Unattached" |
| Unassociated public IP (Standard) | Standard SKU IPs bill even when idle | ipConfiguration and natGateway both null |
| Orphaned NIC | Left behind after VM delete | virtualMachine property null |
| Empty App Service plan | Plan bills per instance with zero apps | plan with numberOfSites == 0 |
| Idle load balancer / NAT gateway | Hourly charge with no backend | no backend pool members |
| Stale snapshots & old images | Per-GB storage, never pruned | age > retention policy |
| Deallocated VM’s disks & IPs | “I turned it off” — but disks/IPs don’t stop | VM Deallocated, disk still present |
A fleet-wide sweep — run it on a schedule via az graph query and route the output to a work item — turns this from an annual surprise into a Tuesday cleanup:
// Unassociated Standard public IPs across the tenant — billed while idle
Resources
| where type == "microsoft.network/publicipaddresses"
| where sku.name == "Standard"
| where isnull(properties.ipConfiguration) and isnull(properties.natGateway)
| project name, resourceGroup, subscriptionId, location, sku = sku.name
| order by name asc
FinOps maturity: crawl, walk, run
Standing up FinOps is not binary. The FinOps Foundation frames it as Crawl → Walk → Run, and knowing which rung you’re on stops you from buying automation you can’t yet operate:
- Crawl — you can see cost (tags mostly applied, Cost Analysis in use, a few budgets). Reporting is manual and monthly. Most orgs start here and the fastest win is simply raising tag coverage.
- Walk — showback per team, forecast alerts and anomaly detection on, commitments bought from Advisor data, a recurring cost review with owners and actions.
- Run — unit economics headline the exec dashboard, cost gates run in CI/CD, non-prod shuts down by default, chargeback (not just showback) is real, and reservation/savings-plan coverage is actively managed as a portfolio.
The trap is skipping straight to “Run” tooling on a “Crawl” foundation — chargeback fails loudly if 30% of spend is untagged. Advance one rung at a time, and let the Inform → Optimize → Operate loop from the FinOps culture section spin faster as you climb.
Practice challenges
Six exercises, escalating from beginner to advanced. Try each before opening the solution. No live Azure subscription is required — the commands are real and schema-correct, and the reasoning items are the ones you’ll actually defend in a review.
1. (Beginner) Pull a real price. Use the Azure Retail Prices API (no auth) to find the pay-as-you-go price and unit of measure for a D4s v5 VM in the centralindia region. Why does the unit of measure matter?
<details> <summary>Solution</summary>
curl -s "https://prices.azure.com/api/retail/prices?\$filter=serviceName eq 'Virtual Machines' and armRegionName eq 'centralindia' and armSkuName eq 'Standard_D4s_v5' and priceType eq 'Consumption'" \
  | jq -r '.Items[] | "\(.meterName): \(.retailPrice) \(.currencyCode)/\(.unitOfMeasure)"'
Why: the price is quoted per hour, so a cost model must multiply by hours-in-use (up to 730/month), not treat it as a flat monthly figure. Filtering on priceType eq 'Consumption' excludes the Reservation/Spot rows the API also returns for the same SKU — forget that and you’ll average three different prices together.
</details>
2. (Beginner) A budget that warns before it’s too late. Write a Microsoft.Consumption/budgets resource (Bicep) for a monthly subscription budget of ₹5,00,000 that alerts at 80% of actual spend and 100% of forecast spend. Why include the forecast threshold?
<details> <summary>Solution</summary>
resource budget 'Microsoft.Consumption/budgets@2023-05-01' = {
  name: 'sub-monthly-budget'
  properties: {
    category: 'Cost'
    amount: 500000
    timeGrain: 'Monthly'
    timePeriod: {
      startDate: '2026-09-01T00:00:00Z'
      endDate:   '2027-09-01T00:00:00Z'
    }
    notifications: {
      actual80: {
        enabled: true
        operator: 'GreaterThanOrEqualTo'
        threshold: 80
        thresholdType: 'Actual'
        contactEmails: [ 'finops@example.com' ]
      }
      forecast100: {
        enabled: true
        operator: 'GreaterThanOrEqualTo'
        threshold: 100
        thresholdType: 'Forecasted'
        contactEmails: [ 'finops@example.com' ]
      }
    }
  }
}
Why: an actual alert fires after you’ve already spent 80% — useful, but reactive. The Forecasted threshold uses Cost Management’s month-end prediction, so it warns you around mid-month that you’re on track to blow the budget, while there’s still time to act. A budget with only actual thresholds is a rear-view mirror.
</details>
3. (Intermediate) Usage-first or rate-first? You inherit 100 production VMs averaging 8% CPU. Finance wants to buy a 3-year reservation this week to “lock in savings.” What do you do first, and why?
<details> <summary>Solution</summary>
Right-size first, then reserve the smaller baseline. At 8% CPU these VMs are grossly oversized; run Azure Advisor’s right-sizing recommendations, drop or resize the fleet (likely to a fraction of the vCPUs), let it stabilize for a couple of weeks, then buy a reservation sized from the new baseline.
Why: a reservation is a 3-year commitment to a quantity of capacity. Reserve the oversized fleet and you’ve locked in the waste at a discount for three years — the single most expensive mistake in the pillar. Usage optimization shrinks the baseline; rate optimization discounts whatever baseline remains. Order matters: usage first, then rate. </details>
4. (Intermediate) Hunt an orphan class. Write a Resource Graph (KQL) query that finds orphaned network interfaces — NICs left behind after their VM was deleted — across the tenant. Why can’t you just delete every NIC the query returns without checking?
<details> <summary>Solution</summary>
Resources
| where type == "microsoft.network/networkinterfaces"
| where isnull(properties.virtualMachine)
| project name, resourceGroup, subscriptionId, location,
          hasPrivateEndpoint = isnotnull(properties.privateEndpoint)
| order by name asc
Why: a NIC with a null virtualMachine is usually orphaned — but a NIC attached to a private endpoint (or a not-yet-attached NIC in an active IaC deployment) also has no VM and is not waste. Always project the disqualifying signals (here privateEndpoint) and tag-or-review before you delete; blind deletion of “orphans” is how you take down a private-link data path.
</details>
5. (Advanced) Growth or waste? A workload’s amortized cost rose from ₹40,00,000 to ₹48,00,000 month-over-month (+20%). Orders grew from 5.0M to 8.0M in the same period. Its ₹ per 1,000 orders — is this a problem? Show the math.
<details> <summary>Solution</summary>
- Last month: ₹40,00,000 ÷ (5,000,000 / 1,000) = ₹800 per 1,000 orders.
- This month: ₹48,00,000 ÷ (8,000,000 / 1,000) = ₹600 per 1,000 orders.
Unit cost fell 25% even though the total bill rose 20%. This is healthy growth, not waste — you’re serving 60% more orders for 20% more money.
Why: the raw rupee figure (+20%) looks alarming and would trigger a cost panic if that’s all you watched. The unit-economics lens on amortized cost (never actual — a reservation purchase would distort it) is the only view that separates “we’re growing efficiently” from “we’re bleeding.” Headline the unit trend so leadership can approve spend that earns its keep. </details>
6. (Advanced) Design the commitment mix. An estate has: (a) a steady Azure SQL Business Critical database running 24/7; (b) an AKS compute layer that will be re-platformed in ~14 months; © a stateless web tier that scales horizontally with load; (d) Windows Server IaaS where you already own licences with Software Assurance. Assign the right rate instrument (and term) to each, and justify.
<details> <summary>Solution</summary>
| Workload | Instrument | Term | Why |
|---|---|---|---|
| (a) Steady SQL BC | Reservation (reserved vCores) | 3-year | Stable, specific, 24/7 — deepest discount, low change risk. |
| (b) AKS, re-platform in 14 mo | Savings plan for compute | 1-year | Flexible across SKU/region as it evolves; short term because change is coming — don’t 3-year-commit shape you’re about to abandon. |
| © Stateless web burst | Spot (with a small on-demand/reserved floor) | n/a | Interruptible and horizontally scalable — tolerates 30s eviction; pair with a guaranteed floor. |
| (d) Windows IaaS you licence | Azure Hybrid Benefit (stacks on a reservation) | — | You already paid for the licence via Software Assurance; AHB strips the Windows licence cost and stacks with a reservation on the same VM. |
Why: each instrument matches the workload’s commitment-risk profile. Deep-but-rigid reservations go to stable capacity; flexible savings plans (short term) go to changing compute; spot goes to interruptible work; and Hybrid Benefit is free recovery you layer on top. Matching instrument to risk — not buying one instrument for everything — is the whole game. </details>
Deliverables & checklist
Common pitfalls
- Reserving before right-sizing. Buying a 3-year reservation against an oversized fleet locks in waste at a discount. Avoid it: always run the usage track (right-size, consolidate, settle the baseline) before the rate track, and size commitments from 30/60-day Advisor data, not last year’s peak.
- Budgets with no action. A budget that only emails an inbox at 100% is documentation, not a guardrail. Avoid it: use forecast thresholds for early warning and wire at least the non-prod breach to an automated response (Logic App / runbook that deallocates), so the system reacts in minutes.
- Measuring rupees instead of unit cost. A bill that rose because volume tripled looks identical to runaway waste if you only watch the total. Avoid it: headline a unit-economics KPI (₹ per order/transaction/tenant) so growth and waste are distinguishable and you can justify increasing spend that earns its keep.
- Untagged, unallocable spend. If 30% of the bill has no owner, no team is accountable and showback is fiction. Avoid it: enforce a tag taxonomy with Azure Policy (deny-or-append), and treat allocation coverage as a tracked KPI.
- Set-and-forget commitments. Reservations and savings plans expire and drift out of fit as workloads change; unused commitment is pure loss. Avoid it: track utilization and coverage monthly, enable Advisor utilization alerts, and review renewals before they lapse.
- One-off cost sprints. A single cleanup saves money once, then the estate re-bloats because nothing changed operationally. Avoid it: stand up the FinOps cadence (monthly review, owners, automated toil reduction) so optimization is continuous, per the monitor and optimize over time principle.
Common beginner mistakes
These are misconceptions — wrong mental models a newcomer brings in — distinct from the architectural Common pitfalls above. Each is the belief, why it’s wrong, and the model to replace it with.
-
“A budget will stop my spending when I hit it.” No. An Azure budget is a smoke alarm, not a circuit breaker — on its own it only alerts. Spend continues past 100% unless you wired the alert to an action group that runs automation (deallocate, scale down). Right model: a budget notifies; enforcement is something you build on top of it.
-
“Reservations tie me to one exact VM — if I resize, I lose the discount.” No. Instance size flexibility lets a VM reservation apply across a whole size group in the same series, and you can exchange or refund a reservation. Right model: you commit to a quantity of compute in a family, not to one named machine.
-
“A savings plan covers my whole bill.” No. Azure savings plans for compute discount compute services (VMs, App Service, Container Instances, Functions Premium, and similar) — not storage, networking, bandwidth, or databases. Right model: savings plan = a compute-spend commitment; your databases and Cosmos RU/s need reservations, a separate instrument.
-
“Spot VMs are just cheaper VMs.” No. Spot runs on Azure’s spare capacity and can be evicted on 30 seconds’ notice when that capacity is reclaimed. Right model: spot is a seat you must be willing to give up instantly — only for interruptible, stateless, or batch work, always with an on-demand floor if you need a guarantee.
-
“I stopped the VM, so I’m not paying for it.” Usually wrong twice over. A VM Stopped from inside the guest OS is still “Stopped,” not “Deallocated” — Azure still holds (and bills) the compute. And even a properly deallocated VM keeps billing for its managed disks and reserved public IP. Right model: only “Stopped (deallocated)” halts compute charges, and disks/IPs bill until you delete them.
-
“Cheapest SKU everywhere means we’re cost-optimized.” No. Under-provisioning causes throttling, incidents, and firefighting that cost far more than the SKU you saved. Right model: the pillar optimizes value per rupee against the SLO — sometimes the cost-optimal choice is to spend more on the workload that earns revenue.
-
“Tagging is a nice-to-have I’ll backfill later.” No. Untagged spend is unallocable — you can’t do showback, and no team can be held accountable for a number it can’t see. Retro-tagging thousands of resources is miserable. Right model: enforce the tag taxonomy at creation time with Azure Policy (deny-or-append) from day one.
Glossary
- Well-Architected Framework (WAF) — Microsoft’s set of five pillars (Reliability, Security, Cost Optimization, Operational Excellence, Performance Efficiency) for reviewing and improving Azure workloads.
- Cost Optimization pillar — the WAF pillar whose goal is maximum business value per rupee spent — not minimum spend. Expressed as five design principles and recommendations CO:01–CO:14.
- CO:01–CO:14 — the fourteen numbered recommendations in the Cost Optimization checklist; reviewers reference gaps by number (e.g. “we’re weak on CO:06”).
- PAYG (pay-as-you-go) — on-demand pricing with no commitment; the most flexible and most expensive way to run steady capacity.
- Reservation (Reserved Instance) — a 1- or 3-year commitment to a specific resource type/region in exchange for a deep discount; the least flexible, deepest-discount rate instrument.
- Azure savings plan for compute — a 1- or 3-year commitment to a fixed hourly compute spend, flexible across SKU, region, and eligible compute services; less discount than a reservation, more flexibility.
- Spot — heavily discounted spare capacity that Azure can evict on ~30 seconds’ notice; for interruptible, stateless, or batch workloads.
- Azure Hybrid Benefit (AHB) — reuse of Windows Server / SQL Server licences you already own (with Software Assurance) to strip the licence cost from Azure compute; stacks on top of reservations and savings plans.
- Dev/test pricing — discounted rates (and stripped Windows/SQL licence cost) for non-production subscriptions.
- Right-sizing — resizing or dropping a resource to match actual demand, driven by real CPU/memory/network telemetry (usually via Azure Advisor).
- Autoscale — automatically adding and removing capacity to track load instead of provisioning for peak; includes scale-to-zero.
- Auto-shutdown / deallocate — turning resources off when idle (e.g. dev/test VMs overnight). Deallocated stops compute billing; merely stopped does not.
- Orphaned / zombie resource — a resource that still bills with nothing using it (unattached disk, unassociated public IP, empty App Service plan, orphaned NIC).
- Budget — a Cost Management target amount at a scope, with alert thresholds; it notifies, it does not cap spend.
- Anomaly detection — Cost Management’s statistical detection of unexpected spend spikes, independent of any budget threshold.
- Azure Advisor — the recommendation engine whose Cost category proposes right-sizing, shutdown, and commitment purchases from your real usage.
- Microsoft Cost Management — Azure’s native cost visibility and control surface: cost analysis, budgets, anomaly detection, and exports.
- Actual vs amortized cost — actual is day-by-day accrual (commitments spike on purchase); amortized spreads commitments across their term and re-attributes them to the resources that used them. Do unit economics on amortized.
- Billed cost — what appears on the invoice for a period; used for cash-flow and invoice reconciliation, not workload analysis.
- Coverage — the percentage of eligible spend that a commitment (reservation/savings plan) is discounting.
- Utilization — the percentage of a commitment you actually consume; unused commitment is pure loss.
- Showback / chargeback — reporting each team’s cost back to it (showback), or actually billing it internally (chargeback); both require complete tagging.
- Tag / tagging taxonomy — key–value metadata (e.g.
costCenter,owner,env,application) that makes every rupee allocable; enforced with Azure Policy. - FinOps — the operating model (FinOps Foundation: Inform → Optimize → Operate) that gives engineers cost visibility and accountability so optimization is continuous.
- FOCUS (FinOps Open Cost and Usage Specification) — a vendor-neutral cost-data schema; Cost Management can export in FOCUS format so multi-cloud bills line up.
- Unit economics / cost-per-transaction — cost expressed per business unit (₹ per order/tenant/user); falling unit cost while total rises signals healthy growth.
- Retail Prices API — a public, unauthenticated Azure API (
prices.azure.com) returning current list prices; used to seed cost models with real numbers. - TCO calculator — Microsoft’s Total Cost of Ownership tool for comparing Azure against on-premises.
- Azure Resource Graph (KQL) — a fast, tenant-wide query service (Kusto Query Language) for inventory queries like fleet-wide orphan hunts.
- RU/s (request units per second) — Cosmos DB’s provisioned throughput unit; reservable, and settable to autoscale/serverless for usage optimization.
- Egress — outbound data transfer (cross-region, cross-zone, internet); a frequently-forgotten billable meter in cost models.
- Storage tiers — Blob access tiers (Hot, Cool, Cold, Archive) with descending storage cost and ascending access cost; moved automatically by lifecycle-management policies.
What’s next
Part 4 of the Azure Well-Architected Framework series turns to Operational Excellence — DevOps practices, observability, safe deployment, and the operating model that keeps these cost, reliability, and security gains running in production.