In a nutshell
Troubleshooting Azure is not about memorising error codes — it is triage. Think of how an emergency-room doctor works: they do not open the chest because you walked in with chest pain. They rule out the cheap, common causes first (indigestion? a pulled muscle?) before the expensive, dangerous ones, running the least invasive test that eliminates the most possibilities at each step. A senior Azure engineer does exactly that with a failing system: instead of restarting the VM and regenerating the key and adding an Owner role all at once, they ask one ordered question at a time — can it authenticate? can the packet arrive? does the name resolve? is the resource healthy? is it the app? — and read a meter (a read-only diagnostic) before touching a wire.
That ordered questioning is the whole lesson. You will learn an eight-step loop that turns “it’s broken and I don’t know why” into a short path to the real cause, plus five symptom → cause → one diagnostic → fix playbooks for the domains that break most: networking, VMs, identity, storage, and App Service.
Level: Intermediate · Time: ~24 min · You’ll need a working mental model of subscriptions, VNets/NSGs, VMs, Microsoft Entra ID + RBAC, and storage accounts (all from earlier lessons — the full prerequisites and outcomes are in the two sections just below). After this you can localise almost any Azure failure to a single layer in under a minute, and reach for the right read-only tool instead of guessing.
There is a particular kind of panic that hits when something in Azure breaks in production. A web app starts returning 500s; a virtual machine you could reach yesterday refuses RDP; a perfectly valid storage request comes back 403; a colleague who definitely has access is told they don’t. The temptation is to start clicking — toggle a setting, restart the VM, regenerate a key, add an Owner role assignment — and hope. That is gambling, not troubleshooting, and it is how a five-minute incident becomes a two-hour one with three new misconfigurations layered on top of the original fault.
This lesson teaches the opposite habit: a repeatable method that turns “it’s broken and I don’t know why” into a short, ordered set of questions that converge on the real cause — plus per-domain playbooks (networking, VM, identity, storage, App Service) mapping a symptom to its likely cause, the one diagnostic that confirms it, and the fix. A senior engineer is not someone who memorises every error code; it is someone who can take an unfamiliar failure and narrow it down calmly. By the end you will have that instinct, plus a reference to keep open during an incident.
This is a methodology lesson — it teaches how to think. The next lesson, The Azure Diagnostics Toolkit, teaches the tools (Network Watcher, Resource Health, boot diagnostics, serial console, KQL) hands-on. Here we cover enough of each tool to act; there we go deep.
Learning objectives
By the end of this lesson you can:
- Apply an eight-step troubleshooting method — reproduce → isolate the layer → compare config vs desired → inspect logs and metrics → form and test a hypothesis → fix → verify → prevent — to any Azure incident.
- Isolate the failing layer quickly (identity? network? the resource itself? the application?) instead of fixing the wrong thing.
- Diagnose the most common networking failures using effective security rules, effective routes, next hop and DNS resolution.
- Diagnose a VM that won’t boot or won’t accept RDP/SSH using boot diagnostics, the serial console and run-command.
- Diagnose identity and RBAC failures using sign-in logs, Check access / effective permissions and Conditional Access report-only mode.
- Diagnose storage
403/auth and App Service5xxfailures, and read a decision tree that routes a symptom to the right playbook. - Capture each fix as a prevention (an alert, a policy, a runbook) so the same incident does not recur.
Prerequisites & where this fits
You should already understand Azure’s core building blocks: subscriptions and resource groups, virtual networks and NSGs, virtual machines, Microsoft Entra ID and RBAC, and storage accounts — all covered in earlier lessons. You needn’t be an expert in any; troubleshooting is precisely the skill of reasoning about a system you only partly understand. This is Lesson G7, the first of two in the Operations & Troubleshooting module. It pairs with Azure Service Health, Advisor & Resource Graph (is it me or is it Azure?) and leads into the diagnostics-tools deep dive. Everything here maps to AZ-104, where “monitor and troubleshoot Azure resources” is an exam domain.
The troubleshooting mindset: eight steps that always work
Tools change; the method does not. Whether you are debugging a 2003-era on-prem server or a 2026 Azure landing zone, the same loop applies. Internalise these eight steps and you will never again be the person frantically toggling settings.
| # | Step | The question it answers | Why it matters |
|---|---|---|---|
| 1 | Reproduce | Can I make it fail on demand? | A fault you can’t reproduce, you can’t confirm you’ve fixed. Pin down exactly who, what, where, when. |
| 2 | Isolate the layer | Which layer is actually failing — identity, network, the resource, or the app? | This is the master move. Most wasted time comes from fixing the wrong layer. |
| 3 | Config vs desired | Does the current configuration match what I intended? | Most Azure incidents are a config drift or a recent change, not a platform fault. |
| 4 | Inspect logs & metrics | What does the evidence say? | Logs and metrics are ground truth. Read them before theorising, not after. |
| 5 | Hypothesise & test | What’s my single best guess, and what one test confirms or kills it? | One variable at a time. A test that can only “succeed” proves nothing. |
| 6 | Fix | What is the smallest change that addresses the root cause? | Fix the cause, not the symptom; change one thing so you know what worked. |
| 7 | Verify | Is it actually fixed — from the user’s perspective? | Re-run the reproduction from step 1. “It looks fine in the portal” is not verification. |
| 8 | Prevent | How do I make sure this never silently recurs? | Turn the fix into an alert, a policy, a runbook, or a test. This is what makes you senior. |
A few principles make the loop sharper:
- Change one thing at a time. Flip three settings and it starts working, and you’ve learned nothing — and maybe introduced two new problems. Revert speculative changes that didn’t help.
- Read before you write. Every diagnostic in this lesson is read-only — it inspects state without changing it. Exhaust the read-only checks before you touch anything.
- Believe the evidence, not the assumption. “But it should work” is the most expensive phrase in operations. The effective rules, the actual logs, the real DNS answer — those are reality.
- Ask “what changed?” first. The Azure Activity Log is a per-subscription audit of every control-plane write (who deployed, modified or deleted what, and when); a fault that started at 14:05 next to a deployment at 14:03 is rarely a coincidence.
Isolating the layer — the master skill
Step 2 deserves its own model because it is where time is won or lost. Almost every Azure failure lives in one of five layers. Ask the questions top to bottom and you will usually localise the fault in under a minute:
| Layer | “Is the problem here?” — quick test | Typical symptoms |
|---|---|---|
| Identity / authorization | Can the caller authenticate, and do they have the role for this action? | AuthorizationFailed, 403 on the control plane, “you don’t have access”, sign-in blocked |
| Network / connectivity | Can the packet physically reach the target on the right port? | Timeouts, “connection refused”, can’t RDP/SSH, intermittent drops |
| DNS / name resolution | Does the name resolve to the IP you expect? | “host not found”, connecting to the public IP of a private resource |
| The resource / platform | Is the resource itself healthy and running? | VM won’t boot, service degraded, 503 from a stopped backend |
| The application | Is the code/config inside the resource the problem? | App-level 500, stack traces, bad connection string, failed dependency |
The trick is to test the cheapest, most likely layer first and to bisect: if a request fails from one machine but succeeds from another, the difference between them is your fault. If the same request fails everywhere, the problem is central (the resource or its config), not the caller.
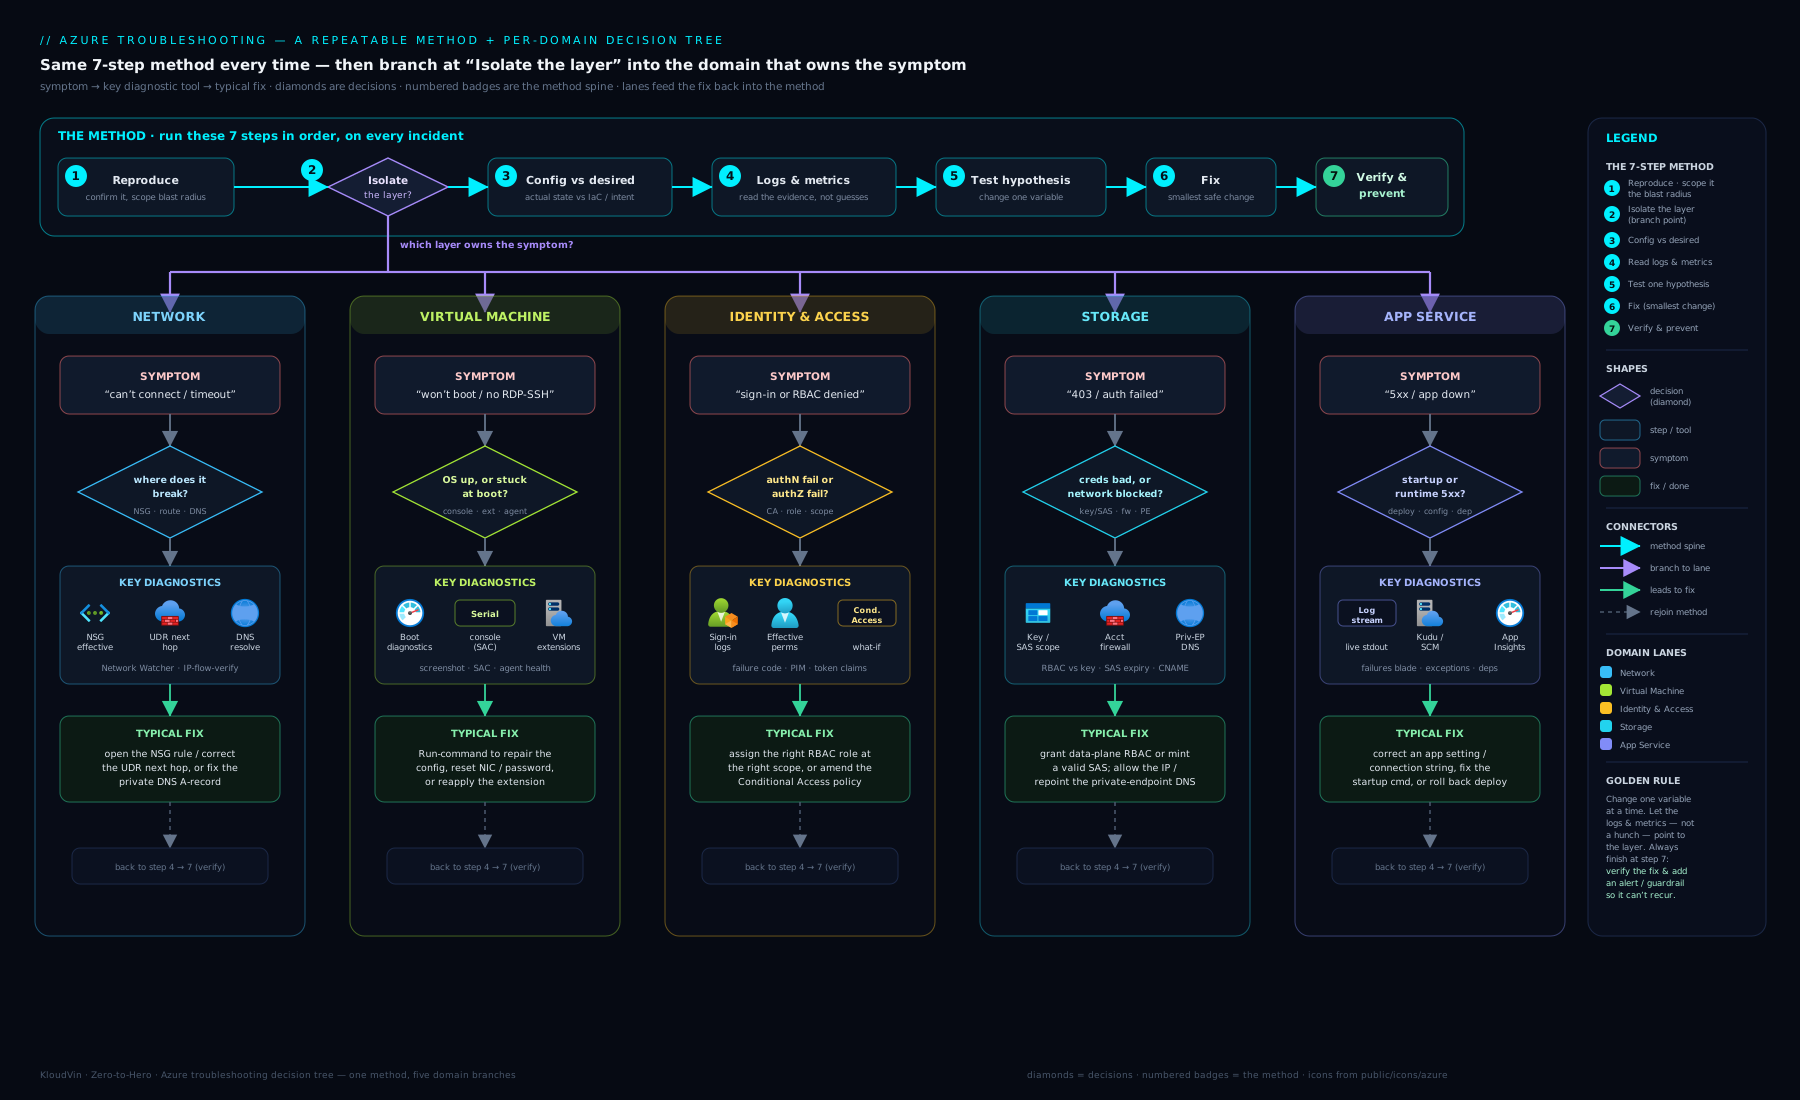
The decision tree above is the same logic rendered as a flowchart: start from the symptom, ask “can it authenticate?”, then “can the packet arrive?”, then “does the name resolve?”, then “is the resource healthy?”, and finally “is it the app?” — branching to the matching playbook below at each point.
Networking playbook: “I can’t connect to it”
Connectivity is the single biggest source of Azure incidents, and almost all come down to four things: an NSG (network security group) rule blocking traffic, a UDR (user-defined route) sending the packet somewhere unexpected, DNS resolving the wrong address, or the target service not listening. Beginners stare at the VM; the fix is to inspect the effective configuration Azure actually applied, because NSGs combine at subnet and NIC level and routes combine system + BGP + UDR.
Three Network Watcher checks resolve most cases. IP flow verify answers “would an NSG allow this exact 5-tuple (source IP, dest IP, port, protocol, direction)?” and names the deciding rule. Next hop answers “where does a packet to this destination actually go — internet, VNet, a virtual appliance, or a black hole?”. Effective security rules and effective routes (on the NIC) show the merged, real ruleset rather than what you think you configured.
| Symptom | Likely cause | Diagnostic step | Fix |
|---|---|---|---|
| Connection times out (no response) | NSG denying inbound on the port | Network Watcher → IP flow verify for the dest port; or read effective security rules on the NIC | Add/adjust an inbound Allow rule at the right priority (lower number wins); narrow source to your IP, not Any |
| Connection refused (fast reject) | The service isn’t listening / wrong port / firewall inside the OS | Confirm the app is bound (ss -tlnp / netstat); check the OS firewall |
Start the service / bind the right port; open the host firewall (Windows Firewall, ufw) |
| Traffic silently disappears | A UDR forces 0.0.0.0/0 to a firewall/NVA that drops or isn’t up |
Network Watcher → Next hop for the destination | Fix the route table, ensure the NVA/Azure Firewall is healthy, or correct the next-hop type |
| Reaches the wrong server, or “host not found” | DNS resolving to a stale/public IP | nslookup/dig the name from the client; check the VNet’s DNS servers and any Private DNS zone |
Point the VNet at the right DNS; fix the A record / Private DNS zone link |
| Works from one subnet, fails from another | NSG/route differs, or peering lacks AllowForwardedTraffic/gateway transit |
Compare effective rules/routes on both NICs; check peering settings | Align the NSG/UDR; enable the required peering options |
| Can’t reach a PaaS resource over private endpoint | Private DNS not resolving the privatelink name; still using public IP | nslookup the resource FQDN — it should return a private IP |
Link the privatelink.* Private DNS zone to the VNet; add the A record |
| Intermittent outbound failures under load | SNAT port exhaustion on the outbound path | Check Load Balancer/NAT gateway SNAT metrics | Add a NAT gateway for deterministic egress; reuse connections in the app |
| Can’t RDP/SSH at all from the internet | Management port exposed-then-blocked, or you should use Bastion | IP flow verify on 3389/22; check for a deny rule | Connect via Azure Bastion (no public IP needed); see the Bastion lesson |
A grounding example: a VM is unreachable on port 443. IP flow verify returns Allow, rule AllowHTTPS — so the NSG is not the problem; you’ve eliminated a whole layer in one command. Next hop returns VirtualAppliance pointing at a firewall that’s showing unhealthy. There’s your cause, found in two read-only checks, no guessing.
Virtual machine playbook: “it won’t boot / I can’t log in”
When a VM misbehaves, separate two very different failures: the VM won’t start (a platform/OS-boot problem) versus the VM is running but you can’t connect (almost always network or in-guest config — see the networking playbook for the connectivity half). Two tools are your superpowers: boot diagnostics (a platform-captured screenshot and serial log of the boot, so you can see a kernel panic, a Windows recovery screen or a stuck fsck without logging in) and the serial console (a keyboard into the VM’s serial port via the platform, working with no network, NSG path or RDP/SSH). For changes from outside the OS, run-command runs a script as administrator/root over the control plane — no SSH required.
| Symptom | Likely cause | Diagnostic step | Fix |
|---|---|---|---|
| VM stuck / won’t boot | OS corruption, bad fstab, failed update, full OS disk | Boot diagnostics screenshot + serial log | Serial console to edit fstab/grub; or attach OS disk to a rescue VM and repair |
| Provisioning/agent timeout, VM “running” but unmanageable | Azure VM Agent stopped or unhealthy | Check VM Agent status; review extension provisioning state | Restart the agent (serial console / run-command); reinstall the agent |
| Can’t RDP (Windows) | NSG, or RDP service/firewall in-guest, or expired credentials | IP flow verify 3389; boot diagnostics for a logon screen; run-command | Fix NSG; via run-command re-enable RDP / reset firewall; Reset password (VMAccess extension) |
| Can’t SSH (Linux) | NSG, sshd down, bad authorized_keys/permissions |
IP flow verify 22; serial console login | Restart sshd; fix key/permissions; Reset SSH key (VMAccess extension) |
| Boots then reboots in a loop | Failed driver/update, kernel mismatch, disk pressure | Serial log across reboots | Boot previous kernel via serial console; roll back the update |
Extension fails (ProvisioningState/failed) |
Script error, dependency, network to download source | Read extension status message; check /var/log/azure or C:\WindowsAzure\Logs |
Fix the script/dependency; remove and re-add the extension |
| VM unexpectedly deallocated, or “out of capacity” on start | Spot eviction, or no capacity in the size/zone | Activity Log; check eviction events | Use a different size/zone; for steady workloads avoid spot; consider capacity reservations |
| Performance cliff (slow disk) | Hitting disk IOPS/throughput cap or VM cap | VM/disk metrics (IOPS, throughput, credits) | Resize disk tier (e.g. Premium SSD v2), enable bursting, or resize the VM |
Note the deallocate vs stop trap: stopping a VM from inside the OS leaves it allocated — you keep paying for compute. Only deallocating (portal “Stop” or az vm deallocate) releases the compute charge. A VM that “won’t start” after a stop is sometimes just hitting a capacity constraint on reallocation.
Identity & RBAC playbook: “access denied”
Authorization failures split into two questions, and conflating them wastes time. First: can the principal sign in at all (authentication)? A blocked or challenged sign-in is Microsoft Entra ID, usually Conditional Access. Second: once signed in, are they allowed this specific action (authorization)? That’s RBAC — the AuthorizationFailed / 403 on a control-plane operation. Different tools answer each.
For authentication, the Entra sign-in logs are definitive: every sign-in records success/failure, the failure reason, the IP and device, and which Conditional Access policy applied and what it required (MFA, compliant device, block). For authorization, Check access on the resource shows exactly which roles a principal has at that scope — remembering RBAC is additive and inherited down management group → subscription → resource group → resource, and a Deny assignment or Azure Policy can override an Allow.
| Symptom | Likely cause | Diagnostic step | Fix |
|---|---|---|---|
AuthorizationFailed / 403 on a portal action |
Missing RBAC role at this scope | Resource → Access control (IAM) → Check access for the user | Assign the least-privilege role (e.g. Contributor on the RG, not Owner on the sub) |
| Has a role but still denied | Deny assignment, Azure Policy deny, or scope mismatch |
Check access shows the deny; review Policy compliance | Adjust the policy/exemption; assign the role at the correct scope |
| Sign-in blocked entirely | Conditional Access policy (location, device, risk) | Entra → Sign-in logs → the entry’s Conditional Access tab | Adjust the CA policy or satisfy it (trusted location, compliant device); test in report-only first |
| Prompted for MFA unexpectedly / can’t complete MFA | CA requiring MFA; no registered method | Sign-in logs → CA result; check Authentication methods | Register a method; scope/adjust the CA policy; check number-matching |
App/script gets 401/403 (not a human) |
Managed identity not assigned the role, or wrong identity used | Confirm the identity’s role with Check access; verify the token’s oid/appid |
Grant the managed identity the role; ensure the app requests the right identity |
| Role assignment “done” but no effect | RBAC propagation delay, or assigned at wrong scope | Re-check access; wait a few minutes; sign out/in for a fresh token | Re-assign at correct scope; refresh the token (token caches old claims) |
| Guest (B2B) user can’t access | External collaboration / CA settings; not invited to resource | Sign-in logs for the guest; Check access | Fix invitation/cross-tenant settings; assign the role to the guest |
| PIM-eligible admin lacks access right now | Role is eligible, not active | Check PIM assignments | Activate the eligible role (PIM) for the session |
A common trap: someone is “definitely an Owner” but gets AuthorizationFailed. Check access reveals they’re Owner on a different resource group, or their role is eligible via PIM and not activated, or a cached token predates the assignment. Read the evidence; don’t escalate privileges to paper over a scope mistake.
Storage playbook: “403 / authentication failed”
Storage 403s feel mysterious because a request passes four independent gates, and any one returns 403. In order: firewall (does the network allow this caller?), authorization (is the credential — account key, SAS, or Entra/RBAC — valid and sufficient?), request validity (SAS expired, clock skewed, permission missing?), and for private access, DNS (does the endpoint resolve to the private endpoint?). Diagnose in that order, because a network block and an auth failure look identical from the client.
| Symptom | Likely cause | Diagnostic step | Fix |
|---|---|---|---|
403 AuthorizationFailure from an allowed identity |
Storage firewall blocks the caller’s network | Storage → Networking: is it “selected networks”? Is the caller’s IP/VNet listed? | Add the IP/subnet (service or private endpoint), or use a trusted-services exception |
403 AuthenticationFailed with account key |
Wrong/rotated key, or clock skew on the client | Verify the key; check the client’s time is in sync | Use the current key (prefer Entra auth over keys); fix NTP |
403 from a SAS URL |
SAS expired, wrong permissions (e.g. read-only used for write), or wrong signed resource/IP | Decode the SAS: check se (expiry), sp (perms), sip, spr |
Reissue with correct perms/expiry; prefer user-delegation SAS (Entra-backed) |
403 doing data ops with RBAC |
Has Reader (control plane) but not a data role |
Check access: look for Storage Blob Data roles | Assign Storage Blob Data Reader/Contributor — control-plane roles don’t grant data access |
| Connects to the public endpoint despite a private endpoint | Private DNS not resolving the privatelink name |
nslookup account.blob.core.windows.net — expect a private IP |
Link the privatelink.blob.core.windows.net zone to the VNet; add the A record |
409/PublicAccessNotPermitted on anonymous blob read |
Anonymous/public access disabled (the secure default) | Check allow blob anonymous access setting | Use SAS or Entra auth; only enable anonymous if truly required |
Intermittent throttling (503/500) |
Hitting account scalability targets (IOPS/egress) | Storage metrics (transactions, throttled requests) | Spread load, use multiple accounts, or move to premium; back off and retry |
The single most common storage 403: an identity has Reader on the account and tries to read a blob, and is denied. Reader is a control-plane role — it lets you see the account exists. Reading data needs a Storage Blob Data role. Control plane and data plane are separate authorization systems — heavily tested, heavily tripped over.
App Service playbook: “the app returns 5xx”
App Service hides the VM, so debugging shifts to streaming logs, the Kudu/SCM advanced-tools site, and Application Insights. Distinguish platform 5xx from application 5xx: a 503 often means the app failed to start, was stopped, or is throttled/cold; a 500 is usually your code throwing. The fastest first move is Log stream (live stdout/stderr and web-server logs) to see the actual exception or startup error rather than guess from the status code.
| Symptom | Likely cause | Diagnostic step | Fix |
|---|---|---|---|
503 Service Unavailable |
App failed to start, is stopped, or plan is overloaded/cold | Log stream; check the app is Running; Resource Health | Fix the startup error (logs); scale up/out; enable Always On to avoid cold idle |
500.30 / container won’t start |
Bad startup command, missing dependency, wrong port | Log stream + Kudu (/api/logs/docker); check the listening port |
Correct startup command/port; set WEBSITES_PORT; fix dependency |
App 500 with stack trace |
Application code exception | Application Insights → Failures; Log stream | Fix the code/config; add the missing app setting |
| Works locally, fails in Azure | Missing app setting/connection string, or runtime version mismatch | Compare Configuration app settings; check stack version | Add settings (they become env vars); pin the correct runtime version |
403/401 to a downstream resource |
App’s managed identity lacks the role, or Key Vault reference broken | Check access on the target; check Key Vault reference status | Grant the identity the role; fix the @Microsoft.KeyVault(...) reference |
| Slow / timeouts after deploy | Cold start, under-scaled plan, or SNAT exhaustion to a DB | App Insights performance; check SNAT/connection metrics | Always On + scale; reuse connections; integrate a NAT gateway/VNet |
502 Bad Gateway intermittently |
Worker crashing/recycling, or downstream timeout | Log stream during the failure; check process restarts | Fix the crash; raise downstream timeouts; right-size the plan |
| Custom domain / TLS errors | Missing binding, expired cert, or DNS not pointing at the app | Check Custom domains + binding; nslookup the CNAME |
Fix the binding/cert; correct the CNAME/A record |
Tie this to deployments: many App Service 5xxs appear immediately after a deploy. The robust pattern is deployment slots with a swap — warm up the new version on a staging slot, verify, then swap into production, so a bad build never takes the live site down (and swap-back is instant rollback). Covered in Secure, zero-downtime deployments on App Service.
Hands-on lab: diagnose a deliberately broken VM
In this lab you will create a fault on purpose, then use the method to find and fix it. We’ll build a small VM, lock its NSG so SSH is blocked, diagnose the block with Network Watcher (never touching the VM), then fix it. Everything uses standard/B-series resources and is deleted at the end. Run it in Cloud Shell (Bash).
1. Set up variables and a resource group.
RG=rg-ts-lab
LOC=eastus
az group create -n $RG -l $LOC -o table
2. Create a small Linux VM (this also creates a VNet, subnet, NIC, public IP and a default NSG).
az vm create \
  -g $RG -n vm-ts \
  --image Ubuntu2204 \
  --size Standard_B1s \
  --admin-username azureuser \
  --generate-ssh-keys \
  --public-ip-sku Standard \
  -o table
Note the publicIpAddress in the output. Confirm SSH works (answer yes to the host-key prompt, then exit):
ssh azureuser@<publicIpAddress> 'echo connected; exit'
3. Break it. Add a high-priority rule that denies inbound SSH — simulating “someone tightened the firewall and now I can’t get in”. The NSG is vm-tsNSG by default:
az network nsg rule create \
  -g $RG --nsg-name vm-tsNSG \
  -n DenySSH --priority 100 \
  --direction Inbound --access Deny \
  --protocol Tcp --destination-port-ranges 22 \
  --source-address-prefixes '*' -o table
Now retry the SSH from step 2 — it hangs and times out. Resist the urge to recreate the VM. Apply the method.
4. Isolate the layer with Network Watcher (read-only). Get the NIC ID, then ask “would an NSG allow inbound SSH?” with IP flow verify:
NIC=$(az vm show -g $RG -n vm-ts --query 'networkProfile.networkInterfaces[0].id' -o tsv)
PRIV=$(az network nic show --ids $NIC --query 'ipConfigurations[0].privateIPAddress' -o tsv)

az network watcher test-ip-flow \
  -g $RG \
  --nic $NIC \
  --direction Inbound --protocol TCP \
  --local "$PRIV:22" --remote "1.2.3.4:12345" \
  -o table
Expected output: access = Deny, ruleName = ...DenySSH. In one read-only command you’ve proven the fault is the NSG (not the VM, not SSH, not your client) and named the offending rule — the whole point of the method.
5. Confirm with effective rules (optional, corroborating evidence).
az network nic list-effective-nsg --ids $NIC \
  --query "value[].effectiveSecurityRules[?destinationPortRange=='22']" -o table
You’ll see DenySSH sitting above the default allow — the merged, real ruleset Azure applied.
6. Fix the root cause (remove the bad rule) and verify by re-running the original reproduction:
az network nsg rule delete -g $RG --nsg-name vm-tsNSG -n DenySSH -o table
# Verify from the user's perspective — the reproduction from step 2:
ssh azureuser@<publicIpAddress> 'echo reconnected; exit'
It connects again. You diagnosed and fixed a connectivity incident without ever logging into the VM — because the evidence pointed at the network layer.
7. Prevent (discuss). In production you’d codify the working NSG in Bicep/Terraform so an ad-hoc deny can’t drift in unreviewed, and add an Activity Log alert on NSG rule changes — guards covered in the diagnostics and policy lessons.
Cleanup — delete everything so you pay nothing further:
az group delete -n $RG --yes --no-wait
Cost note. A Standard_B1s VM plus a Standard public IP runs a few US cents per hour; finish and delete within the hour and the total is a rounding error (typically under ₹10 / ~US$0.10). The Network Watcher checks are effectively free. --no-wait returns immediately while Azure deletes in the background — confirm the resource group is gone afterwards so nothing lingers on the bill.
Going deeper
The playbooks above get you to the fix. This section is for the reader who wants to know why the tools say what they say, where they lie by omission, what they cost, and what role you need to run them — the difference between using a diagnostic and trusting it too much.
IP flow verify is a logic check, not a connectivity test
IP flow verify evaluates NSG rules mathematically for one 5-tuple. It never puts a packet on the wire — which is why it is instant and safe, and why an Allow result only exonerates NSGs. It is blind to four things that can still break the connection: an Azure Firewall / network virtual appliance in the path, a UDR black-holing the route, the in-guest OS firewall, and whether the service is even listening. When you need an actual end-to-end test, use Connection Troubleshoot (az network watcher connection-troubleshoot, or “Connection troubleshoot” in the portal): it sends real TCP/ICMP probes from a source (a VM, Application Gateway, or Bastion) to a destination and returns the hop-by-hop path, the latency, and the specific NSG/UDR — or NVA — that dropped the traffic. Rule of thumb: IP flow verify answers “would an NSG allow this?”; Connection Troubleshoot answers “does traffic actually get there?”.
Two more blind spots worth knowing:
- Effective security rules show the merged NSG rules on a NIC — but security admin rules from Azure Virtual Network Manager (AVNM) are evaluated before NSGs and can force Allow/Deny across the estate; they are not part of a plain NSG’s rule list. If a packet is blocked and every NSG says Allow, suspect an AVNM security admin rule or Azure Firewall.
- Effective routes require the NIC to be attached to a running VM — a deallocated VM returns nothing, which surprises people mid-incident.
Flow logging is changing. If your runbooks mention NSG flow logs, note that Microsoft is retiring them: you can no longer create new NSG flow logs after 30 June 2025, and the feature retires entirely on 30 September 2027. Migrate to VNet flow logs (traffic through the whole virtual network, a richer schema, AVNM-aware) and analyse them in Traffic Analytics.
Identity: what-if vs report-only, and the four kinds of sign-in
Two Conditional Access features look similar and are not. Report-only attaches to a real sign-in: the policy is evaluated and its would-be result (grant / block / require MFA) is written to the sign-in log, but nothing is enforced — this is how you validate a policy safely before turning it on. The What-If tool is hypothetical: you specify a user, app, IP, device platform, and risk level, and it lists which policies would apply — no sign-in required, ideal for “why is this persona getting blocked?”. (For advanced policy design, see Conditional Access: token protection & protected actions.)
The other identity trap is which sign-in log to read. The default blade shows interactive user sign-ins. A failing daemon, function, or VM never appears there — it logs to a different table:
| Caller | Log table (Log Analytics) |
|---|---|
| A person signing in | SigninLogs |
| Background / refresh token, no UI | AADNonInteractiveUserSignInLogs |
| App / service principal (secret, cert) | AADServicePrincipalSignInLogs |
| Managed identity | AADManagedIdentitySignInLogs |
Chasing a workload 401/403 in the interactive logs and finding nothing is a classic dead end. Sign-in logs also lag a few minutes — the absence of a very recent entry is not proof.
Storage and App Service logs, and one correlation query
For a stubborn storage 403, turn on resource logs via diagnostic settings — they land in the StorageBlobLogs table in Log Analytics, and the AuthenticationErrorDetail field usually names the exact gate that failed. This is the modern successor to classic Storage Analytics logging in the $logs container. For bulk copies, azcopy writes a detailed job log: set AZCOPY_LOG_LOCATION, raise --log-level=DEBUG, then azcopy jobs show <job-id> to see per-file failures rather than one opaque error.
When you suspect a change caused the incident, one KQL query over the Activity Log answers “what changed?” across the whole subscription (illustrative — IDs and times are placeholders):
AzureActivity
| where TimeGenerated between (datetime(2026-06-15 09:00) .. datetime(2026-06-15 09:15))
| where ActivityStatusValue == "Success"
| project TimeGenerated, Caller, OperationNameValue, ResourceGroup, _ResourceId
| order by TimeGenerated asc
A write at 09:03 next to an outage at 09:05 is your prime suspect. The companion Azure Monitor: data collection rules, workbooks & alerting lesson turns queries like this into standing alerts.
Is it me or Azure? Three health scopes
- Resource Health — the platform’s view of your specific resource (Available / Degraded / Unavailable / Unknown), annotated as platform-initiated or user-initiated. A green VM here with a broken app means the fault is yours, not Azure’s.
- Service Health — advisories for your subscriptions and regions (outages, planned maintenance, health/security retirements).
- Azure Status — the public, world-wide page; the bluntest signal, and last to move for a scoped issue.
Wire Resource Health and Service Health to alerts so “is it me or Azure?” is answered before you spend an hour debugging your own config.
Cost and the RBAC to run the diagnostics
Diagnostics are cheap but not free, and they need permissions people forget:
| Diagnostic | Rough cost | Minimum role to run it |
|---|---|---|
| IP flow verify / next hop / effective rules | Effectively free | Reader + Network Watcher actions (Network Contributor covers them) |
| Connection Monitor (continuous) | Per-test billing | Network Contributor |
| Sign-in / audit logs | Free to view; Log Analytics bills per-GB ingestion if exported | Reports Reader / Security Reader (or Global Reader) |
| Resource Health | Free | Reader |
| Serial console / boot diagnostics | Boot-diagnostics storage is negligible | Virtual Machine Contributor; boot diagnostics enabled and not blocked by policy |
The quiet cost multiplier is Log Analytics ingestion: exporting verbose resource logs across a large estate can dominate a monitoring bill, so scope diagnostic settings to what you actually query and set a sensible retention.
Practice challenges
Work these in order — they escalate from a single command to a full incident. Try each before opening the solution; the one-line why is the part worth keeping.
1. Beginner — name the deciding rule. You cannot RDP to a Windows VM; the connection times out. State the single Network Watcher check that tells you whether an NSG is responsible, and the exact 5-tuple you feed it.
<details> <summary>Solution</summary>
IP flow verify, direction Inbound, protocol TCP, local = <VM private IP>:3389, remote = <your source IP>:<any high port>.
az network watcher test-ip-flow -g <rg> --nic <nicId> \
  --direction Inbound --protocol TCP \
  --local "<vmPrivateIp>:3389" --remote "<yourIp>:51000" -o table
Why: IP flow verify evaluates NSGs for that exact 5-tuple and names the deciding rule, so an Allow result clears the NSG in one read-only step and sends you to routes, the OS firewall, or the RDP service instead.
</details>
2. Beginner — the storage 403 that isn’t the firewall. A user with Reader on a storage account gets 403 when listing blobs, even from an allowed network. Which role fixes it, and why is Reader not enough?
<details> <summary>Solution</summary>
Assign Storage Blob Data Reader (a data-plane role). Reader is a control-plane role — it lets you see the account exists but grants no data access; blob reads are authorised by a separate data-plane role system.
Why: control plane (manage the resource) and data plane (touch the data) are independent authorization systems — the single most-tripped-over storage 403.
</details>
3. Intermediate — validate a Conditional Access change without an outage. You suspect a new CA policy will block a group of users. How do you confirm its effect before enforcing it, and prove which policy applies to one persona?
<details> <summary>Solution</summary>
Set the policy to report-only, have a test user sign in, then read the sign-in log’s Conditional Access tab for the would-be result (grant / block / MFA). To model a persona with no sign-in at all, use Conditional Access → What-If (pick user, app, IP, device).
Why: report-only evaluates and logs but never enforces, so you validate safely; What-If answers “which policies would apply?” purely hypothetically. </details>
4. Intermediate — the workload 403 you can’t find in the sign-in logs. A daemon using a managed identity gets 403 calling Key Vault. You look in the sign-in blade and see nothing. Where is the evidence, and what is the fix path?
<details> <summary>Solution</summary>
Managed-identity sign-ins are in AADManagedIdentitySignInLogs, not the interactive blade. Confirm the MI’s object id, run Check access on the vault, and grant the right role (Key Vault Secrets User under RBAC, or an access policy in the legacy model); verify the token’s audience/oid.
AADManagedIdentitySignInLogs
| where TimeGenerated > ago(1h)
| where ResultType != 0
| project TimeGenerated, ServicePrincipalName, ResultType, ResultDescription
Why: service principals and managed identities log to their own tables — searching interactive sign-ins for a workload failure finds nothing. </details>
5. Advanced — App Service 503 right after a deploy. Production returns 503 minutes after a release. Give the read-only diagnostic sequence and the instant rollback.
<details> <summary>Solution</summary>
Read-only first: Log stream for the live startup error → Application Insights → Failures → Resource Health for the plan. Confirm the app is Running and not cold/throttled. Instant rollback: swap the deployment slot back to the last-good version.
az webapp deployment slot swap -g <rg> -n <app> \
  --slot staging --target-slot production --action swap
Why: a slot swap-back is a near-instant, already-warmed rollback — a bad build never has to take the live site down while you diagnose. </details>
6. Advanced — “what changed?” in one query. An incident began at 09:10 on 2026-06-15. Write a KQL query that lists every successful control-plane write in the 10 minutes before, oldest first, with the caller and operation.
<details> <summary>Solution</summary>
AzureActivity
| where TimeGenerated between (datetime(2026-06-15 09:00) .. datetime(2026-06-15 09:10))
| where ActivityStatusValue == "Success"
| project TimeGenerated, Caller, OperationNameValue, ResourceGroup, _ResourceId
| order by TimeGenerated asc
Why: the Activity Log is the subscription’s audit of every control-plane write — a change immediately before the incident window is almost always the trigger, and this turns “what changed?” into one query. </details>
Common mistakes & troubleshooting
The meta-mistakes — the errors people make while troubleshooting — cost more than any single misconfiguration:
| Mistake | Why it bites | Do this instead |
|---|---|---|
| Changing several settings at once | You can’t tell what fixed it (or what broke worse) | Change one variable, test, then the next |
| Fixing the symptom, not the cause | The incident recurs tomorrow | Trace to root cause; capture a prevention (step 8) |
| Trusting the intended config over the effective config | NSGs/routes merge; what you set ≠ what’s applied | Read effective rules/routes, sign-in logs, real DNS |
| Confusing authentication with authorization | You add roles when sign-in is the block (or vice versa) | Sign-in logs for auth; Check access for RBAC |
| Confusing control plane with data plane (storage) | Reader won’t read a blob; you grant the wrong role |
Use Storage Blob Data roles for data ops |
| Forgetting RBAC propagation / token caching | “I assigned the role and it still fails” | Wait a few minutes; sign out/in for a fresh token |
| “Stopping” a VM in-guest and still being billed | Compute stays allocated | Deallocate (portal Stop / az vm deallocate) to stop compute charges |
| Skipping “what changed?” | You debug from scratch when a deploy caused it | Check the Activity Log first |
Common beginner mistakes
These are mental-model errors — wrong beliefs about what a tool actually tells you. They are distinct from the “meta-mistakes” table above (which is about how you troubleshoot); these are about what the evidence means.
-
“IP flow verify says
Allow, so the connection will work.” No — it only evaluates NSG rules. It cannot see Azure Firewall, an NVA, a UDR black hole, the in-guest OS firewall, or whether the service is listening.Allowclears one layer; keep going (Connection Troubleshoot tests the real path). -
“Effective rules / effective routes will show me what Azure Firewall is doing.” They show NSGs and route tables on the NIC only. Firewall/NVA decisions and AVNM security admin rules live outside that view — read the firewall’s own logs.
-
“A report-only Conditional Access policy is blocking my users.” By definition it can’t — report-only evaluates and logs but never enforces. If sign-ins are actually blocked, an enforced policy (or a missing auth method) is the cause; find it with What-If and the sign-in log’s CA tab.
-
“My background job’s failed sign-in will be in the sign-in logs.” It’s in a different log. The default blade shows interactive user sign-ins; service principals and managed identities have their own tables. Looking in the wrong one makes a real failure look invisible.
-
“The Activity Log will tell me why my app threw a 500.” The Activity Log records control-plane writes (deploys, config changes, deletes) — not in-application exceptions. App
500s live in Application Insights and the app’s own logs. -
“Resource Health is green, so my app is fine.” Resource Health reports the platform’s view of the resource (is the host/VM healthy) — not your code. A perfectly healthy VM can still run a crashing app.
-
“
nslookupfrom my laptop shows what the VM resolves.” DNS answers depend on the VNet’s configured DNS and Private DNS zone links, which differ from your laptop’s resolver. Test name resolution from inside the VNet (or with Connection Troubleshoot), especially forprivatelinknames.
Best practices
- Lead with read-only diagnostics. IP flow verify, next hop, effective rules/routes, sign-in logs, Check access, log stream — all inspect without mutating. Exhaust them first.
- Bisect to localise. Works here but not there? The difference is your fault. Same failure everywhere? It’s central.
- Keep the playbooks at hand. Match the symptom to the table, run the one diagnostic, apply the fix — don’t improvise under pressure.
- Codify the good state. Infrastructure as code (Bicep/Terraform) makes “config vs desired” trivial —
what-if/planshows drift instantly, and re-applying is the fix. - Close the loop with prevention. Every incident should leave behind an alert, policy, runbook entry, or test. An incident you don’t prevent is one you’ll repeat.
- Write it down. A two-line symptom → root cause → fix note is the seed of your team’s runbook and the fastest path for the next person (often future-you).
Security notes
Troubleshooting under pressure is exactly when security hygiene erodes — guard against it:
- Never “fix” access by granting Owner. Over-privileging to end an incident is how standing privilege accumulates. Diagnose the real scope gap, grant the least-privilege role, and prefer PIM just-in-time activation for admin actions.
- Prefer Entra auth over keys/SAS. For a storage
403, the durable fix is usually moving off account keys to Entra + RBAC (and user-delegation SAS), not regenerating a key — rotated keys break every other consumer anyway. - Don’t widen the network to make it work. Setting an NSG source to
Anyor exposing RDP/SSH to “test” leaves a hole. Scope to your IP, and connect via Azure Bastion so management ports need no public exposure. - Treat logs as sensitive. Sign-in, Activity and app logs hold IPs, principals and sometimes payloads. Restrict who can read them; don’t paste them into untrusted places.
- Revert speculative changes. Anything you loosened to diagnose and that didn’t help must go back — left-behind diagnostic changes are a classic source of the next incident.
Interview & exam questions
1. Walk me through how you troubleshoot an Azure issue. The loop: reproduce → isolate the layer → compare config vs desired → inspect logs/metrics → hypothesise and test (one variable) → fix the root cause → verify by re-running the reproduction → prevent. Emphasise isolating the layer and read-only first.
2. A VM is unreachable on port 443. First move? Network Watcher IP flow verify for inbound TCP/443 — it returns Allow/Deny and the deciding rule. If Allow, the NSG is exonerated; check next hop (a UDR to a dead NVA?), the in-guest service/firewall, and DNS. Don’t touch the VM until evidence points there.
3. Distinguish authentication from authorization failures, and the tool for each. Authentication = can you sign in (Entra, often Conditional Access) — use sign-in logs. Authorization = are you allowed this action (RBAC, the AuthorizationFailed/403) — use Check access. Conflating them is the classic error.
4. A user with Reader on a storage account gets 403 reading a blob. Why? Reader is a control-plane role — it shows the account exists but grants no data access. Reading blobs needs a data-plane role like Storage Blob Data Reader/Contributor; the two are separate authorization systems.
5. Name the four gates a storage request passes, in order. Firewall (network allowed?) → authorization (key/SAS/RBAC valid and sufficient?) → request validity (SAS expiry/perms, clock skew) → DNS (private-endpoint resolution). Any one returns 403; diagnose in that order.
6. How do you log into a VM with no working network and no RDP/SSH? The serial console — a keyboard into the VM’s serial port via the platform, independent of NSGs/network — backed by boot diagnostics to see the boot state. For external changes, run-command runs a script with admin/root rights over the control plane.
7. Stopping vs deallocating a VM — the difference, and why it matters? Stopping in-guest leaves the VM allocated — you keep paying for compute. Deallocating (portal Stop / az vm deallocate) releases the compute charge (disks still billed). A “stopped” VM still on the bill, or a deallocated VM that won’t restart due to capacity, are common surprises.
8. App Service returns 503. How do you approach it? 503 usually means the app failed to start, is stopped, or is cold/throttled. First: Log stream to read the actual startup error; confirm it’s Running; check Resource Health and Application Insights failures. Fixes: correct the startup error, enable Always On, scale, add the missing app setting.
9. You assigned an RBAC role but the user still can’t access. Three reasons. (a) Wrong scope; (b) propagation delay / cached token with old claims (sign out/in); © a Deny assignment or Azure Policy overrides the Allow. Check access reveals which.
10. A private-endpoint resource is reached on its public IP — what’s wrong, and how do you confirm? The Private DNS zone (e.g. privatelink.blob.core.windows.net) isn’t linked to the VNet or lacks the A record, so the name resolves to the public IP. Confirm with nslookup of the FQDN — it should return a private IP. Fix by linking the zone and adding the record.
11. How do you safely test a Conditional Access change you suspect is blocking sign-ins? Report-only mode: the policy is evaluated and logged in the sign-in logs (you see whether it would grant/block/require MFA) without enforcing it — so you validate before turning it on.
12. What turns a junior troubleshooter into a senior one? The last step: prevention. Juniors fix the symptom; seniors trace the root cause and leave behind an alert, a policy, infrastructure-as-code, or a runbook so it can’t silently recur — and they reason by isolating the layer instead of guessing.
Quick check
- In the eight-step method, which step is the “master move” that saves the most time, and what does it determine?
- A storage request from an identity you know has the right role still returns
403. Name two layers that could cause this and how you’d tell them apart. - You can’t SSH to a VM. Which single Network Watcher check tells you whether an NSG is responsible — and what extra information does it give you?
- A user “is an Owner” but gets
AuthorizationFailed. Give two plausible explanations. - True or false: stopping a VM from inside its operating system stops you being billed for compute. Explain.
Answers
- Isolate the layer (step 2). It determines which layer is failing — identity, network, DNS, resource, or app — so you fix the right thing instead of the first thing.
- The firewall (caller’s network not allowed) and authorization (credential/role insufficient — e.g. a control-plane role used for a data-plane op). Tell them apart via Networking on the account (is the caller’s IP/VNet allowed?) versus Check access for the right Storage Blob Data role; a private-endpoint DNS miss is a third possibility.
- IP flow verify — it returns Allow/Deny for the exact 5-tuple and names the deciding rule, confirming whether the NSG is the cause and which rule to change.
- Owner at a different scope (another resource group); role is eligible via PIM, not activated; or a cached token predates the assignment (sign out/in). A Deny assignment/Policy could also override it.
- False. Stopping in-guest leaves the VM allocated — compute charges continue. You must deallocate (portal “Stop” or
az vm deallocate) to release the compute charge (disks remain billed).
Exercise
You’re handed this incident cold: “Our internal API on api.internal.contoso.com, hosted on a VM behind a private endpoint, started returning errors at 09:10. Users get ‘connection timed out’. The app team swears nothing changed.”
Work it with the method and write down, for each step, what you would do and why:
- Reproduce — what exactly do you try, and from where (inside the VNet vs outside)?
- Isolate the layer — walk the five layers; for this symptom (“connection timed out” to a private-endpoint name), which layers are most likely and which can you quickly rule out?
- Config vs desired / what changed — where do you look to test “nothing changed”?
- Inspect — name the two or three read-only diagnostics you’d run (hint: one resolves the name, one checks the route/NSG) and what each result would tell you.
- Hypothesise & test, fix, verify, prevent — state your single most likely hypothesis, the one test that confirms it, the fix, how you’d verify from the user’s perspective, and the prevention you’d leave behind.
A strong answer recognises that “timed out” to a private name points hardest at DNS (resolving to the wrong/public IP — nslookup, expect a private IP, fix the Private DNS zone link) or the network (NSG/UDR — check effective rules and next hop); that the Activity Log is where you verify “nothing changed”; and that the prevention is codifying the Private DNS zone link plus an alert on changes to it.
Certification mapping
This lesson maps to AZ-104: Microsoft Azure Administrator, chiefly the Monitor and maintain Azure resources domain:
- Troubleshoot connectivity — NSG effective rules, effective routes, next hop, IP flow verify, DNS/private-endpoint resolution.
- Troubleshoot virtual machines — boot diagnostics, serial console, run-command, the VM agent/extensions, deallocate vs stop.
- Manage and troubleshoot identity/RBAC —
AuthorizationFailed, Check access, scope and inheritance, sign-in logs and Conditional Access (overlaps SC-300). - Troubleshoot storage — firewall vs authorization vs SAS vs DNS; control-plane vs data-plane roles.
- Troubleshoot App Service — log stream, Kudu, Application Insights, slots/swap (overlaps AZ-204).
The companion diagnostics toolkit lesson drills the specific tools the exam expects you to name. The method here is also what AZ-305 and real architecture interviews probe when they ask how you’d approach an unfamiliar failure.
Glossary
- Reproduce — making a fault occur on demand, so you can confirm both the cause and, later, the fix.
- Isolate the layer — determining which layer (identity, network, DNS, resource, application) is failing before changing anything.
- Effective security rules / effective routes — the merged, applied NSG ruleset and route table on a NIC (subnet + NIC + system + BGP + UDR), versus what you configured in isolation.
- IP flow verify — a Network Watcher check that says whether a 5-tuple would be allowed/denied by NSGs, and names the deciding rule.
- Next hop — a Network Watcher check showing where a packet to a destination actually goes (internet, VNet, virtual appliance, none).
- Boot diagnostics — a platform-captured screenshot and serial log of a VM as it boots, visible without logging in.
- Serial console — a keyboard into a VM’s serial port via the platform, working without network/RDP/SSH.
- Run-command — running a script as admin/root on a VM over the control plane, no SSH/RDP required.
- Control plane vs data plane — managing a resource (
Readersees the account) versus accessing its data (Storage Blob Data Reader reads blobs); separate authorization systems. - Authentication vs authorization — proving who you are (sign-in; Conditional Access) versus what you’re allowed to do (RBAC;
AuthorizationFailed). - Check access — the IAM feature showing a principal’s effective roles at a given scope.
- Deallocate vs stop — releasing a VM’s compute (no compute charge) versus a stopped-but-allocated VM (still billed for compute).
- Activity Log — the per-subscription audit of control-plane writes: who changed/deleted what, and when.
- Prevention — the alert, policy, IaC guard, or runbook left behind so an incident can’t silently recur.
- Connection Troubleshoot — a Network Watcher test that sends real probes hop-by-hop from a source to a destination, reporting the path, latency and any NSG/UDR/NVA that dropped the traffic — the active counterpart to the logical IP flow verify.
- VNet flow logs — the successor to the retiring NSG flow logs; records IP traffic through an entire virtual network, analysed in Traffic Analytics.
- Conditional Access What-If — an Entra tool that models which CA policies would apply to a hypothetical sign-in (user, app, IP, device) without anyone actually signing in.
- Report-only (Conditional Access) — a policy state that evaluates and logs the would-be outcome on real sign-ins without enforcing it — used to validate a policy before turning it on.
- Sign-in log types — interactive user, non-interactive user, service-principal and managed-identity sign-ins each record to a separate table; a workload failure never appears in the interactive blade.
- Resource Health vs Service Health — the platform’s health view of your specific resource versus advisories for your subscriptions/regions; Azure Status is the public world-wide page.
- User-delegation SAS — a shared-access signature signed with an Entra credential instead of the storage account key, so it can be scoped, revoked and audited per-identity.
- StorageBlobLogs /
$logs— storage resource logs sent to Log Analytics via diagnostic settings (theStorageBlobLogstable) versus the classic Storage Analytics logs in the$logscontainer. - KQL (Kusto Query Language) — the read-only query language for Log Analytics and Azure Monitor logs.
- SNAT port exhaustion — running out of source-NAT ports on a shared outbound path, seen as intermittent egress failures under load; fixed with a NAT gateway and connection reuse.
- PIM (Privileged Identity Management) — just-in-time role activation; an eligible role must be activated to become active — a frequent “I’m an admin but denied” cause.
- Deny assignment — an RBAC construct that blocks specified actions even when an
Allowrole grants them, overriding the role.
Next steps
You now have a method that works on any Azure failure and playbooks for the domains that break most often. The natural next move is to go deep on the tools the playbooks reference and learn to wield them fluently:
- Next lesson: The Azure Diagnostics Toolkit: Network Watcher, Resource Health, Boot Diagnostics & KQL — every diagnostic here, hands-on, plus a teachable KQL query set for Log Analytics.
Related reading:
- Azure Service Health, Advisor & Resource Graph — answer “is it me or is it Azure?” before debugging, and query your estate at scale.
- Azure Bastion: Secure RDP/SSH without Public IPs — the secure way to reach the VMs you’ve learned to diagnose.
- Microsoft Entra RBAC & Governance Deep Dive — scopes, inheritance, deny assignments and PIM, so the identity playbook becomes second nature.
- Secure, Zero-Downtime Deployments on App Service — slots and swap, so a bad build never causes the
5xxyou’ve learned to chase.