A payments platform team keeps getting paged for the wrong things. Someone clicks “create monitor” in the Datadog UI during an incident, tunes the threshold by feel, and forgets it exists — six months later there are 340 monitors, nobody knows which are load-bearing, three of them alert on a host naming convention that was retired last year, and the on-call rotation has quietly muted the two that matter because they were too noisy. Meanwhile the SRE lead cannot answer the one question leadership keeps asking: “are we actually meeting the 99.9% checkout SLO we promised the merchants?” The fix is not another dashboard. It is to stop treating observability config as clickops and start treating it as code: every monitor, every SLO, every synthetic test, and every maintenance window defined in Terraform, reviewed in a pull request, and applied by a pipeline. This guide walks through doing exactly that with the official Datadog Terraform provider, end to end, with the real resource names and flags.
The payoff is concrete. A monitor change becomes a diff a teammate can review before it pages anyone. An SLO target is version-controlled, so “we lowered the threshold” is a commit with an author and a reason, not a mystery. Synthetic tests that probe the checkout flow from outside live next to the app they guard. And a planned deploy can ship a scheduled downtime in the same PR, so nobody gets paged for a maintenance window everyone knew about.
In a nutshell
Think of an architect who draws the smoke detectors, sprinkler zones, and fire-exit routes directly onto the building blueprint — instead of leaving them for a contractor to bolt on by feel after the walls are up. Monitoring-as-code is exactly that move for software: you write your alarms (monitors), your service promises (SLOs), and your outside-in probes (synthetic tests) into the same version-controlled blueprint as the app, so the safety system ships with the thing it protects, gets reviewed in the same pull request, and can never quietly drift into an undocumented state that only one person understands.
The alternative — clicking “create monitor” in a UI during an incident — is how a team ends up with 340 alarms nobody trusts. When every monitor, SLO, and synthetic is a Terraform resource, a threshold change is a diff with an author and a reason, a lowered SLO target is a commit you can git blame, and a maintenance window ships in the same PR as the deploy it covers.
Level: Advanced · Time: ~30 min
You should already be comfortable with: the core Terraform workflow (init / plan / apply), remote state and locking, provider version pinning, and reading Datadog metric queries. Vault and GitHub Actions appear here, but you do not need to be an expert in either. The detailed account/key checklist is in Prerequisites just below.
After this lesson you will be able to:
- Pin and authenticate the
DataDog/datadogprovider so a key is never committed, withvalidatetoggled correctly for CI dry-runs. - Codify
datadog_monitor,datadog_service_level_objective, anddatadog_synthetics_testresources — and reason about which monitor type, SLO type, and synthetic subtype to reach for. - Express recovery thresholds, no-data behaviour, renotification, and evaluation delay so alerts fire on real problems and stop flapping.
- Manage dashboards, downtimes, and secret-carrying webhook routes as code without leaking a token.
- Detect and reconcile drift when someone edits a managed monitor in the UI, and lock it down with a restriction policy.
Prerequisites
- A Datadog account with an API key and an Application key (the app key must belong to a user/service account with admin or the granular
monitors_write,synthetics_write, andslos_writescopes). - Terraform >= 1.6 and the
DataDog/datadogprovider~> 3.50. - A remote state backend (this guide uses an S3 bucket with DynamoDB locking; any supported backend works).
- A CI runner — GitHub Actions here — that can reach
api.datadoghq.com(or your regional site, e.g.api.datadoghq.eu). - HashiCorp Vault reachable from CI for the Datadog keys, plus an existing integration emitting the metrics you will alert on (APM, a custom metric, or an integration like
aws.elb). - Datadog Synthetics enabled on the account, and at least one notification channel (a Slack integration and/or a ServiceNow integration for incident creation).
Target topology
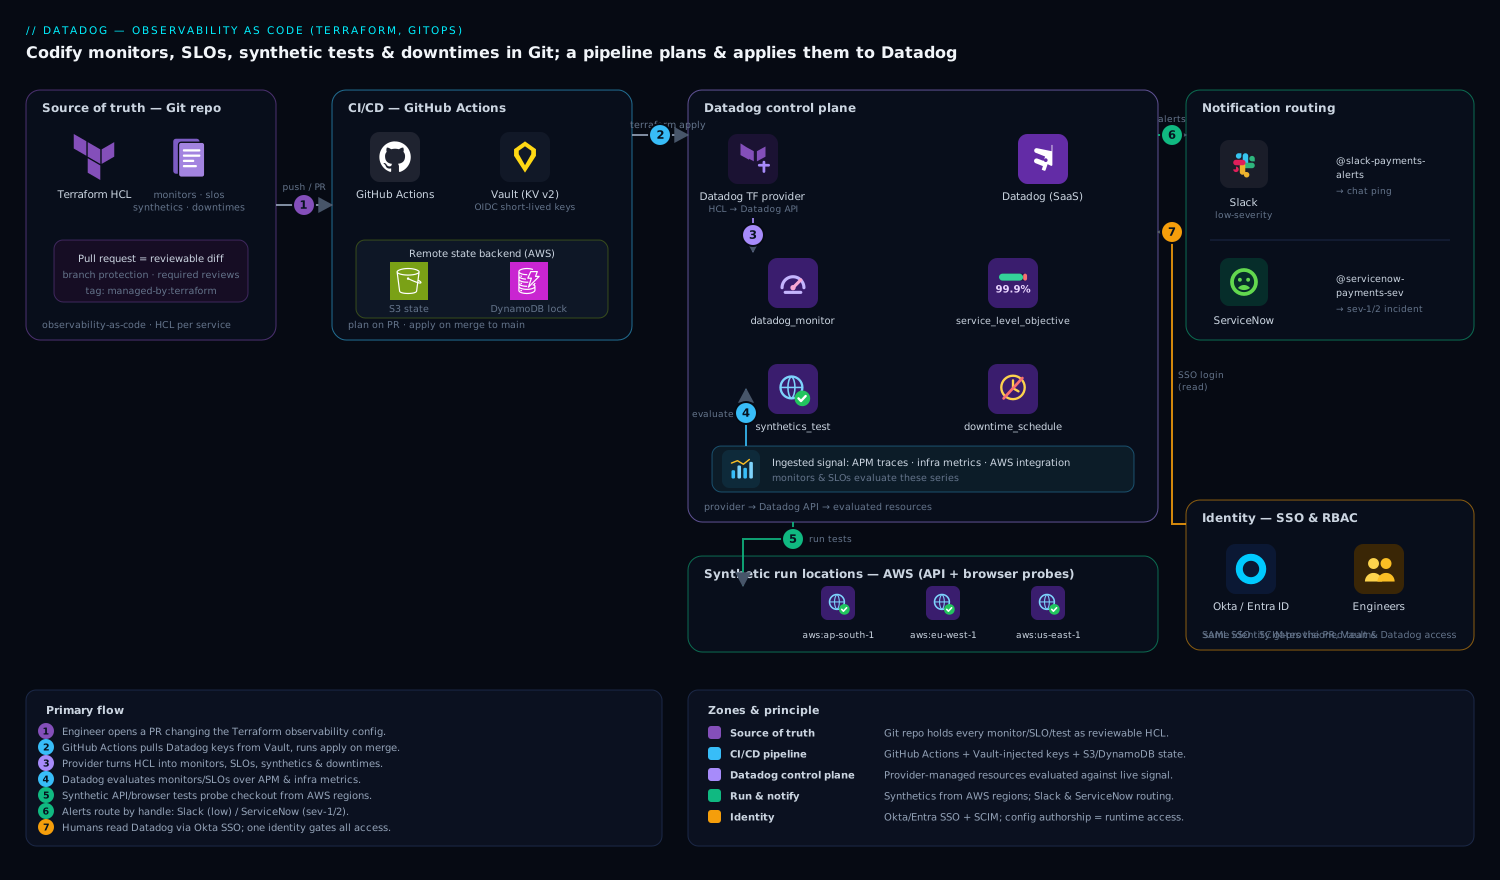
The shape is a single Git repository that is the source of truth for observability config, a CI pipeline that plans and applies it, and the Datadog control plane that the provider talks to. Engineers never touch the Datadog UI to create config; they read it there, but they change it in Terraform. Concretely:
- A Git repo (the
observability-as-coderepo) holds the Terraform: provider config, monitors, SLOs, synthetic tests, and downtime schedules, organized per service. - GitHub Actions runs
terraform planon every pull request and posts the plan as a PR comment; on merge tomainit runsterraform apply. The runner authenticates to Datadog with keys it pulls at job time from HashiCorp Vault (KV v2), so no Datadog secret is ever committed or stored as a long-lived CI variable. - The Datadog Terraform provider translates HCL into Datadog API calls, creating
datadog_monitor,datadog_service_level_objective,datadog_synthetics_test, anddatadog_downtime_scheduleresources. - Datadog itself ingests metrics from the application (APM traces, infra metrics, the AWS integration), evaluates the monitors and SLOs, and runs the synthetic API/browser tests from managed and (optionally) private locations.
- When a monitor triggers, notifications route by handle: Slack for low-severity, and a ServiceNow integration that opens an incident ticket for sev-1/sev-2, so the on-call has a record, not just a chat ping.
- Humans access Datadog through Okta (or Entra ID) SAML SSO with SCIM-provisioned teams, so the same identity that reviews the Terraform PR is the one whose RBAC governs what they can see in Datadog — config authorship and runtime access share one identity source.
Everything below builds this repo from an empty directory.
1. Lay out the repo and pin the provider
Create the project skeleton. Keeping one file per concern (monitors, SLOs, synthetics, downtimes) makes PR review legible and lets you terraform plan -target a single domain when you need to.
mkdir -p observability-as-code && cd observability-as-code
mkdir -p envs/prod
touch versions.tf provider.tf variables.tf \
      monitors.tf slos.tf synthetics.tf downtimes.tf outputs.tf
Pin the provider and Terraform versions explicitly. A floating provider version is how a terraform apply in CI silently changes behavior between two green PRs.
# versions.tf
terraform {
  required_version = ">= 1.6.0"

  required_providers {
    datadog = {
      source  = "DataDog/datadog"
      version = "~> 3.50"
    }
  }

  backend "s3" {
    bucket         = "kv-tfstate-observability"
    key            = "datadog/prod/terraform.tfstate"
    region         = "ap-south-1"
    dynamodb_table = "kv-tflock"
    encrypt        = true
  }
}
2. Wire credentials through Vault, never into HCL
The provider needs api_key, app_key, and api_url. Do not hardcode them and do not put them in a committed .tfvars. Read them from environment variables that CI populates from HashiCorp Vault at job time.
# provider.tf
provider "datadog" {
  # Reads DD_API_KEY / DD_APP_KEY / DD_HOST from the environment.
  # api_key  = var... <- intentionally omitted; use env vars.
  validate = true
}
Terraform’s Datadog provider reads DD_API_KEY, DD_APP_KEY, and DD_HOST from the environment automatically, so you only set those three. For local development against a non-prod org, export them from a Vault login:
export VAULT_ADDR="https://vault.kloudvin.internal:8200"
vault login -method=oidc   # Okta-backed OIDC auth to Vault

# KV v2 secret at secret/datadog/prod with keys api_key, app_key
export DD_API_KEY=$(vault kv get -field=api_key secret/datadog/prod)
export DD_APP_KEY=$(vault kv get -field=app_key secret/datadog/prod)
export DD_HOST="https://api.datadoghq.com"   # use api.datadoghq.eu for EU site

terraform init
terraform plan
In CI the same secrets come from Vault via the GitHub Actions Vault action (Step 8), so the keys live in exactly one place and rotate from there. Okta fronts both Vault login and Datadog SSO, so revoking a leaver in Okta cuts their access to the secret and the platform in one action.
3. Define monitors as code
Start with the alerts that actually wake people: a metric monitor on checkout error rate and a monitor on p99 latency. Use template variables and a shared notification block so every monitor speaks the same language to the on-call.
# variables.tf
variable "slack_low"   { default = "@slack-payments-alerts" }
variable "pager_high"  { default = "@servicenow-payments-sev" } # ServiceNow integration handle
variable "env"         { default = "prod" }
# monitors.tf
resource "datadog_monitor" "checkout_error_rate" {
  name    = "[${var.env}] Checkout error rate > 2%"
  type    = "metric alert"
  message = <<-EOT
    {{#is_alert}}
    Checkout error rate is {{value}}% over the last 5m (threshold 2%).
    Runbook: https://runbooks.kloudvin.io/checkout-errors
    ${var.pager_high}
    {{/is_alert}}
    {{#is_recovery}}Checkout error rate recovered.${var.slack_low}{{/is_recovery}}
  EOT

  query = <<-EOT
    sum(last_5m):sum:trace.http.request.errors{service:checkout,env:${var.env}}.as_count()
    / sum:trace.http.request.hits{service:checkout,env:${var.env}}.as_count() * 100 > 2
  EOT

  monitor_thresholds {
    critical = 2.0
    warning  = 1.0
  }

  notify_no_data    = true
  no_data_timeframe = 10
  renotify_interval  = 30
  require_full_window = false
  priority           = 1

  tags = ["service:checkout", "env:${var.env}", "team:payments", "managed-by:terraform"]
}

resource "datadog_monitor" "checkout_p99_latency" {
  name    = "[${var.env}] Checkout p99 latency > 800ms"
  type    = "metric alert"
  message = "Checkout p99 latency high. ${var.slack_low}"

  query = <<-EOT
    percentile(last_10m):p99:trace.http.request.duration{service:checkout,env:${var.env}} > 0.8
  EOT

  monitor_thresholds {
    critical = 0.8
    warning  = 0.6
  }

  priority = 2
  tags     = ["service:checkout", "env:${var.env}", "team:payments", "managed-by:terraform"]
}
A few choices that matter: managed-by:terraform on every resource lets you later query Datadog for any drift (monitors created by hand are the ones without that tag); require_full_window = false avoids the common false-recovery where a sparse metric flaps; and routing sev-1 to the @servicenow-... handle means a real incident opens a ServiceNow ticket automatically rather than living only in Slack.
4. Define SLOs that reference the monitors
An SLO turns the promise (“99.9% of checkouts succeed”) into a tracked, budgeted target. Datadog supports both metric-based and monitor-based SLOs. Use a metric-based SLO for the success-rate target and a monitor-based SLO that aggregates the latency monitor for an availability view.
# slos.tf
resource "datadog_service_level_objective" "checkout_success" {
  name        = "Checkout success rate"
  type        = "metric"
  description = "99.9% of checkout requests succeed (non-5xx)."

  query {
    numerator   = "sum:trace.http.request.hits{service:checkout,env:prod}.as_count() - sum:trace.http.request.errors{service:checkout,env:prod}.as_count()"
    denominator = "sum:trace.http.request.hits{service:checkout,env:prod}.as_count()"
  }

  # 30-day and 7-day rolling targets
  thresholds {
    timeframe = "30d"
    target    = 99.9
    warning   = 99.95
  }
  thresholds {
    timeframe = "7d"
    target    = 99.9
    warning   = 99.95
  }

  tags = ["service:checkout", "team:payments", "managed-by:terraform"]
}

resource "datadog_service_level_objective" "checkout_latency_avail" {
  name        = "Checkout latency availability"
  type        = "monitor"
  description = "Time the p99-latency monitor is in OK state."
  monitor_ids = [datadog_monitor.checkout_p99_latency.id]

  thresholds {
    timeframe = "30d"
    target    = 99.5
    warning   = 99.7
  }

  tags = ["service:checkout", "team:payments", "managed-by:terraform"]
}
The monitor-based SLO references datadog_monitor.checkout_p99_latency.id directly, so Terraform’s dependency graph guarantees the monitor exists before the SLO that consumes it — and if you delete the monitor, terraform plan will flag the now-broken SLO instead of leaving a dangling reference.
5. Add synthetic API and browser tests
Synthetics probe the service the way a user does, from outside your network — the signal a metric monitor cannot give you when the app is up but the login page 500s. Define an API test for a fast health-check and a browser test that walks the real checkout flow.
# synthetics.tf
resource "datadog_synthetics_test" "checkout_api_health" {
  name      = "API - checkout health endpoint"
  type      = "api"
  subtype   = "http"
  status    = "live"
  locations = ["aws:ap-south-1", "aws:eu-west-1", "aws:us-east-1"]
  message   = "Checkout health check failing. @slack-payments-alerts"
  tags      = ["service:checkout", "env:prod", "managed-by:terraform"]

  request_definition {
    method = "GET"
    url    = "https://checkout.kloudvin.io/healthz"
  }

  assertion {
    type     = "statusCode"
    operator = "is"
    target   = "200"
  }
  assertion {
    type     = "responseTime"
    operator = "lessThan"
    target   = "1500"
  }

  options_list {
    tick_every          = 60        # seconds between runs
    min_location_failed = 2         # alert only if >=2 locations fail (avoids one-region blips)
    retry{
      count = 1
      interval = 300
    }
    monitor_priority = 2
  }
}

resource "datadog_synthetics_test" "checkout_browser_flow" {
  name      = "Browser - end-to-end checkout"
  type      = "browser"
  status    = "live"
  device_ids = ["chrome.laptop_large"]
  locations  = ["aws:ap-south-1", "aws:eu-west-1"]
  message    = "End-to-end checkout journey broken. @servicenow-payments-sev"
  tags       = ["service:checkout", "env:prod", "managed-by:terraform"]

  request_definition {
    method = "GET"
    url    = "https://checkout.kloudvin.io/"
  }

  browser_step {
    name = "Click 'Add to cart'"
    type = "click"
    params { element = jsonencode({ targetOuterHTML = "<button>Add to cart</button>", url = "https://checkout.kloudvin.io/" }) }
  }
  browser_step {
    name = "Assert order confirmation visible"
    type = "assertElementContent"
    params {
      check = "contains"
      value = "Order confirmed"
      element = jsonencode({ targetOuterHTML = "<h1 class='confirm'></h1>" })
    }
  }

  options_list {
    tick_every          = 300
    min_location_failed = 1
    retry{
      count = 1
      interval = 600
    }
  }
}
min_location_failed = 2 on the API test is the difference between a useful alert and a 3 a.m. page for a transient hiccup in one AWS region. For checkout flows that must run from inside a VPC or behind the corporate edge, you would register a private location (a Datadog synthetics worker deployed as a container or virtual appliance in your network) and add its ID to locations; the test definition is otherwise identical. If your edge sits behind Akamai, point synthetic URLs at the public Akamai hostname so the test exercises the full CDN/WAF path a user actually traverses, not the origin directly.
6. Schedule downtimes for planned maintenance
The whole point of codifying downtimes is to ship the maintenance window in the same PR as the deploy it covers, so nobody gets paged for expected disruption. Use the modern datadog_downtime_schedule resource (the older datadog_downtime is deprecated).
# downtimes.tf
# Recurring weekly maintenance window (Sunday 02:00 IST), muting checkout monitors.
resource "datadog_downtime_schedule" "weekly_maintenance" {
  scope = "service:checkout AND env:prod"

  monitor_identifier {
    monitor_tags = ["service:checkout", "managed-by:terraform"]
  }

  recurring_schedule {
    timezone = "Asia/Kolkata"
    recurrence {
      start    = "2026-06-15T02:00:00"
      duration = "1h"
      rrule    = "FREQ=WEEKLY;INTERVAL=1;BYDAY=SU"
    }
  }

  display_timezone        = "Asia/Kolkata"
  notify_end_states       = ["alert", "warn"]
  notify_end_types        = ["expired", "canceled"]
  mute_first_recovery_notification = true
}
For a one-off deploy window, drop the recurring_schedule block and use one_time_schedule { start = "..." end = "..." } instead. Because the downtime targets monitor_tags, any new monitor you add later with service:checkout is automatically covered — no need to enumerate monitor IDs.
7. Plan and apply locally first
Before any CI runs, prove the config against a non-prod org from your workstation (with the Vault-exported keys from Step 2).
terraform init
terraform fmt -check          # fail the build on unformatted HCL
terraform validate
terraform plan -out=tfplan    # review every create/change
terraform apply tfplan
Read the plan carefully the first time: it should report only + create for net-new resources. If you already have hand-built monitors you want to bring under management, import them instead of letting Terraform create duplicates:
# Find the monitor ID in the Datadog UI URL, then:
terraform import datadog_monitor.checkout_error_rate 12345678
terraform plan   # should now show no changes if HCL matches reality
8. Promote to GitHub Actions
Now make the pipeline the only thing that touches prod. The workflow pulls Datadog keys from HashiCorp Vault at job time, plans on PRs, and applies on merge. No Datadog secret is stored in GitHub.
# .github/workflows/datadog-iac.yml
name: datadog-observability-as-code
on:
  pull_request: { paths: ["**.tf"] }
  push: { branches: [main], paths: ["**.tf"] }

permissions:
  contents: read
  id-token: write          # for OIDC to Vault and AWS state backend
  pull-requests: write     # to post the plan comment

jobs:
  terraform:
    runs-on: ubuntu-latest
    steps:
      - uses: actions/checkout@v4

      - name: Import Datadog secrets from Vault
        uses: hashicorp/vault-action@v3
        with:
          url: https://vault.kloudvin.internal:8200
          method: jwt
          role: gha-datadog-iac
          secrets: |
            secret/data/datadog/prod api_key | DD_API_KEY ;
            secret/data/datadog/prod app_key | DD_APP_KEY

      - uses: hashicorp/setup-terraform@v3
        with: { terraform_version: 1.6.6 }

      - name: Plan
        env:
          DD_HOST: https://api.datadoghq.com
        run: |
          terraform init
          terraform fmt -check
          terraform validate
          terraform plan -no-color -out=tfplan | tee plan.txt

      - name: Apply (main only)
        if: github.ref == 'refs/heads/main' && github.event_name == 'push'
        env:
          DD_HOST: https://api.datadoghq.com
        run: terraform apply -no-color -auto-approve tfplan
The vault-action exchanges the workflow’s OIDC token (id-token: write) for a short-lived Vault token bound to the gha-datadog-iac role, fetches the Datadog keys, and exports them as masked env vars for that job only. This is the same pattern that keeps long-lived credentials out of CI everywhere — the runner holds the keys for seconds, not forever. (The sibling lesson on GitHub Actions + Terraform OIDC PR automation drills into the plan-on-PR / apply-on-merge workflow itself.)
Validation
After an apply, confirm the resources are real and behaving, both in Terraform’s view and in Datadog’s.
# 1. Terraform agrees the world matches the code (no drift)
terraform plan -detailed-exitcode
#   exit 0 = no changes (good); exit 2 = drift to investigate

# 2. List what Terraform now manages
terraform state list | grep -E "datadog_(monitor|service_level_objective|synthetics_test|downtime)"

# 3. Verify a monitor via the Datadog API directly
MID=$(terraform output -raw checkout_error_rate_id)
curl -sf -H "DD-API-KEY: $DD_API_KEY" -H "DD-APPLICATION-KEY: $DD_APP_KEY" \
  "https://api.datadoghq.com/api/v1/monitor/${MID}" | jq '.name, .overall_state'

# 4. Trigger a synthetic test on demand and check the result
TID=$(terraform output -raw checkout_api_test_public_id)
curl -sf -X POST -H "DD-API-KEY: $DD_API_KEY" -H "DD-APPLICATION-KEY: $DD_APP_KEY" \
  -H "Content-Type: application/json" \
  -d "{\"tests\":[{\"public_id\":\"${TID}\"}]}" \
  "https://api.datadoghq.com/api/v1/synthetics/tests/trigger" | jq '.results[].result_id'
Add the matching output blocks so those commands resolve:
# outputs.tf
output "checkout_error_rate_id"      { value = datadog_monitor.checkout_error_rate.id }
output "checkout_api_test_public_id" { value = datadog_synthetics_test.checkout_api_health.id }
output "checkout_slo_id"             { value = datadog_service_level_objective.checkout_success.id }
Then visually confirm in the Datadog UI: the SLO appears on the Service Level Objectives page with an error budget bar, the synthetic tests show green runs from each configured location, and the monitors list filters cleanly on managed-by:terraform. A healthy steady state is terraform plan returning exit code 0 in CI on every run.
Rollback and teardown
Because the config is code, rollback is a Git operation, not a frantic clickops session.
# Roll back a bad change: revert the commit and let CI re-apply the prior state.
git revert <bad-sha>
git push    # the pipeline plans + applies the reverted config

# Remove a single resource cleanly
terraform plan  -destroy -target=datadog_synthetics_test.checkout_browser_flow
terraform apply -destroy -target=datadog_synthetics_test.checkout_browser_flow

# Tear down everything this stack manages (non-prod cleanup)
terraform plan  -destroy -out=tf-destroy
terraform apply tf-destroy
Two safeguards before you ever run a broad destroy: first, terraform plan -destroy and read the list — a metric-based SLO or a downtime you forgot about can be in scope. Second, if you need to stop managing a resource without deleting it from Datadog, use terraform state rm <address> to drop it from state, leaving the live object untouched. Deleting a monitor that an SLO references will fail the apply until you remove the SLO too — which is the dependency graph protecting you, not fighting you.
Common pitfalls
- Wrong site /
403 Forbidden. EU, US3, US5, and AP1 orgs each have their own API host. SetDD_HOSTto the matchingapi.datadoghq.eu/api.us3.datadoghq.com/ etc., or every call 403s with a confusing auth error that looks like a bad key. - App key lacks scope. A newly created app key may not carry
monitors_write/synthetics_write/slos_write. The provider then fails on apply, not plan. Grant the scopes (or use an admin service account) up front. - Drift from clickops. Someone edits a Terraform-managed monitor in the UI; the next
terraform applysilently reverts it. Make that visible: alert on any monitor without themanaged-by:terraformtag, and treat UI edits to managed resources as a process bug. min_location_failed = 1everywhere. A single-region network blip then pages the team. Set it to ≥2 for multi-region API tests so a real outage (multiple locations) is required to alert.- Deprecated
datadog_downtime. New code should usedatadog_downtime_schedule; mixing the two on the same monitors produces overlapping, hard-to-debug mutes. - Synthetic browser-step brittleness. Selectors captured from the recorder break when the DOM changes. Prefer stable
data-testidhooks in the app and keep browser tests few and high-value; lean on cheap API tests for breadth. - No-data handling.
notify_no_data = trueis right for a service that should always emit; for a metric that legitimately goes quiet, it manufactures false alerts. Decide per monitor.
Security notes
Keys are the whole game. Hold the Datadog API and Application keys in HashiCorp Vault (KV v2) and inject them into CI via short-lived, OIDC-exchanged tokens (Step 8) so nothing long-lived sits in GitHub or a .tfvars. Scope the application key to a dedicated service account with only the write permissions it needs, not a human admin. Front Datadog itself with Okta (or Entra ID) SAML SSO and SCIM provisioning so platform access is governed by the same identity directory that gates the Vault secret — one offboarding action revokes both. Restrict who can merge to main on the observability repo with branch protection and required reviews, because a merge here can mute production alerting. If you run private-location synthetic workers as virtual appliances inside the VPC, treat them as production infrastructure: patch them, and scope their egress to Datadog’s intake only.
Cost notes
Three Datadog cost drivers show up here, and Terraform makes each one a reviewable decision rather than an accident. Synthetic test runs bill per check (API runs are cheap, browser runs cost more), so the tick_every interval you set in HCL is literally a line-item — a 60-second browser test across three locations is far pricier than a 5-minute one, and the diff makes that visible in review. Custom metrics behind your monitors and SLOs are billed by cardinality; alerting on a metric tagged with unbounded values (per-request IDs) can quietly explode the bill, so keep monitor queries on bounded tags like service and env. Synthetic and APM volume scale with traffic, so cap noisy tests and prune monitors that no longer fire — and because everything is code, a quarterly “delete the dead monitors” PR is a five-minute review, not an archaeology project. Pipe Datadog’s own usage metrics into a monitor (yes, codified here too) so a cost spike pages someone before the invoice does.
Going deeper
The eight steps above get a working pipeline. This section is the “why it behaves that way” — the provider internals, the resource options that separate a noisy alarm from a trustworthy one, and the production nuances that only bite at scale.
The DataDog/datadog provider: two keys, and what validate really does
Datadog authentication is two secrets, and they are not interchangeable:
| Credential | Scope & lifetime | Fails how when wrong |
|---|---|---|
API key (DD_API_KEY) |
Org-level; identifies which account is calling. Long-lived. | 403 Forbidden on every call. |
Application key (DD_APP_KEY) |
Tied to the user or service account that created it, and carries that principal’s RBAC scopes (monitors_write, slos_write, synthetics_write). |
Plan succeeds, apply fails on the first write — the read path often needs less scope than the write path. |
Because the app key inherits the creator’s permissions, generating it from a human admin is a footgun: offboard that human and every pipeline using their key breaks. Mint it from a dedicated service account with only the write scopes it needs.
validate = true (the provider default) makes the provider call Datadog’s /v1/validate endpoint during plan/apply to confirm the keys work before doing anything else. That is what you want interactively. But it means you cannot even terraform plan without live keys — which breaks the common CI pattern of running terraform validate / fmt on a PR from a fork or a job that has no secrets. For those credential-free checks, set it off:
provider "datadog" {
  validate = false   # skip the live key check — for `terraform validate` / fmt in credential-less CI only
}
Keep it true on any job that actually plans or applies. Toggling it per-workspace with a variable is cleaner than editing provider.tf between environments.
datadog_monitor: type drives everything else
The type field is not cosmetic — it decides which query grammar and which options are legal. The ones you will actually use:
type |
Alerts on | Query shape |
|---|---|---|
metric alert |
A single metric crossing a threshold | avg(last_5m):avg:system.cpu.user{*} > 90 |
query alert |
Same, but with by {...} multi-alert grouping or functions |
avg(last_5m):avg:...{*} by {host} > 90 |
log alert |
Log event counts / facets | logs("status:error service:checkout").index("*").rollup("count").last("5m") > 100 |
service check |
An agent/integration check status | "http.can_connect".over("instance:checkout").last(3).count_by_status() |
slo alert |
An SLO’s error budget burning | references an SLO id + a burn-rate window |
composite |
Boolean logic over other monitors | 1234 && 5678 |
metric alert and query alert are near-synonyms; the provider normalises one into the other, so do not be surprised if plan shows a type change on import — align your HCL to what the API returns.
Recovery thresholds stop the flapping. A monitor that alerts at > 90 and recovers the instant it dips to 89.9 will page you all night on a metric hovering at the line. The fix is a separate, lower recovery threshold expressed inside monitor_thresholds as critical_recovery / warning_recovery — this is the “recovery threshold” people mean; Datadog monitors have no top-level recovery_threshold field:
resource "datadog_monitor" "host_disk" {
  name    = "[{{host.name}}] Disk almost full"
  type    = "query alert"
  message = <<-EOT
    {{#is_alert}}Disk on {{host.name}} is {{value}}% full (over {{threshold}}%).{{/is_alert}}
    {{#is_warning}}Disk on {{host.name}} climbing: {{value}}%.{{/is_warning}}
    {{#is_recovery}}Disk on {{host.name}} recovered to {{value}}%.{{/is_recovery}}
    @slack-infra-alerts
  EOT
  query   = "avg(last_5m):avg:system.disk.in_use{*} by {host} * 100 > 90"

  monitor_thresholds {
    critical          = 90
    critical_recovery = 80    # must fall back to 80% before "recovered"
    warning           = 80
    warning_recovery  = 70
  }

  notify_by           = ["host"]           # each host is a distinct alert instance
  renotify_interval   = 60                  # re-page every 60 min while still alerting
  renotify_statuses   = ["alert", "warn"]
  evaluation_delay    = 300                 # wait 5 min for late-arriving data before evaluating
  require_full_window = false

  tags = ["team:infra", "managed-by:terraform"]
}
Three options in there earn their keep:
evaluation_delay(seconds) delays evaluation so slow-reporting sources do not trip a false no-data or a premature alert. AWS CloudWatch metrics land ~10 minutes late;evaluation_delay = 900is standard for anything sourced from the AWS integration. Setting it too low is the single most common cause of phantom CloudWatch alerts.notify_bydefines the tag keys that make an alert instance unique in a multi-alert (by {host}) monitor — so a recovery onhost:web-1does not cancel the alert still firing onhost:web-2.renotify_interval+renotify_statusesre-page an unacknowledged alert instead of letting it rot silently after the first notification.
Template variables are the Mustache-style {{...}} tags in message. Conditional blocks — {{#is_alert}}…{{/is_alert}}, {{#is_warning}}, {{#is_recovery}}, {{#is_no_data}}, and the negation {{^is_alert}} — let one message body say the right thing in each transition. Value tags like {{value}}, {{threshold}}, and {{host.name}} interpolate live data. Handles (@slack-…, @pagerduty-…, @webhook-…) placed inside a conditional route only that transition — putting the pager handle inside {{#is_alert}} and the Slack handle inside {{#is_recovery}} means the page fires but the all-clear goes to chat.
datadog_service_level_objective: three types, one error budget
An SLO is not a monitor. A monitor answers “is it broken right now”; an SLO answers “how much of our budget to be broken have we spent this window”. That budget is the whole point: a 99.9% / 30-day target permits 0.1% × 30 days ≈ 43 minutes of badness per month. Spend it slowly and you are fine; burn it in one incident and you freeze risky deploys.
SLO type |
SLI comes from | Reach for it when |
|---|---|---|
metric |
A good-events / total-events ratio (query { numerator, denominator }) |
You have clean count metrics (requests, errors) — the most common case. |
monitor |
The uptime of one or more monitors (monitor_ids) |
Your signal is already a monitor and you want “time in OK state”. |
time_slice |
A per-interval condition over a metric (newer; provider ~> 3.30+) |
You want “% of 5-min windows where p99 < 800ms”, not a request ratio. |
The metric and monitor forms are in the lesson body above. The time-slice SLO is the advanced third option — it evaluates a condition per interval and counts the good intervals, which is exactly right for latency objectives where “requests under threshold” is awkward to express as a ratio:
resource "datadog_service_level_objective" "checkout_latency_ts" {
  name = "Checkout p99 under 800ms (time-slice)"
  type = "time_slice"

  sli_specification {
    time_slice {
      query {
        formula {
          formula = "query1"
        }
        query {
          metric_query {
            name  = "query1"
            query = "p99:trace.http.request.duration{service:checkout,env:prod}"
          }
        }
      }
      comparator             = "<="
      threshold              = 0.8      # 800 ms, in seconds
      query_interval_seconds = 300      # each 5-min window is one slice
    }
  }

  thresholds {
    timeframe = "30d"
    target    = 99.5
    warning   = 99.7
  }

  tags = ["service:checkout", "team:payments", "managed-by:terraform"]
}
Every SLO carries one or more thresholds blocks, one per timeframe (7d, 30d, 90d, or custom). The warning sits above target — it is the “you are trending toward a breach” line, not a second failure line. Pair an SLO with an slo alert monitor on its burn rate so you get paged when the budget is being spent too fast, long before the window actually breaches.
datadog_synthetics_test: outside-in, api vs browser
Synthetics are the only signal that catches “the app is up but the login page 500s”, because they hit the service the way a user does — from outside your network. Two shapes:
type = "api"(withsubtypehttp,ssl,tcp,dns,grpc, ormultifor chained steps) — cheap, fast; run them often and broadly.type = "browser"— a real headless Chrome/Firefox walking abrowser_stepscript acrossdevice_ids; expensive, so keep them few and high-value.
assertion blocks are the pass/fail contract. Beyond the statusCode / responseTime in the body above, common ones:
Assertion type |
Checks | Example operator / target |
|---|---|---|
statusCode |
HTTP status | is / 200 |
responseTime |
Latency (ms) | lessThan / 1500 |
body |
Response body | contains / "ok"; or validatesJSONPath with a targetjsonpath block |
header |
A response header (via property) |
is / application/json |
certificate |
TLS cert days-to-expiry | lessThan / 30 |
The locations list and options_list.min_location_failed together define how many managed regions must fail before alerting — the anti-flap control the body already stresses. For CI, options_list.ci { execution_rule = "blocking" } makes a failing test fail the pipeline (versus non_blocking), and you can run a codified test on demand from a deploy job with the datadog-ci CLI:
      - name: Run checkout synthetics in CI (blocking on failure)
        env:
          DATADOG_API_KEY: ${{ env.DD_API_KEY }}
          DATADOG_APP_KEY: ${{ env.DD_APP_KEY }}
        run: npx @datadog/datadog-ci synthetics run-tests --public-id "$SYNTH_PUBLIC_ID"
That closes the loop: Terraform defines the test once, and the same definition is exercised as a release gate — no second copy of the test living in the pipeline.
Dashboards as code — including the clickops escape hatch
Dashboards codify the same way. Two resources, and the second is the migration lever:
# Typed, reviewable, diff-friendly
resource "datadog_dashboard" "checkout_overview" {
  title       = "Checkout — Overview"
  layout_type = "ordered"
  reflow_type = "auto"

  widget {
    timeseries_definition {
      title = "Checkout error rate"
      request {
        q            = "sum:trace.http.request.errors{service:checkout}.as_count()"
        display_type = "bars"
      }
    }
  }

  template_variable {
    name     = "env"
    prefix   = "env"
    defaults = ["prod"]
  }
}

# Round-trip a UI-built dashboard verbatim: export its JSON, drop it in.
resource "datadog_dashboard_json" "checkout_imported" {
  dashboard = file("${path.module}/dashboards/checkout.json")
}
datadog_dashboard_json is how you get a heavily-designed dashboard out of clickops without re-authoring 40 widgets by hand: build it in the UI, Export dashboard JSON, commit the file, and manage it as one resource. The tradeoff is a less readable diff (a blob of JSON) versus the typed datadog_dashboard where every widget is a reviewable block. Use JSON for migration and complex one-offs; use the typed resource for anything the team edits regularly.
Message routing without leaking the token
Notification handles (@slack-payments, @servicenow-payments-sev) are not secrets — they are routing labels and are fine in HCL. A webhook URL with an embedded token is a secret. Datadog’s answer is a webhook plus a secret custom variable that the API stores and injects at send time but never returns in plaintext:
resource "datadog_webhook_custom_variable" "pd_routing_key" {
  name      = "PD_ROUTING_KEY"
  value     = var.pagerduty_routing_key   # supplied via TF_VAR_pagerduty_routing_key from Vault — never committed
  is_secret = true                         # value is write-only; Datadog will not echo it back
}

resource "datadog_webhook" "pagerduty" {
  name      = "payments-pagerduty"
  url       = "https://events.pagerduty.com/v2/enqueue"
  encode_as = "json"
  payload = jsonencode({
    routing_key  = "{{PD_ROUTING_KEY}}"   # resolved from the secret variable at delivery
    event_action = "trigger"
    payload      = { summary = "{{event.title}}", source = "datadog", severity = "critical" }
  })
}
Now a monitor routes with @webhook-payments-pagerduty in its message and the token never appears in cleartext where you would want it hidden — is_secret = true marks it write-only. Feed var.pagerduty_routing_key from Vault exactly like the Datadog keys, so the routing secret follows the same rotation path as everything else. (See the sibling lesson on Vault dynamic credentials in IaC pipelines for the injection pattern.)
Drift on UI-edited monitors, and how to make it impossible
Every managed resource is subject to drift: someone opens the Datadog UI mid-incident, nudges a threshold, and now reality diverges from code. Terraform’s model handles it predictably — but you have to decide how.
- Detect it.
terraform plan -refresh-onlyshows what the UI changed without proposing to fix it;terraform plan -detailed-exitcodereturns2when state and reality disagree, which is the CI signal to fail a scheduled drift job. - Reconcile it. The next
terraform applyreverts the UI edit back to code — Terraform assumes code is truth. That is usually what you want; the fix for a good UI edit is to port it into HCL and merge, not to keep it in the UI. - Prevent it. Do not rely on discipline — remove the ability to clickops-edit a managed resource. A
datadog_restriction_policybinds a resource to the principals allowed to edit it, so the UI simply will not let anyone outside the pipeline’s role change it:
data "datadog_role" "sre" {
  filter = "SRE"
}

resource "datadog_restriction_policy" "checkout_error_lock" {
  resource_id = "monitor:${datadog_monitor.checkout_error_rate.id}"

  bindings {
    relation   = "editor"
    principals = ["role:${data.datadog_role.sre.id}"]
  }
}
Combine that with the managed-by:terraform tag convention (alert on any monitor lacking the tag — those are the un-codified ones) and drift stops being a recurring cleanup and becomes a policy the platform enforces. For fields you intentionally let another system own, scope a lifecycle { ignore_changes = [...] } to just those attributes rather than disabling drift detection wholesale. The dedicated drift detection & reconciliation lesson goes deeper on the reconciliation loop.
Common beginner mistakes
These are misconceptions, not symptoms — the wrong mental model that produces the bug, and the model to replace it with. (For symptom-to-fix, see Common pitfalls above.)
- “I’ll build it in the UI first and import it to Terraform later.” The longer hand-built config lives, the more of it accumulates untracked, and “later” rarely comes. Right model: code-first for anything new; for existing config,
terraform importit this sprint, not someday. The UI is for reading managed config, not authoring it. - “The application key is basically a second API key.” It is not — the app key inherits the RBAC of the user or service account that created it. Right model: treat it like that principal’s badge. Mint it from a scoped service account, because deleting the human who made it silently breaks every pipeline that used it.
- “An SLO is just a monitor with a nicer name.” A monitor is an instantaneous state; an SLO is a budget consumed over a timeframe. Right model: the monitor tells you it is on fire now; the SLO tells you how much of your allowed fire-time this month you have already spent — and drives the burn-rate alert that pages you before the window breaches.
- “More monitors means more coverage.” Past a point, more alarms means less trust — the noisy ones get muted, taking the load-bearing ones with them. Right model: few, well-tuned, recovery-thresholded monitors beat hundreds of flapping ones. A quarterly “delete the dead monitors” PR is real coverage work.
- “Synthetic tests replace my metric monitors.” They answer different questions. Right model: monitors are inside-out (your metrics); synthetics are outside-in (a user’s experience through the CDN/WAF/DNS path). “App is up but checkout 500s” is only caught by the synthetic. Keep both; lean on cheap API tests for breadth and rare browser tests for depth.
- “
terraform applywill merge my UI change with the code.” It will not — apply treats code as truth and overwrites the UI edit. Right model: a UI change to a managed resource is a temporary patch that the next apply erases; the durable fix is a PR. If you truly want a field owned outside Terraform,ignore_changesit explicitly. - “Setting
notify_no_data = trueeverywhere is the safe default.” For a metric that legitimately goes quiet (a batch job, a low-traffic endpoint at 3 a.m.), no-data manufactures false pages. Right model: enable it only for signals that should always flow, and decide per monitor.
Practice challenges
Work these against a non-prod Datadog org with the Vault-exported keys from Step 2. Each solution is one way to do it, not the only way.
1. (Beginner) Add a recovery threshold and a warning tier to the checkout error monitor.
Give datadog_monitor.checkout_error_rate a warning at 1% and recovery thresholds so it will not flap at the line.
<details><summary>Solution</summary>
  monitor_thresholds {
    critical          = 2.0
    critical_recovery = 1.5
    warning           = 1.0
    warning_recovery  = 0.8
  }
Why: the *_recovery values force the metric to fall well below the trigger before Datadog calls it recovered, killing the every-minute flap on a value hovering at 2%.
</details>
2. (Beginner) Add a 90-day threshold to the success-rate SLO. Track the same target over a quarter as well as the existing 30d/7d.
<details><summary>Solution</summary>
  thresholds {
    timeframe = "90d"
    target    = 99.9
    warning   = 99.95
  }
Why: a longer window smooths out single bad days and is the figure leadership actually quotes to merchants; the 90d error budget is 0.1% × 90 days ≈ 130 minutes.
</details>
3. (Intermediate) Make the API health synthetic assert a JSON field, not just the status code.
The /healthz endpoint returns {"status":"ok"}. Fail the test if status is not ok.
<details><summary>Solution</summary>
  assertion {
    type     = "body"
    operator = "validatesJSONPath"
    targetjsonpath {
      jsonpath    = "$.status"
      operator    = "is"
      targetvalue = "ok"
    }
  }
Why: a 200 with a body of {"status":"degraded"} passes the status-code check but is a failing service — asserting the payload catches “up but unhealthy”.
</details>
4. (Intermediate) Codify a CloudWatch-sourced monitor without phantom alerts.
Alert on an aws.elb metric that arrives ~10 minutes late.
<details><summary>Solution</summary>
resource "datadog_monitor" "elb_5xx" {
  name             = "[prod] ELB 5xx elevated"
  type             = "metric alert"
  query            = "sum(last_5m):sum:aws.elb.httpcode_backend_5xx{loadbalancer:checkout-alb}.as_count() > 50"
  message          = "ELB 5xx elevated. @slack-payments-alerts"
  evaluation_delay = 900   # wait 15 min for CloudWatch's delayed metrics
  monitor_thresholds { critical = 50 }
  tags             = ["service:checkout", "managed-by:terraform"]
}
Why: without evaluation_delay, Datadog evaluates a window CloudWatch has not filled yet and fires false no-data/threshold alerts; 900s matches CloudWatch’s lag.
</details>
5. (Advanced) Migrate a hand-built dashboard into code and lock it. Bring an existing UI dashboard under management with minimal re-authoring, then stop people editing it in the UI.
<details><summary>Solution</summary>
# 1. In the UI: Export Dashboard JSON -> save to dashboards/checkout.json, then:
resource "datadog_dashboard_json" "checkout" {
  dashboard = file("${path.module}/dashboards/checkout.json")
}

# 2. Adopt the existing object instead of creating a duplicate:
#    terraform import datadog_dashboard_json.checkout <dashboard-id>

# 3. Lock editing to the SRE role:
data "datadog_role" "sre" {
  filter = "SRE"
}

resource "datadog_restriction_policy" "checkout_dash_lock" {
  resource_id = "dashboard:${datadog_dashboard_json.checkout.id}"

  bindings {
    relation   = "editor"
    principals = ["role:${data.datadog_role.sre.id}"]
  }
}
Why: datadog_dashboard_json adopts the exact UI design without rebuilding widgets, import avoids a duplicate, and the restriction policy makes UI drift impossible rather than merely detectable.
</details>
6. (Advanced) Route a monitor to PagerDuty via a webhook whose token never leaks, and prove no drift in CI. Add a secret-carrying webhook and a scheduled drift check.
<details><summary>Solution</summary>
resource "datadog_webhook_custom_variable" "pd_key" {
  name      = "PD_ROUTING_KEY"
  value     = var.pd_routing_key   # from Vault via TF_VAR_pd_routing_key — never committed
  is_secret = true
}

resource "datadog_webhook" "pd" {
  name      = "payments-pd"
  url       = "https://events.pagerduty.com/v2/enqueue"
  encode_as = "json"
  payload = jsonencode({
    routing_key  = "{{PD_ROUTING_KEY}}"
    event_action = "trigger"
    payload      = { summary = "{{event.title}}", source = "datadog", severity = "critical" }
  })
}
# Route a monitor to it by putting  @webhook-payments-pd  in the monitor message.
Scheduled drift job (nightly cron in CI):
terraform plan -detailed-exitcode
case $? in
  0) echo "no drift" ;;
  2) echo "DRIFT: reality diverged from code" && exit 1 ;;
  *) echo "plan errored" && exit 1 ;;
esac
Why: is_secret = true keeps the routing key write-only (Datadog never echoes it back), and -detailed-exitcode turns a nightly cron into a drift alarm — exit 2 means reality diverged from code.
</details>
Glossary
- Monitor — A Datadog rule that watches a query and changes state (OK → Warn → Alert) when it crosses a threshold; the
datadog_monitorresource. - SLO (Service Level Objective) — A target for how reliable a service should be over a window (e.g. 99.9% over 30 days); the promise you track, not the alarm you fire.
- SLI (Service Level Indicator) — The measured number an SLO grades — the success ratio or good-interval percentage the objective is computed from.
- Error budget — The allowed amount of failure:
(100% − target) × window. A 99.9%/30d SLO buys ~43 min/month; burn it and you throttle risky changes. - Burn rate — How fast the error budget is being consumed; an
slo alertmonitor on burn rate pages you before the window actually breaches. - Metric / Monitor / Time-slice SLO — The three
typevalues: a good/total ratio, the uptime of monitors, or the percentage of intervals meeting a per-window condition. - Synthetic test — A scripted probe that hits your service from outside (API or browser) on a schedule; the
datadog_synthetics_testresource. - API test / Browser test — A cheap request-level check versus a real headless-browser walkthrough of a user journey.
- Private location — A Datadog synthetics worker you run inside your own network to test endpoints the managed cloud locations cannot reach.
- Assertion — A pass/fail condition on a synthetic’s response (status code, response time, body JSONPath, header, cert expiry).
- Downtime / downtime schedule — A muting window that suppresses alerts during planned maintenance;
datadog_downtime_scheduleis the modern resource (datadog_downtimeis deprecated). - Template variable — The
{{...}}Mustache tags in a monitor message ({{value}},{{host.name}},{{#is_alert}}…{{/is_alert}}) that make one message body adapt to each state and group. - Notification handle — A routing label like
@slack-…or@webhook-…in a message; a label, not a secret. - API key vs Application key — The API key identifies the org; the app key carries the creating principal’s RBAC scopes and is what write operations authorize against.
validate(provider option) — When true (default), the provider live-checks the keys on plan/apply; set false for credential-lessterraform validate/fmtin CI.evaluation_delay— Seconds to wait for late-arriving data before evaluating a monitor; essential (~900s) for AWS CloudWatch-sourced metrics.- Recovery threshold — The separate, lower
critical_recovery/warning_recoverya metric must reach before Datadog calls a monitor recovered; kills flapping. require_full_window— Whether a monitor waits for a full evaluation window of data before alerting;falseavoids false recoveries on sparse metrics.min_location_failed— How many synthetic locations must fail before the test alerts; ≥2 avoids paging on a single-region blip.tick_every— How often (seconds) a synthetic runs — and a direct cost line-item.- Restriction policy —
datadog_restriction_policy; binds a resource to the roles/teams/users allowed to edit it, preventing UI drift by policy. - Drift — Divergence between Terraform state and live Datadog config, usually from a UI edit; surfaced by
plan -detailed-exitcode(exit 2) and reverted by the next apply. - Clickops — Configuring infrastructure by clicking in a console instead of in code; the anti-pattern this lesson replaces.
managed-by:terraformtag — A convention tag on every codified resource so you can alert on anything without it — i.e., the un-codified, drift-prone objects.