In a nutshell
Posture management is the architect walking the blueprints before anyone moves in: it reads the plans and flags the window with the weak latch. Cloud Workload Protection (CWPP) is the bodyguard detail that moves in with the tenants — one guard assigned to every running VM, every container, every database — watching how each workload behaves minute to minute and stepping in when something acts wrong. A patch scanner tells you the latch is weak. A bodyguard tells you someone is climbing through that window right now.
Defender for Cloud sells that bodyguard detail as a set of runtime plans, one per kind of workload: Defender for Servers guards VMs and Arc-enabled machines with an EDR sensor; Defender for Containers guards AKS pods and nodes; Defender for Databases guards Azure SQL, PostgreSQL/MySQL, and Cosmos DB; Defender for Storage guards blob storage. You switch on the plan for each workload type you run, make sure the sensor actually lands, and tune the alerts so the ones that reach your responders are real.
Here is the one idea a beginner should leave with: turning a plan “on” is a billing event, not protection. The entire skill in this lesson is the gap between a green toggle in the portal and a sensor that is genuinely watching the workload — and knowing which alerts mean “someone is inside the building” versus “a door was left unlocked.”
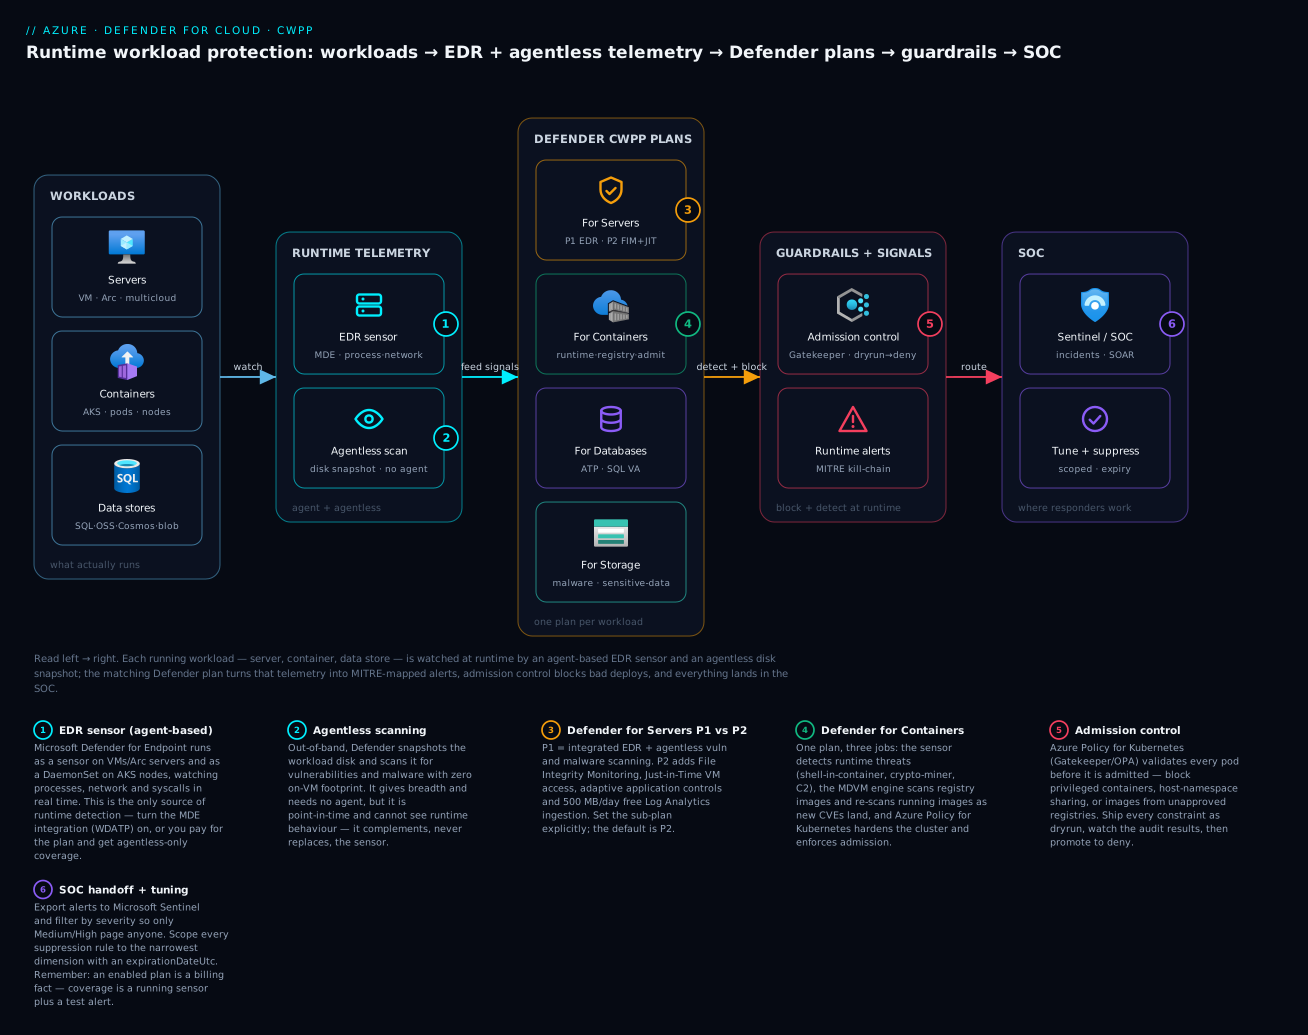
Follow the row left to right: each running workload is watched by an agent-based EDR sensor and an agentless disk snapshot, the matching Defender plan turns that telemetry into MITRE-mapped alerts, Azure Policy blocks bad pods at admission, and every alert lands in Sentinel where you tune and respond.
Level: Advanced · Time: ~33 min
Prerequisites. You should be comfortable with Defender for Cloud, Secure Score, and the CSPM basics from Defender for Cloud: CSPM, Secure Score, hardening; understand what EDR does from Defender for Endpoint onboarding; and know basic AKS objects (pods, DaemonSets, namespaces) and Azure SQL/managed-identity fundamentals. Sentinel appears at the SOC handoff — Microsoft Sentinel deployment covers that end.
After this lesson you can:
- Explain the CWPP-vs-CSPM split and route their outputs to the correct queues (SOC minutes vs backlog days).
- Enable Defender for Servers Plan 1 vs Plan 2 and confirm the MDE/EDR sensor actually landed — not just that the plan is billed.
- Stand up Defender for Containers with the sensor DaemonSet and Azure Policy admission control, promoting constraints
dryrun -> denysafely. - Enable Defender for Databases and Defender for Storage for every live engine, and read what each alert class actually means.
- Scope suppression rules narrowly and export alerts to Sentinel filtered by severity.
- Prove coverage with a safe test signal and gate it in CI so an enabled plan can never pass as silent coverage.
Posture management tells you a VM is missing a patch. Workload protection tells you that the same VM is currently running a reverse shell that beaconed out four minutes ago. Those are different jobs, different plans, and different on-call rotations. This guide is about the second one: the runtime workload-protection plans in Microsoft Defender for Cloud, and how to deploy and tune them so the alerts that reach your SOC are real, attributable, and actionable.
I assume you already have foundational CSPM on and Secure Score wired into a review cadence. If not, treat that as a prerequisite. Here we stay in the runtime lane: server EDR, container threat detection, and database protection.
1. CWPP vs CSPM: protecting running workloads, not posture
Cloud Security Posture Management (CSPM) is a configuration discipline. It scans declared state and tells you what is misconfigured, reachable, or non-compliant. It is largely agentless and its findings are latent risk.
Cloud Workload Protection Platform (CWPP) is a runtime discipline. It watches processes, syscalls, network connections, control-plane audit logs, and query patterns on live workloads and tells you what is happening right now. Its findings are alerts with a kill chain, not recommendations with a remediation button.
In Defender for Cloud the split is concrete:
| Concern | Plane | Plan family | Output |
|---|---|---|---|
| Posture / latent risk | Control + config | Defender CSPM (CloudPosture) |
Recommendations, attack paths, Secure Score |
| Runtime / active threat | Data + process | Defender for Servers/Containers/Databases | Security alerts with MITRE mapping |
The practical consequence: CSPM findings go to a platform/owner backlog with an SLA measured in days; CWPP alerts go to a SOC queue with a response time measured in minutes. Do not route them to the same place. If you have not separated those two streams, that is the first thing to fix.
2. Enable Defender for Servers with integrated EDR and agentless scanning
Defender for Servers ships two sub-plans, and the choice drives both cost and capability.
| Capability | Plan 1 | Plan 2 |
|---|---|---|
| Integrated Defender for Endpoint (EDR) | Yes | Yes |
| Agentless vulnerability scanning | Yes | Yes |
| Agentless malware scanning | Yes | Yes |
| File Integrity Monitoring | No | Yes |
| Just-in-time VM access | No | Yes |
| Free data ingestion to Log Analytics (500 MB/day) | No | Yes |
| Pricing model | Per server/hour | Per server/hour (higher) |
Plan 1 is essentially “EDR plus agentless scanning.” Plan 2 adds the controls most enterprises actually want — FIM, JIT, and the data allowance. Enable the sub-plan explicitly; the default if you omit --subplan is P2.
# Register the provider once per subscription (idempotent)
az provider register --namespace Microsoft.Security

# Enable Defender for Servers Plan 2 at subscription scope
az security pricing create \
  --name VirtualMachines \
  --tier Standard \
  --subplan P2

# Confirm what is actually enabled
az security pricing list \
  --query "value[?name=='VirtualMachines'].{plan:name,tier:pricingTier,sub:properties.subPlan}" \
  -o table
The single most common deployment defect here is leaving the MDE auto-provisioning integration off, which means the EDR sensor never lands and you are paying for Plan 2 while getting agentless-only coverage. Verify the integration setting:
# WDATP = the MDE sensor integration; should be On
az security setting show --name WDATP --query "enabled"

# Enable it if it is false
az security setting update --name WDATP --enabled true
For Azure VMs and Arc-enabled servers, the unified MDE sensor is provisioned automatically once this is on; no MMA/AMA agent is required for EDR. Agentless scanning, by contrast, requires no on-VM component at all — it snapshots the disk out-of-band, which is why it cannot detect runtime behavior. The two are complementary: agentless gives you breadth and zero footprint; the EDR sensor gives you real-time process and network detection. You want both.
Migration note: if you are coming from the legacy Log Analytics agent (MMA), it reached end of support and FIM/recommendation collection now runs on the Azure Monitor Agent (AMA) or, for the current generation, on Defender’s own data collection. Do not build new FIM on MMA.
3. Vulnerability assessment, file integrity monitoring, and adaptive controls
Vulnerability assessment. Defender for Servers uses the Microsoft Defender Vulnerability Management (MDVM) engine, integrated with the EDR sensor. There is nothing to deploy per VM beyond the sensor; findings surface as the recommendation Machines should have vulnerability findings resolved and feed the cloud security graph so a critical CVE on an internet-facing box becomes an attack path, not a row in a list. Pull current findings programmatically for ticketing:
az security assessment list \
  --query "[?contains(displayName, 'vulnerability findings')].{name:displayName,status:status.code}" \
  -o table
File Integrity Monitoring (FIM). FIM is a Plan 2 feature that watches a defined set of files, directories, and registry keys for change and raises an alert on unexpected modification — the classic detection for a tampered /etc/sudoers, a planted web shell in wwwroot, or a modified Run key. The current implementation collects via the Defender for Endpoint sensor and writes events to your Log Analytics workspace. Configure it from Defender for Cloud -> Environment settings -> [subscription] -> Defender for Servers settings -> File Integrity Monitoring, selecting the workspace and the rule set. Start from the recommended Linux/Windows baselines, then add the application-specific paths that matter to you:
Linux:   /bin, /sbin, /usr/bin, /usr/sbin, /etc/passwd, /etc/sudoers,
         /etc/ssh/sshd_config, /var/www/html
Windows: HKLM\...\Run, HKLM\...\RunOnce, C:\Windows\System32\drivers,
         <app>\wwwroot
Scope FIM narrowly. Monitoring /var/log or a directory that legitimately churns produces a wall of noise that trains the SOC to ignore the alert class entirely.
Adaptive controls. Two runtime hardening features earn their keep:
- Just-in-time VM access (JIT) keeps management ports (22/3389/WinRM) closed at the NSG and opens them, scoped to a source IP and a time box, only on approved request. Operators get access; attackers see closed ports.
- Adaptive application controls baseline the processes that normally run on a group of similar VMs and alert when something off-baseline executes — a lightweight allow-listing signal without the operational weight of full enforcement.
Request JIT access from the CLI so it can live in a runbook instead of a portal click:
az security jit-policy initiate \
  --resource-group prod-rg \
  --location eastus \
  --name default \
  --virtual-machines "[{\"id\":\"<vm-resource-id>\",\"ports\":[{\"number\":22,\"allowedSourceAddressPrefix\":\"203.0.113.10\",\"duration\":\"PT1H\"}]}]"
4. Deploy Defender for Containers: runtime threat detection and Kubernetes hardening
Defender for Containers is a single plan that covers AKS, Arc-enabled Kubernetes, and EKS/GKE through the multicloud connectors. It has three pillars: runtime threat detection on the cluster, vulnerability assessment of images, and Kubernetes posture hardening.
# Enable the Containers plan
az security pricing create --name Containers --tier Standard
Runtime detection needs the Defender sensor (a DaemonSet built on eBPF) and the cluster needs Azure Policy for Kubernetes (a Gatekeeper/OPA admission webhook) for hardening recommendations and admission control. On AKS these can be auto-provisioned; verify they are actually running rather than trusting the toggle:
# Defender sensor DaemonSet
kubectl get ds -n kube-system microsoft-defender-collector-ds -o wide

# Azure Policy / Gatekeeper add-on
kubectl get pods -n gatekeeper-system
az aks show -g prod-rg -n prod-aks \
  --query "addonProfiles.azurepolicy.enabled"
Enable the AKS add-ons explicitly if you manage clusters as code:
az aks enable-addons \
  --addons azure-policy \
  --resource-group prod-rg \
  --name prod-aks
Runtime detections you should expect to see fire in a real environment: a shell spawned inside a container, a crypto-mining process, a connection to a known C2 address, mounting of the host filesystem, and exposure of the Kubernetes dashboard. These arrive as alerts with the affected pod, image, and node attached.
5. Admission control and image scanning, in the registry and at deploy time
There are two scan points, and you want both because they catch different things.
Registry scan. Every image pushed to Azure Container Registry is scanned by the MDVM engine, and images already running in a cluster are re-scanned as new CVEs are published — so an image that was clean at push time still raises a finding when a new vulnerability drops. This is the difference between point-in-time and continuous assessment.
Deploy-time admission control. Azure Policy for Kubernetes enforces guardrails through the Gatekeeper webhook before a pod is admitted. Built-in Defender/Azure Policy initiatives cover the high-value controls: block privileged containers, disallow host namespace sharing, require read-only root filesystems, restrict allowed image registries. Run them in audit first, find what breaks, then move the chosen constraints to deny.
A registry allow-list is the highest-leverage admission rule — it stops anyone deploying an unscanned image from Docker Hub straight into prod. As a ConstraintTemplate-backed Gatekeeper constraint it looks like this:
apiVersion: constraints.gatekeeper.sh/v1beta1
kind: K8sAllowedRepos
metadata:
  name: prod-allowed-registries
spec:
  enforcementAction: deny   # start with: dryrun
  match:
    kinds:
      - apiGroups: [""]
        kinds: ["Pod"]
    namespaces: ["prod", "payments"]
  parameters:
    repos:
      - "prodacr.azurecr.io/"
Sequence matters: ship every constraint as dryrun, watch the Gatekeeper audit results and Defender recommendations for a full deployment cycle, then promote to deny. Flipping straight to deny on a busy cluster is how you cause the outage the security control was supposed to prevent.
6. Defender for Databases: SQL, Cosmos DB, and open-source engines
Database protection is split across distinct plans by engine. Enable the ones that map to real data stores:
# Azure SQL Database / Managed Instance / Synapse
az security pricing create --name SqlServers --tier Standard

# SQL Server running on VMs (IaaS)
az security pricing create --name SqlServerVirtualMachines --tier Standard

# Azure Database for PostgreSQL / MySQL / MariaDB
az security pricing create --name OpenSourceRelationalDatabases --tier Standard

# Azure Cosmos DB
az security pricing create --name CosmosDbs --tier Standard
These plans provide Advanced Threat Protection for the data plane. Representative alerts:
| Engine | Representative runtime alerts |
|---|---|
| Azure SQL / SQL on VM | SQL injection (active and vulnerability-probing), brute-force login, access from unusual location/principal, anomalous data extraction |
| PostgreSQL / MySQL / MariaDB | Brute force, access from a suspicious IP / unfamiliar principal, login from a new region |
| Cosmos DB | Access from a Tor exit node or suspicious IP, unusual extraction of large data volumes, key-based access anomalies |
For SQL on a VM, the SQL ATP signal rides the same MDE sensor as Defender for Servers, so a server already onboarded for EDR needs no second agent. For PaaS SQL and Cosmos DB the detection is service-side and requires nothing deployed — only the plan enabled. Confirm the SQL alert pipeline is live at the resource level:
az security atp storage show \
  --resource-group prod-rg \
  --storage-account <name> 2>/dev/null
# For SQL, ATP is surfaced under the SQL resource's security alert policy;
# validate end-to-end with the alert-sample test in the Verify section.
7. Tune runtime alerts, suppression rules, and SOC handoff
Out of the box these plans are tuned for broad detection, which means noise. Tuning is not optional; an untuned CWPP deployment trains responders to close alerts without reading them.
Suppression rules. When a benign pattern fires repeatedly — a vulnerability scanner that looks like brute force, an automation principal that trips “unusual access” — create a scoped suppression rule rather than disabling the detection globally. Suppress on the narrowest dimensions that kill the noise (specific alert type, specific resource or IP), never the whole alert name across the tenant.
az security automation-scopes ...   # for routing; suppression rules live under
# Security -> Alerts -> Suppression rules (alertsSuppressionRules ARM type).
# Scope a rule to one alert type and one resource, with an expiry:
{
  "properties": {
    "reason": "Authorized internal vulnerability scanner",
    "alertType": "SQL.DB_BruteForce",
    "state": "Enabled",
    "expirationDateUtc": "2026-12-31T00:00:00Z",
    "comment": "Scanner 10.20.0.5, ticket SEC-4821",
    "suppressionAlertsScope": {
      "allOf": [
        { "field": "entities.ip.address", "in": ["10.20.0.5"] }
      ]
    }
  }
}
Always set expirationDateUtc. A suppression rule with no expiry is a permanent blind spot that outlives the person who created it.
SOC handoff. CWPP alerts must leave Defender for Cloud and land where responders work. Two patterns, used together:
- Export to Microsoft Sentinel via the Defender for Cloud connector so alerts become incidents under analytics, correlation, and SOAR.
- Continuous export + workflow automation to push alerts to a Logic App for enrichment, ticketing, or Teams notification, scoped by severity so only Medium/High pages anyone.
# Stream alerts to a Log Analytics workspace via continuous export
az security automation create \
  --resource-group security-rg \
  --name export-high-alerts \
  --location eastus \
  --scopes "/subscriptions/<sub-id>" \
  --sources "[{\"eventSource\":\"Alerts\",\"ruleSets\":[{\"rules\":[{\"propertyJPath\":\"Severity\",\"propertyType\":\"String\",\"expectedValue\":\"High\",\"operator\":\"Equals\"}]}]}]" \
  --actions "[{\"actionType\":\"Workspace\",\"workspaceResourceId\":\"<workspace-id>\"}]"
Filter at export time on severity. Forwarding every Low/Informational alert into the SOC queue is the fastest way to bury the one that matters.
Verify
Validation has two halves: confirm the plans and sensors are present, and confirm they actually fire.
# 1. All runtime plans are Standard
az security pricing list \
  --query "value[?pricingTier=='Standard'].{plan:name,sub:properties.subPlan}" -o table

# 2. EDR integration on, sensor present on a sample VM
az security setting show --name WDATP --query "enabled"

# 3. Container sensor + admission webhook running
kubectl get ds -n kube-system microsoft-defender-collector-ds
kubectl get pods -n gatekeeper-system

# 4. Recent alerts exist (proves the pipeline end-to-end)
az security alert list \
  --query "[].{name:alertDisplayName,sev:severity,resource:compromisedEntity}" -o table
Then prove detection with safe, intended-for-testing signals rather than waiting for a real attack:
- Servers (EDR): run the official Defender for Endpoint detection test (
Invoke-AtpDetTest-style EICAR/PowerShell test) on a sample VM and confirm an alert appears within minutes. - Containers: exec a shell into a test pod and run a benign command that maps to a known detection (the documented Defender for Containers alert-validation procedure), then confirm the alert surfaces with the pod and image attached.
- Databases: trigger the SQL injection alert sample from the Defender documentation against a non-production database and confirm it routes through to Sentinel.
If a test signal does not produce an alert, the plan is enabled but the data path is broken — almost always a missing sensor or a workspace misconfiguration, not a licensing gap.
Enterprise scenario
A payments platform team ran a 40-cluster AKS estate plus a fleet of SQL-on-VM hosts. They had enabled Defender for Containers and Defender for Servers months earlier, the toggles were green, and leadership considered the workloads “protected.” During an incident review the SOC noted they had never received a single container runtime alert from one business unit’s clusters — despite a red-team exercise that had successfully dropped a crypto-miner pod and run for two days.
The constraint: those clusters were provisioned by an older Terraform module that disabled the AKS Azure Policy and monitoring add-ons for performance reasons, and the Defender sensor DaemonSet had never been scheduled because a restrictive PodSecurity admission setting in kube-system blocked the privileged collector pods. The plan was billed and enabled at the subscription, so every dashboard showed coverage — but the data plane was dark. Posture said “protected,” runtime said nothing, and the gap was invisible until someone asked why a known-compromised cluster had been silent.
The fix was a coverage-validation gate in CI, not a portal change. They added a post-deploy check that fails the pipeline if the sensor DaemonSet is not Running on every node, turning “the plan is enabled” into “the sensor is actually collecting”:
# Fails the deploy if any node lacks a Running Defender collector pod
desired=$(kubectl get ds -n kube-system microsoft-defender-collector-ds \
  -o jsonpath='{.status.desiredNumberScheduled}')
ready=$(kubectl get ds -n kube-system microsoft-defender-collector-ds \
  -o jsonpath='{.status.numberReady}')
if [ -z "$ready" ] || [ "$desired" != "$ready" ]; then
  echo "Defender sensor not fully scheduled: ${ready:-0}/${desired:-0}" >&2
  exit 1
fi
The lesson generalizes to every plan in this article: an enabled plan is a billing fact, not a coverage fact. Coverage is the sensor running, the integration toggled on, and a test signal producing an alert. Validate the second thing, in CI, on every workload.
Rollout checklist
Going deeper
The seven sections above are the deployment runbook. This section is the layer underneath it — the internals, the money, the identity, and the failure modes that separate someone who enabled CWPP from someone who operates it.
The CWPP/CSPM boundary is a queue split, not a product split
CSPM and CWPP are separate disciplines, but in Defender for Cloud they share one correlation surface: the cloud security graph. CSPM’s attack-path engine (a critical CVE on an internet-facing VM with a path to a database) and CWPP’s runtime alerts both land on that graph. So a runtime alert on a workload that CSPM already flagged as exposed is automatically prioritized higher than the same alert on a segmented internal host. The queues are different — posture goes to an owner backlog measured in days, alerts go to the SOC measured in minutes — but the evidence is one graph.
There is also a paid/free line worth knowing. Foundational CSPM is free and always on: recommendations, Secure Score, asset inventory. Defender CSPM (CloudPosture) is a paid plan that adds attack-path analysis, agentless secrets/vulnerability scanning, and DevOps posture. Every CWPP plan (VirtualMachines, Containers, the database plans, StorageAccounts) is separately paid and metered per workload. Turning on a CWPP plan does not turn on Defender CSPM, and vice versa — a common billing surprise.
Agent-based vs agentless: why serious shops run both
The two collection modes are not competing options; they cover different blind spots.
| Dimension | Agent-based (EDR sensor) | Agentless (disk snapshot) |
|---|---|---|
| Runtime process / network / syscall detection | Yes | No |
| Installed-software + vulnerability inventory | Yes | Yes |
| Malware on disk | Yes, real-time | Yes, point-in-time |
| Footprint on the workload | A sensor process | None |
| Detection latency | Seconds | Hours (scan cadence) |
| Onboarding required | Yes (MDE integration) | No |
| Blind to | Nothing at runtime | All runtime behaviour |
Internally, agentless scanning takes a snapshot of the managed disk in Defender’s own scanning environment, analyzes it out-of-band, and discards it. The workload never sees CPU load and no scanning credential ever sits on the host — which is exactly why it is safe to run on your most sensitive machines, and exactly why it cannot see a reverse shell that only ever lived in memory. The practical playbook: agentless gives you ~100% breadth on day one with no rollout project, while the EDR sensor — the only source of real-time detection — catches up as onboarding rolls across the fleet. Running only agentless means you are blind to live attacks; running only the sensor means every un-onboarded machine is a hole. Run both.
Defender for Servers P1 vs P2, under the hood
The WDATP setting you toggled in section 2 is what auto-provisions the unified MDE sensor; on Arc-enabled machines that sensor rides the Arc agent rather than a separate install (see Azure Arc-enabled servers). Vulnerability findings come from MDVM, which is built into that sensor — there is no separate scanner deployment as there was with the retired legacy VA integration.
Two P2 details that trip people up:
- The 500 MB/day free ingestion is per node and applies to a specific set of security data types in the workspace (security events, and the tables the security solution populates). It is not a blanket 500 MB of arbitrary logs — send other tables, or overrun the allowance with a chatty FIM rule, and you pay standard Log Analytics rates.
- JIT is implemented as a default-deny on the management ports at the NSG (or Azure Firewall), with a time-boxed, source-scoped allow created only on approved request. When the time box expires the allow rule is removed automatically. Adaptive application controls are ML over a VM group’s process history — they need a baseline period of “normal” before they mean anything.
RBAC: enabling a plan needs Security Admin (or Owner/Contributor) at subscription scope; reading alerts needs Security Reader. The EDR sensor onboards using the machine’s own context; agentless scanning uses a Defender-managed identity that is granted disk-read permission in your subscription when you enable the capability.
Defender for Containers: what the three pillars actually are
Runtime detection is an eBPF-based DaemonSet (microsoft-defender-collector-ds) that must schedule on every node — which is precisely why a restrictive PodSecurity standard, a node taint, or a missing toleration silently kills coverage (the enterprise scenario above). eBPF lets it observe syscalls and network activity in-kernel without a sidecar per pod.
Beyond the sensor, Defender can do agentless work too: agentless discovery reads the Kubernetes API to map workloads and RBAC for posture, and agentless registry/image scanning runs without touching the cluster. But runtime detection always requires the DaemonSet — agentless can tell you an image is vulnerable; only the sensor can tell you a shell just spawned in a running pod. Registry scanning uses MDVM and re-scans running images continuously as new CVEs publish, so “clean at push time” is not “clean forever.”
Admission control is the Azure Policy for Kubernetes add-on, which is Gatekeeper/OPA under the hood. Built-in initiatives map to Gatekeeper ConstraintTemplates; your Constraint objects (like K8sAllowedRepos) parameterize them. For EKS/GKE the sensor installs via the multicloud connector (Helm/Arc) rather than the AKS add-on.
Defender for Databases: ATP and SQL VA are two different things
The database plans bundle two capabilities that are constantly conflated:
- Advanced Threat Protection (ATP) is the CWPP signal: behavioural, near-real-time alerts on the data plane — SQL injection, brute force, access from an unusual location or principal, anomalous exfiltration. For PaaS SQL and Cosmos DB it is service-side (nothing to deploy); for SQL-on-VM it rides the MDE sensor.
- SQL Vulnerability Assessment (VA) is a CSPM-flavoured posture scan of the database’s own configuration — excessive permissions, weak settings, columns that look like unclassified PII — measured against a baseline. It is bundled into the SQL plan and, on current builds, uses express configuration by default (no storage account to provision). It applies to Azure SQL; Cosmos DB and the OSS engines get ATP but not the SQL VA scanner.
So the SQL plan gives you both a runtime signal (ATP) and a posture signal (VA) from one enablement — a useful thing to know when someone asks why “the database plan” shows up in both the alerts queue and the recommendations list.
Defender for Storage: malware scanning and sensitive-data awareness
Storage is not in the deployment sections above, but it belongs in any CWPP rollout. The current plan (DefenderForStorageV2) adds two headline capabilities on top of the classic activity alerts (access from a Tor exit node, anomalous extraction, upload of suspicious content):
- On-upload malware scanning — Microsoft’s antimalware engine scans each new blob as it is uploaded and raises an alert (and optionally tags the blob) on malicious content. This is the control you want on any container that accepts untrusted user uploads.
- Sensitive-data threat detection — uses sensitive-data discovery to raise the severity of alerts that touch containers holding sensitive data, so an anomalous read on a bucket of PII outranks the same read on a public-assets bucket.
# Enable the current Defender for Storage plan (per-account, malware + sensitive-data)
az security pricing create \
  --name StorageAccounts \
  --tier Standard \
  --subplan DefenderForStorageV2
# Malware scanning and sensitive-data detection are the plan's extensions —
# enable/scope them per plan (portal or --extension). Representative; not a live run.
Scope malware scanning to accounts that ingest untrusted uploads. Blanket-enabling per-GB scanning across a multi-petabyte data lake is how you turn a security control into a surprise invoice — set the monthly scanning cap.
What each plan is metered on
Pricing changes, but the billing unit is stable and is what you actually model against:
| Plan | Metered on |
|---|---|
| Defender for Servers P1 / P2 | Per server-hour |
| Defender for Containers | Per vCPU-hour of the cluster’s cores |
| Defender for SQL (PaaS / Managed Instance) | Per protected instance |
| Defender for SQL-on-VM | Per server-hour |
| Defender for OSS RDBMS (PostgreSQL/MySQL/MariaDB) | Per server |
| Defender for Cosmos DB | Per 100 RU/s of provisioned throughput |
| Defender for Storage | Per storage account (+ per-GB malware scanned) |
The Containers plan metering on cluster vCPU-hours is the one that surprises people: a big node pool that scales out for a batch job scales your Defender bill with it.
Failure modes worth pre-empting
- Inherited policy strips the extension. The plan is enabled at the subscription, but a policy assignment on a nested management group removed the Defender extension from a resource group — sensor absent on those machines, dashboard still green.
- Agentless can’t snapshot the disk. Agentless scanning needs a managed disk in a supported region; unmanaged or legacy disks are silently skipped, so those hosts have sensor-only (or no) coverage.
- FIM floods the allowance. A FIM rule on a churning path can blow past the 500 MB/day free ingestion and generate both cost and noise. Scope to files that should never change.
- Admission
denymatches system namespaces. A constraint promoted todenythat accidentally matcheskube-systemcan block the cluster’s own control-plane pods — a self-inflicted outage from a security control. Always exclude system namespaces and test indryrun. - Suppression with no expiry. A suppression rule without
expirationDateUtcis a permanent blind spot that outlives the incident, the scanner, and the person who created it.
Practice challenges
Work these in order; each has a hidden solution. Treat every command as representative — this host has no Azure subscription, so nothing here is a live run. Validate schema, not execution.
<details> <summary><strong>1. (Beginner)</strong> Enable Defender for Servers Plan 2 on a subscription and prove which sub-plan is actually active — not just that the plan is Standard.</summary>
az security pricing create --name VirtualMachines --tier Standard --subplan P2

az security pricing list \
  --query "value[?name=='VirtualMachines'].{plan:name,tier:pricingTier,sub:properties.subPlan}" \
  -o table
Why: tier=Standard only proves the plan is billed; the subPlan field is what tells you P1 vs P2, and P2 is where FIM, JIT, and the ingestion allowance live. Reading the sub-plan is the difference between “we pay for Servers” and “we have the controls we think we have.”
</details>
<details> <summary><strong>2. (Beginner -> Intermediate)</strong> You enabled P2 but the SOC sees only agentless vulnerability findings — no live EDR alerts. Diagnose in one command and fix it.</summary>
# Diagnose: is the MDE sensor integration on?
az security setting show --name WDATP --query "enabled"

# Fix if it returns false:
az security setting update --name WDATP --enabled true
Why: Agentless scanning works the moment the plan is on, so vulnerability findings appear and everything looks healthy — but without WDATP the EDR sensor never provisions, so there is zero runtime detection. This is the single most common Defender for Servers defect: paying for P2, getting agentless-only.
</details>
<details>
<summary><strong>3. (Intermediate)</strong> Write a File Integrity Monitoring path set for a Linux web server, and justify why you deliberately exclude /var/log and /tmp.</summary>
Monitor:  /etc/passwd, /etc/shadow, /etc/sudoers, /etc/ssh/sshd_config,
          /bin, /sbin, /usr/bin, /usr/sbin, /var/www/html
Exclude:  /var/log  (rotates and appends constantly)
          /tmp      (legitimately churns every second)
Why: FIM value comes from unexpected change to things that should be stable — auth config, system binaries, web root. Directories that change constantly by design generate a wall of alerts, blow the 500 MB/day ingestion allowance, and train the SOC to ignore the entire FIM alert class. Narrow scope is what makes FIM a signal instead of noise. </details>
<details> <summary><strong>4. (Intermediate)</strong> Enable Defender for Containers on an AKS cluster and verify the sensor and admission add-on are Running on every node — not merely that the plan and add-on are enabled.</summary>
az security pricing create --name Containers --tier Standard
az aks enable-addons --addons azure-policy -g prod-rg -n prod-aks

# Verify the sensor is scheduled on every node:
kubectl get ds -n kube-system microsoft-defender-collector-ds -o wide
# desiredNumberScheduled must equal numberReady

# Verify the Gatekeeper webhook is running:
kubectl get pods -n gatekeeper-system
Why: The plan toggle and the add-on flag are billing/config facts. Coverage is the DaemonSet actually scheduled and Ready on every node — a node taint or a restrictive PodSecurity standard can leave the collector unscheduled while every dashboard shows green. desired == ready is the real check.
</details>
<details>
<summary><strong>5. (Advanced)</strong> Ship a registry allow-list to the payments namespace so no one can deploy an unscanned public-registry image — without causing an outage on rollout.</summary>
Ship it in dryrun first:
apiVersion: constraints.gatekeeper.sh/v1beta1
kind: K8sAllowedRepos
metadata:
  name: payments-allowed-registries
spec:
  enforcementAction: dryrun   # promote to: deny
  match:
    kinds:
      - apiGroups: [""]
        kinds: ["Pod"]
    namespaces: ["payments"]
  parameters:
    repos:
      - "prodacr.azurecr.io/"
      - "mcr.microsoft.com/"
Watch kubectl get k8sallowedrepos payments-allowed-registries -o yaml (the status.violations) for a full deploy cycle, fix any legitimate image that would be blocked, then change enforcementAction to deny and re-apply.
Why: dryrun reports what would be blocked without blocking it, so you discover the forgotten mcr.microsoft.com sidecar or init-container before it takes down a deploy. Flipping straight to deny on a live namespace causes exactly the outage the control was meant to prevent.
</details>
<details>
<summary><strong>6. (Advanced)</strong> An authorized nightly vulnerability scanner at 10.20.0.5 trips a SQL brute-force alert every night. Suppress it correctly, and add a CI gate so the plan can never pass as silent coverage.</summary>
Scoped, expiring suppression (never disable the detection globally):
{
  "properties": {
    "reason": "Authorized internal vulnerability scanner",
    "alertType": "SQL.DB_BruteForce",
    "state": "Enabled",
    "expirationDateUtc": "2026-12-31T00:00:00Z",
    "comment": "Scanner 10.20.0.5, ticket SEC-4821",
    "suppressionAlertsScope": {
      "allOf": [ { "field": "entities.ip.address", "in": ["10.20.0.5"] } ]
    }
  }
}
CI coverage gate (fails the deploy if the container sensor is not fully scheduled):
desired=$(kubectl get ds -n kube-system microsoft-defender-collector-ds -o jsonpath='{.status.desiredNumberScheduled}')
ready=$(kubectl get ds -n kube-system microsoft-defender-collector-ds -o jsonpath='{.status.numberReady}')
[ -n "$ready" ] && [ "$desired" = "$ready" ] || { echo "sensor not fully scheduled: ${ready:-0}/${desired:-0}" >&2; exit 1; }
Why: The suppression kills exactly one noisy pattern (one alert type + one IP) and expires, so it can’t become a permanent blind spot — while the CI gate turns “plan enabled” into “sensor proven running,” which is the only definition of coverage that survives an incident review. </details>
Common beginner mistakes
“The toggle is green, so we’re protected.” The most expensive misconception in this whole lesson. An enabled plan is a billing fact. Coverage is a running sensor, the integration toggled on, and a test signal that actually produces an alert. The correct mental model: never trust a portal toggle — trust a Ready DaemonSet and a validation alert.
“CSPM and CWPP are the same thing, so one queue is fine.” They are different disciplines with different clocks. Posture findings are latent risk for an owner backlog (SLA in days); runtime alerts are active threats for the SOC (response in minutes). Route them to the same inbox and either the alerts drown in recommendations or the recommendations page the on-call at 3 a.m.
“Agentless scanning replaces the EDR sensor.” Agentless is point-in-time breadth from a disk snapshot — it is blind to runtime behaviour by design. It complements the sensor; it never replaces it. If you only run agentless, a live reverse shell is invisible.
“Enabling the plan enables the sensor.” For Servers you also need the WDATP (MDE) integration on, or you get agentless-only. For Containers the plan enables billing, but the DaemonSet still has to actually schedule on every node — a taint or PodSecurity rule can leave it unscheduled while the plan bills happily.
“I’ll flip admission control straight to deny for maximum security.” Ship every Gatekeeper constraint as dryrun/audit first, watch the violations for a full deploy cycle, then promote to deny. Going straight to deny on a live cluster is a leading cause of self-inflicted outages — the security control takes down the very workloads it was protecting.
“My PaaS SQL and Cosmos DB need an agent.” No. For PaaS SQL, Managed Instance, the OSS engines, and Cosmos DB, ATP is service-side — enable the plan and nothing gets deployed. Only SQL-on-VM rides the MDE sensor. Do not go hunting for an agent that was never supposed to exist.
“A suppression rule is set-and-forget.” A suppression without expirationDateUtc is a permanent hole. The scanner gets decommissioned, the exception stays, and a year later a real brute-force from that subnet is silently swallowed. Always set an expiry, and re-justify on renewal.
“Wider monitoring is safer.” FIM on /var/log, malware scanning on a petabyte data lake, exporting every Informational alert to the SOC — each one feels more thorough and each one buries the signal that matters (and runs up the bill). Narrow, deliberate scope beats blanket coverage every time.
Glossary
- CWPP (Cloud Workload Protection Platform) — runtime security for running workloads: watches processes, network, control-plane logs, and queries and raises alerts on active threats. The bodyguard.
- CSPM (Cloud Security Posture Management) — configuration-time security: scans declared state for misconfiguration and non-compliance and produces recommendations. The blueprint review.
- Defender for Cloud — Microsoft’s CNAPP; the umbrella that contains both the CSPM plans and the CWPP workload plans in this lesson.
- EDR (Endpoint Detection and Response) — real-time detection on an endpoint from a sensor that watches process, file, and network behaviour. Here provided by MDE.
- MDE (Microsoft Defender for Endpoint) — the EDR product whose sensor Defender for Servers integrates; provisioned via the
WDATPsetting. - MDVM (Microsoft Defender Vulnerability Management) — the vulnerability-assessment engine built into the MDE sensor and used for image scanning; replaces the retired legacy VA integrations.
WDATPsetting — the Defender for Cloud security setting that auto-provisions the MDE sensor. Off = agentless-only coverage even on Plan 2.- Agentless scanning — out-of-band assessment via a disk snapshot taken in Defender’s environment; zero footprint, point-in-time, blind to runtime behaviour.
- FIM (File Integrity Monitoring) — a Plan 2 feature that alerts on unexpected change to a defined set of files, directories, and registry keys.
- JIT (Just-in-Time) VM access — keeps management ports default-deny and opens a time-boxed, source-scoped allow only on approved request.
- Adaptive application controls — ML-baselined allow-listing signal that alerts when an off-baseline process runs on a group of similar VMs.
- Defender sensor / collector DaemonSet — the eBPF-based
microsoft-defender-collector-dspod that must run on every node for container runtime detection. - Azure Policy for Kubernetes — the AKS add-on that is Gatekeeper/OPA under the hood; provides admission control and hardening.
- Gatekeeper / OPA — the Open Policy Agent admission webhook that validates pods before they are admitted to the cluster.
- Admission control — enforcing guardrails at pod-creation time (block privileged, host-namespace, unapproved registries) before the pod is scheduled.
ConstraintTemplate/Constraint— Gatekeeper’s policy definition and its parameterized instance (e.g.K8sAllowedReposwith a repo list).dryrun/audit/deny— Gatekeeper enforcement actions: report-only, report-only, and block. Shipdryrun, promote todeny.- ATP (Advanced Threat Protection) — the behavioural, near-real-time database alerting (SQLi, brute force, anomalous access); service-side for PaaS engines.
- SQL Vulnerability Assessment (VA) — a posture scan of a database’s own configuration against a baseline; bundled into the SQL plan, uses express configuration by default.
- On-upload malware scanning — Defender for Storage capability that scans each new blob on upload for malicious content.
- Sensitive-data threat detection — Defender for Storage capability that raises alert severity when the affected container holds sensitive data.
- Suppression rule — a scoped, ideally expiring rule (
alertsSuppressionRules) that silences a specific benign alert pattern without disabling the detection tenant-wide. - Continuous export — the mechanism that streams alerts/recommendations out of Defender for Cloud to Log Analytics, Event Hubs, or Sentinel, filterable by severity.
- Cloud security graph / attack path — the correlation surface where CSPM posture and CWPP alerts meet, so a runtime alert on an already-exposed asset is prioritized higher.
- Sub-plan (P1 / P2) — the two Defender for Servers tiers; P1 is EDR + agentless scanning, P2 adds FIM, JIT, adaptive controls, and the 500 MB/day allowance.